
Market Overview
| Study Period | 2021 - 2031 |
|---|---|
| Market Size (2026) | USD 136.28 Billion |
| Market Size (2031) | USD 366.82 Billion |
| Growth Rate (2026 - 2031) | 21.90 % |
| Fastest Growing Market | Asia-Pacific |
| Largest Market | Asia-Pacific |
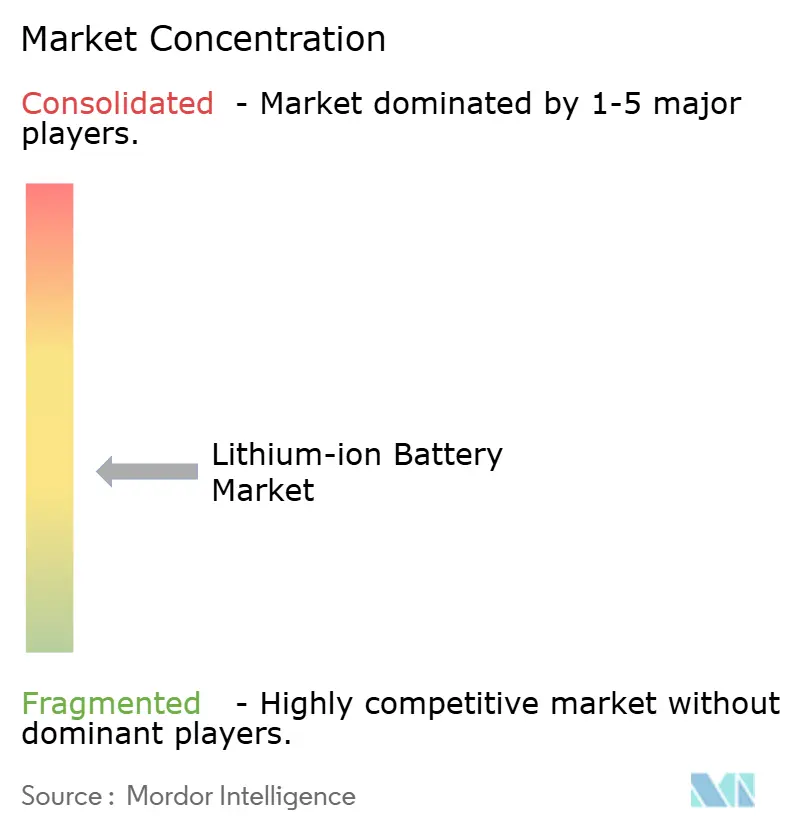
| Market Concentration | Medium |
Major Players *Disclaimer: Major Players sorted in no particular order Image © Mordor Intelligence. Reuse requires attribution under CC BY 4.0. | |
Lithium-ion Battery Market Analysis by Mordor Intelligence
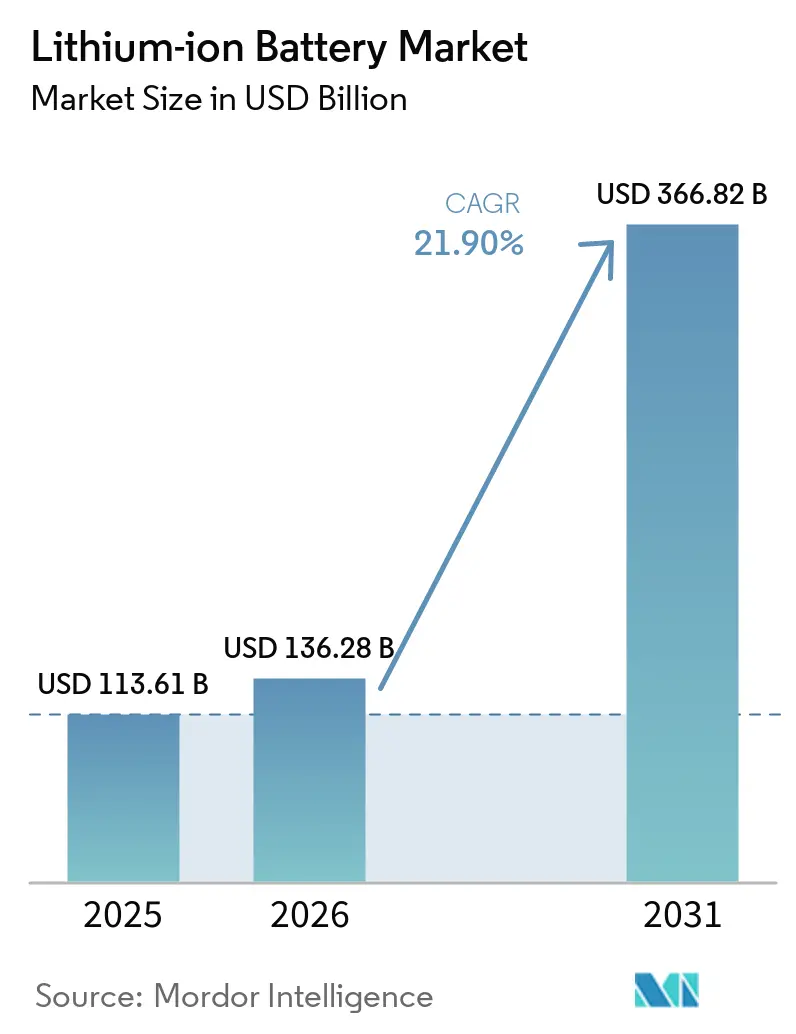
The Lithium-ion Battery Market size is expected to increase from USD 113.61 billion in 2025 to USD 136.28 billion in 2026 and reach USD 366.82 billion by 2031, growing at a CAGR of 21.90% over 2026-2031.
The lithium-ion battery market is riding a structural realignment in energy and mobility, stimulated by electric-vehicle scale-up, utility-scale storage roll-outs, and industrial electrification that together redraw material supply chains. China still accounts for roughly 80% to 85% of global capacity, yet policy shifts such as the U.S. Inflation Reduction Act and the European Battery Regulation are prompting parallel gigafactory build-outs in North America and Europe, gradually diluting the country’s dominance.[1]U.S. Department of Energy, “Inflation Reduction Act: Battery Manufacturing Provisions,” energy.gov Chemistry preferences are fragmenting: lithium iron phosphate captured half of 2025 cell shipments due to a USD 47 per kWh cost edge, whereas nickel-rich NMC variants continue to dominate premium long-range vehicles. Form-factor strategies are equally dynamic; cylindrical cells retained a 49.3% share in 2025, but pouch architectures that enable cell-to-pack designs are expanding briskly at 22.7% a year. Downstream demand is bifurcated: automotive retained 54.6% of 2025 revenue, yet stationary energy storage is growing 29.4% annually as U.S. utilities alone contract 96 GW of four-hour systems to meet renewable integration targets.
Key Report Takeaways
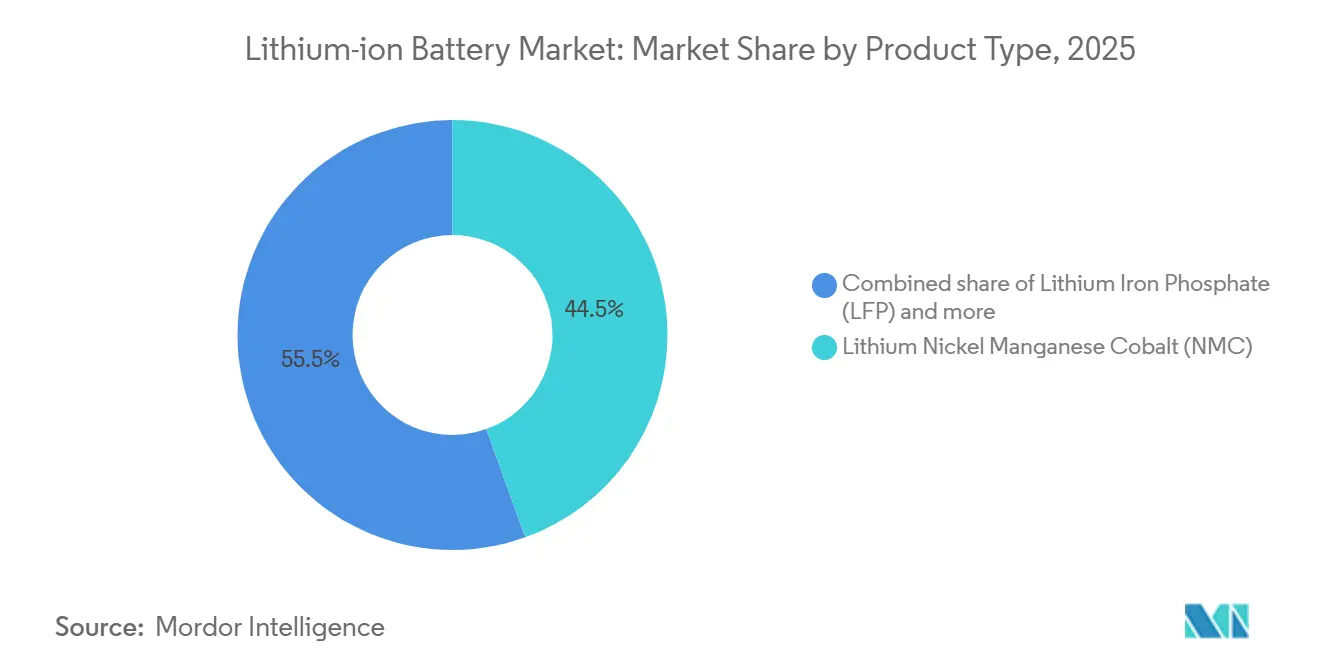
- By product type, Lithium Nickel Manganese Cobalt held 44.5% of the lithium-ion battery market share in 2025; Lithium Iron Phosphate is projected to expand at a 23.5% CAGR through 2031.
- By form factor, cylindrical cells led with 49.3% revenue share in 2025, while pouch cells recorded the fastest growth at 22.7% CAGR to 2031.
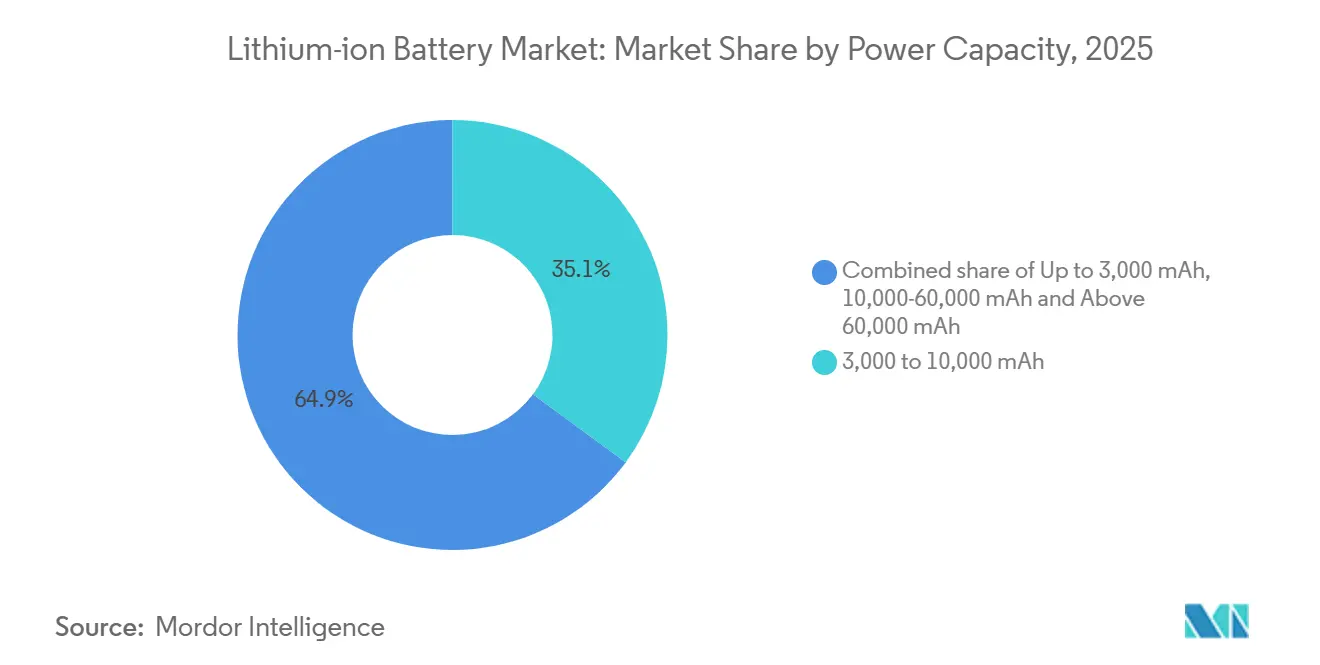
- By power capacity, 3,000–10,000 mAh cells accounted for 35.1% share of the lithium-ion battery market size in 2025; cells above 60,000 mAh are forecast to advance at 27.9% CAGR.
- By end-use industry, automotive commanded 54.6% of the lithium-ion battery market size in 2025, whereas stationary storage is expected to grow at a 29.4% CAGR to 2031.
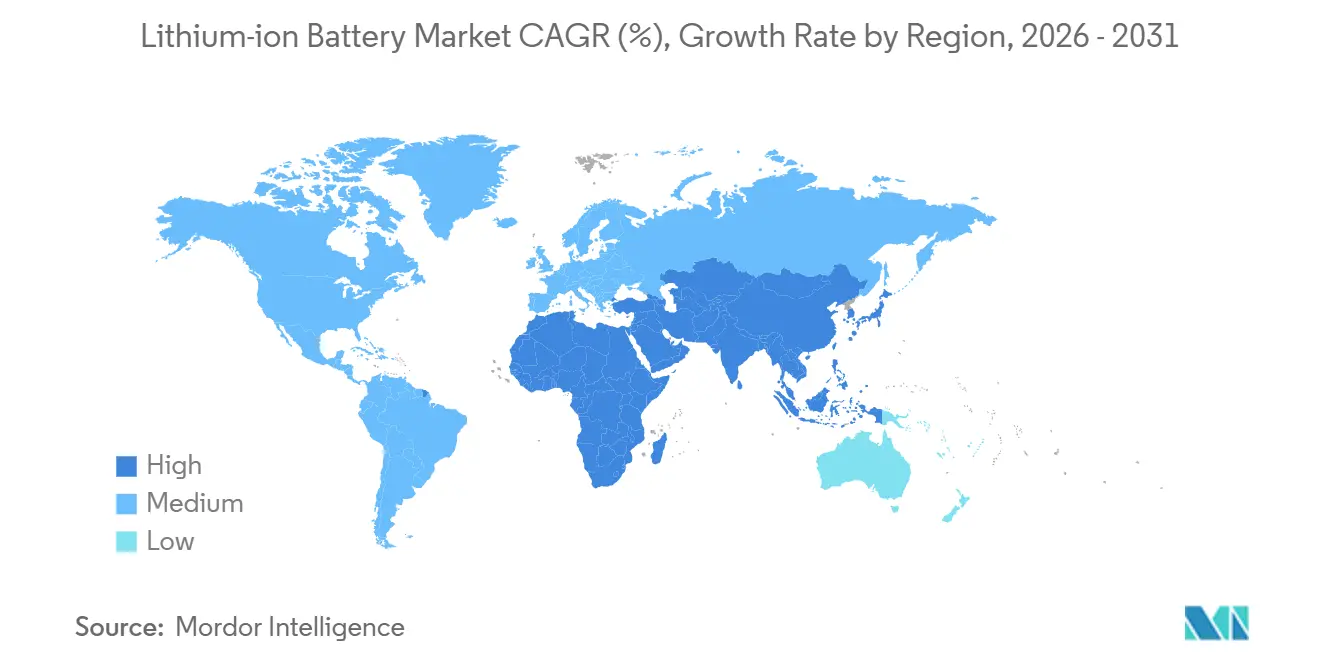
- By geography, Asia-Pacific captured 55.7% of the lithium-ion battery market share in 2025; the region is projected to post a 30.8% CAGR, the highest globally.
Note: Market size and forecast figures in this report are generated using Mordor Intelligence’s proprietary estimation framework, updated with the latest available data and insights as of January 2026.
Market Trends and Insights
Drivers Impact Analysis of Lithium-ion Battery Market*
| Driver | (~) % Impact on CAGR Forecast | Geographic Relevance | Impact Timeline |
|---|---|---|---|
| Surging demand for high-energy-density batteries in long-range EV platforms | 4.2% | Global, with concentration in North America, Europe, and premium segments in China | Medium term (2-4 years) |
| China's industrial policy ("Made in China 2025") accelerating domestic Li-ion gigafactory build-out | 5.8% | China core, spillover to ASEAN through joint ventures and technology transfer | Long term (≥ 4 years) |
| Rapid roll-out of utility-scale battery energy storage procurements in the United States | 3.6% | North America, particularly California, Texas, and states with renewable portfolio standards | Short term (≤ 2 years) |
| Stationary data-centre back-up migration from VRLA to lithium-ion in Nordic countries | 1.1% | Nordic region (Sweden, Norway, Finland, Denmark), early adoption in Germany and Netherlands | Medium term (2-4 years) |
| Maritime IMO GHG targets driving marine-grade Li-ion adoption in Europe | 1.4% | Europe (Norway, Denmark, Netherlands leading), expanding to Asia-Pacific coastal routes | Long term (≥ 4 years) |
| OEM shift to LFP chemistry for cost-sensitive entry-level EVs in India | 2.7% | India, with secondary effects in Southeast Asia and Latin America | Short term (≤ 2 years) |
| Source: Mordor Intelligence | |||


Surging Demand for High-Energy-Density Batteries in Long-Range EV Platforms
Automakers competing in the premium segment now specify packs between 75 kWh and 120 kWh to guarantee 400-mile driving ranges or better, a threshold proven by prototypes such as Mercedes-Benz EQXX and commercial models like the Lucid Air.[2]Mercedes-Benz Group, “Vision EQXX Technology Update,” mercedes-benz.com Nickel content above 90% pushes energy density past 250 Wh/kg but also heightens thermal-runaway risk, steering parallel investment toward solid-state electrolytes, lithium sulfur battery technologies, and ceramic separators. Supply security is tightening: original equipment manufacturers are locking multi-year offtake agreements directly with cell producers, bypassing traditional Tier-1 suppliers to align chemistry roadmaps with 2028–2030 model cycles. As a result, the lithium-ion battery market sees heightened vertical integration that redistributes bargaining power upstream. This move amplifies capital intensity but shortens development cycles, compressing the window for smaller entrants to catch up.
China’s Industrial Policy “Made in China 2025” Accelerating Domestic Li-ion Gigafactory Build-Out
Beijing targets 1,200 GWh of domestic capacity by 2030 under “Made in China 2025” and provincial incentives ranging from land grants to cut-rate electricity underpin cost structures foreign rivals struggle to match.[3]CATL Investor Relations, “Qilin 3.0 Cell-to-Pack White Paper,” catl.com CATL alone commissioned 70 GWh across Luoyuan and Luoyang between 2025 and 2026, while BYD added 25 GWh of LFP output in Shenzhen. The policy’s mandatory technology-transfer clauses let local firms absorb NCA and silicon-anode know-how from Korean and Japanese partners, broadening competitive depth. Concurrent investments in Indonesia and Thailand extend China’s ecosystem offshore to secure nickel laterite feedstock and to pre-empt potential trade barriers.
Rapid Roll-Out of Utility-Scale Battery Energy Storage Procurements in the United States
The Inflation Reduction Act’s 30% Investment Tax Credit for standalone storage unlocked 96 GW of projects under construction by late 2025, with California and Texas comprising 60% of that pipeline.[4]U.S. Energy Information Administration, “Battery Storage in the United States: Projects and Prospects,” eia.gov Co-located solar-plus-storage configurations qualify for the same credit, improving project internal rates of return by up to 300 basis points. Federal Energy Regulatory Commission Order 841 further enhances revenue stacking, allowing batteries to sell capacity, energy, and ancillary services in wholesale markets. Financing risk has eased since the Department of Energy’s Loan Programs Office extended USD 3.7 billion in conditional guarantees to domestic cell and recycling plants.
Stationary Data-Center Back-Up Migration from VRLA to Lithium-Ion in Nordic Countries
Hyperscale operators in Sweden, Norway, and Finland are replacing lead-acid UPS fleets with lithium-ion systems that halve footprint and triple service life, enabling participation in frequency-containment markets. Lithium iron phosphate chemistry dominates these retrofits, delivering 95% round-trip efficiency and lower thermal loads that help sites achieve power-usage-effectiveness below 1.3. Operators such as Equinix and Digital Realty have already reached commercial frequency-response revenues in Stockholm and Helsinki that offset 10% of annual UPS costs. National grids with high hydro and wind penetration benefit from the additional balancing resource, creating a symbiotic demand driver.
Restraints Impact Analysis of Lithium-ion Battery Market*
| Restraint | (~) % Impact on CAGR Forecast | Geographic Relevance | Impact Timeline |
|---|---|---|---|
| Graphite anode supply tightness owing to Chinese environmental curtailments | -2.8% | Global, with acute impact on non-Chinese cell producers lacking diversified anode sources | Short term (≤ 2 years) |
| High-voltage electrolyte additive cost inflation post-Ukraine conflict | -1.6% | Europe and North America, where fluorine compound supply chains were disrupted | Medium term (2-4 years) |
| US-EU trade barriers on critical minerals undermining trans-Atlantic supply chains | -2.1% | North America and Europe, particularly affecting cells destined for IRA-compliant EVs | Long term (≥ 4 years) |
| Recycling infrastructure lag delaying circular material flows in Oceania | -0.9% | Australia and New Zealand, with secondary effects on Asian supply chains | Long term (≥ 4 years) |
| Source: Mordor Intelligence | |||
Graphite Anode Supply Tightness Owing to Chinese Environmental Curtailments
China controls 65% of mined natural graphite and 95% of spherical processing, and environmental inspections that shuttered 30% of Inner Mongolia and Heilongjiang capacity during 2024 tightened global supply. Revised wastewater and particulate standards raised processing costs by up to USD 1,200 per tonne, while December 2023 export licensing favors domestic cell makers. Non-Chinese projects such as Syrah’s Vidalia and Nouveau Monde’s Quebec lines will cover less than 5% of 2030 demand. Silicon-blend anodes lower the graphite needs but remain early-stage.
High-Voltage Electrolyte Additive Cost Inflation Post-Ukraine Conflict
Fluorinated feedstocks, once sourced from Russia and Ukraine, underpinned 40% of Europe’s LiPF6 capacity, and disruptions since 2022 pushed prices from USD 12,000 to USD 38,000 per tonne by mid-2024. Chinese expansions in Jiangsu and Zhejiang have added 25,000 tpy, yet export allocations prioritize domestic needs, leaving European makers exposed. BASF’s 5,000 tpy LiPF6 plant in Germany, commissioned late 2025, offers localized relief but at 20% higher cost relative to Chinese incumbents. Elevated additive costs squeeze margins or delay launches of high-voltage NMC packs.
*Our forecasts treat driver/restraint impacts as directional, not additive. The impact forecasts reflect baseline growth, mix effects, and variable interactions.
Lithium-ion Battery Market Segment Analysis
By Product Type:
Cost-Focused LFP Gains GroundLithium iron phosphate commanded 50% of 2025 cell shipments, overtaking nickel-rich chemistries on the strength of a USD 47 per kWh advantage that shields manufacturers from lithium carbonate swings. The lithium-ion battery market size for LFP cells is projected to expand at 23.5% through 2031 as entry-level EVs in China, India, and Southeast Asia favor its thermal stability. Automakers are widening chemistry menus: Tesla reintroduced LFP in standard-range U.S. models, while General Motors added LFP modules to commercial variants of its Ultium platform. Concurrently, CATL’s cell-to-pack Qilin 3.0 lifts LFP energy density to 255 Wh/kg, narrowing the gap with NMC and attracting mid-range vehicles that previously insisted on nickel-rich chemistries.
NMC remains indispensable in luxury and long-range platforms that target 250-plus Wh/kg, but its share slid to 44.5% in 2025. NCA and solid-state prototypes push density even higher, yet cost and cobalt constraints restrain wide adoption. Lithium cobalt oxide continues to retreat in smartphones as handset capacities crest 5,000 mAh; meanwhile, lithium manganese oxide and lithium titanate remain confined to power tools and high-cycle buses. The lithium-ion battery market maintains portfolio diversity, but value is gravitating toward chemistries that balance cost, safety, and supply security.


By Form Factor:
Module-Free Designs Propel Pouch GrowthCylindrical cells retained a 49.3% share in 2025, anchored by Tesla’s 4680 and a legacy base of 18650s and 21700s in electronics. Yet pouch formats are slated for a 22.7% CAGR through 2031 as automakers adopt cell-to-pack architectures that integrate aluminum-laminate cells directly into vehicle chassis. Pouch flexibility improves volumetric efficiency by up to 60% and eliminates intermediate modules, trimming 15% pack mass. The lithium-ion battery market size for pouch cells, therefore, grows faster than any rival form factor.
Prismatic designs dominate Chinese OEM preferences and evolve toward load-bearing cell-to-body concepts that cut vehicle weight by 5% to 8%. Thermal strategies differ: cylindrical arrays require immersion or dedicated coolant channels, whereas pouch and prismatic stacks share cooling plates, reducing resistance. LG Energy Solution’s P5 system removes 40% of pack components via this approach. Manufacturing yields currently favor cylindrical lines, but module-free trends tilt capital toward pouch and large prismatic tooling over the forecast horizon.
By Power Capacity:
Commercial Vehicles Ignite High-Amp-Hour DemandCells within 3,000–10,000 mAh held 35.1% of 2025 shipments, but units above 60,000 mAh are set to rise at a 27.9% CAGR on the back of heavy-duty trucks, ships, and grid modules. Daimler Truck’s eActros 600 employs 280 Ah prismatic cells in a 600 kWh pack, enabling 500 km ranges at 40-ton gross weight. Corvus Energy’s 500 Ah cells underpin 4 MWh ferry systems that already meet 5,000 cycle life thresholds. The lithium-ion battery market share of the high-capacity segment will therefore widen quickly during 2026–2031.
Low-capacity cells below 3,000 mAh pivot to solid-polymer chemistries in wearables, while Li-ion titanate oxide battery technologies remain relevant for high-cycle applications, and the mid-tier 10,000–60,000 mAh range faces commoditization as Chinese suppliers sell below USD 0.10 per Wh. Certification costs under IEC 62133 and UL 2054 filter out sub-scale aspirants, consolidating share among vertically integrated leaders. In response, Panasonic’s 103 Ah cell for Toyota’s bZ4X shows how bespoke designs blend silicon-graphite anodes with nickel-rich cathodes to meet endurance targets.
By End-Use Industry:
Grid Storage Narrows the Gap with MobilityAutomotive retained 54.6% of 2025 revenue but will cede incremental share to stationary energy storage, which is growing 29.4% a year on the strength of solar-plus-storage economics in the United States and feed-in tariff reform in Germany. The lithium-ion battery market benefits directly from California’s 10.5 GW of operational grid batteries and ERCOT’s 6.8 GW under build, both reliant on four-hour LFP systems. Consumer electronics growth slows as smartphone replacement cycles lengthen, though remote work supports laptop and tablet demand.
Industrial power-tool makers have largely completed their shift from Ni-Cd and Ni-MH to 21700 lithium-ion packs, while aerospace and defense remain niche but lucrative, with Saft’s VL 41M cell meeting DO-311 flight standards at premium pricing. Marine, spurred by IMO mandates, favors LTO and NMC chemistries that tolerate saltwater abuse, further diversifying the revenue mix. Combined, these forces rebalance portfolio exposure across end-use verticals within the lithium-ion battery market.
Geography Analysis
APAC Lithium-ion Battery Market
Asia-Pacific commanded 55.7% of the 2025 value and is forecast to expand at 30.8% through 2031 as China, India, and Southeast Asia hurry to localize cathode, anode, and cell assembly. China alone commissioned 150 GWh of new capacity by early 2026, sustaining scale economies that ripple across ASEAN through joint ventures in Indonesia and Thailand. India’s incentive scheme earmarks INR 181 billion for advanced-chemistry cell plants, anchoring 50 GWh of prospective LFP lines by 2028 and drawing collaborations among Reliance, Panasonic, and CATL. Japan and South Korea continue to lead high-nickel NMC and silicon-anode research; Panasonic’s 4680 tie-up with Tesla in Kansas underscores that edge.
North America, Europe and APAC Lithium-ion Battery Market
North America’s share is rising as the Inflation Reduction Act requires 50% local battery components in 2024, escalating to 100% by 2029. Announced investments from General Motors, Ford, and Stellantis total USD 73 billion toward a 500 GWh regional footprint by 2030. Canada’s hydro-powered provinces attract cathode and precursor plants from BASF and Northvolt, while Mexico leverages USMCA rules and lower labor costs for pack assembly lines in Nuevo León and Jalisco. The lithium-ion battery market thus becomes tri-polar across Asia, North America, and Europe.
EMEA and South America Lithium-ion Battery Market
Europe is reshaping supply through the Battery Regulation that enforces carbon-footprint declarations from February 2025 and minimum recycled-content thresholds by 2031. Northvolt’s Skellefteå plant runs on renewable hydro and wind, cutting carbon intensity below 10 kg CO₂/kWh, yet construction overruns led to a 2025 Chapter 11 filing in the United States, highlighting capital risk. Germany’s ACC consortium is delayed to late 2026, while France, Italy, and Spain race to capture the impending demand. South America and the Middle East-Africa are nascent but signal early ambition, with Saudi Arabia’s NEOM planning a 10 GWh plant with Envision AESC for a 2028 start-up.

Regulatory Landscape
The regulatory environment is tightening around sustainability, traceability, and safety for lithium-ion cells and packs, with the EU Battery Regulation (Regulation (EU) 2023/1542) setting the most comprehensive framework across EV, industrial, and LMT batteries. Key near-term anchors include the EU recycling efficiency target of 65% for lithium-based batteries by end-2025, lithium recovery targets of 50% by end-2027 and 80% by end-2031, and battery passport requirements slated for 2027, which collectively push manufacturers to instrument supply chains for carbon-footprint and recycled-content declarations.
In the United States, incentives and compliance mechanisms shape investment timing and product qualification, including the Inflation Reduction Act local-content pathway that ties downstream EV affordability to domestic and partner supply chains, as well as DOE programs that de-risk manufacturing scale-up. Safety and permitting rigor is also increasing for stationary deployments, with emerging state-level measures such as California SB-283 (2025-2026) requiring early consultation with local fire authorities and post-installation fire safety inspections for energy storage systems. This reinforces demand for certified designs, validated BMS, and standardized fire-mitigation practices at the project level.
Competitive Landscape
The lithium-ion battery market shows moderate concentration: the top five suppliers, CATL, BYD, LG Energy Solution, Panasonic, and Samsung SDI, controlled roughly 65% of 2025 capacity, while regional mandates foster parallel ecosystems. CATL’s 37% share is reinforced by vertical integration into cathode precursors and recycling, and by licensing its Qilin 3.0 LFP cell-to-pack design to Ford and Stellantis despite foreign-entity restrictions. BYD’s captive model insulates margins and grants pricing leverage when supplying Toyota and Tesla, whereas LG Energy Solution and Samsung SDI pursue joint ventures in the United States and Europe to remain IRA-compliant.
Patent activity in silicon-anode blends and dry-electrode coating hints at the next battleground. Tesla’s Maxwell-derived dry process halves solvent use and drops manufacturing energy 50%, but yields below 80% delayed the 4680 ramp in Austin and Berlin. Start-ups such as QuantumScape and Solid Power remain in pre-commercial phases, yet Toyota’s 2027 target for sulfide-electrolyte solid-state volumes accelerates incumbents’ R&D timelines. Niche players, including Microvast and A123 Systems, win contracts in heavy-duty fleets where 6C charging and long cycle life trump energy density, but certification hurdles under UN 38.3 and UL 2580 limit the pace of new market entrants.
Regional fragmentation grows as governments tie consumer subsidies to local content: China’s “Made in China 2025” underpins East-Asian dominance, the Inflation Reduction Act drives North-American build-outs, and the EU Battery Regulation steers European value chains toward low-carbon cells. Currency swings and input-cost volatility amplify the need for diversified cathode, anode, and electrolyte supply, prompting producers to adopt multi-chemistry portfolios. As a result, bargaining power shifts repeatedly along the chain, keeping pricing pressure high despite robust aggregate demand.
Lithium-ion Battery Industry Leaders
Contemporary Amperex Technology Co., Ltd. (CATL)
BYD Company Limited
LG Energy Solution Ltd.
Panasonic Holdings Corp.
SK On Co., Ltd.
- *Disclaimer: Major Players sorted in no particular order
Lithium-ion Battery Market Companies Covered in this Report
- Contemporary Amperex Technology Co., Ltd. (CATL)
- BYD Company Limited
- LG Energy Solution Ltd.
- Panasonic Holdings Corp.
- Samsung SDI Co., Ltd.
- SK On Co., Ltd.
- AESC (Envision AESC Group)
- CALB Co., Ltd.
- Gotion High-Tech Co., Ltd.
- EVE Energy Co., Ltd.
- Farasis Energy Inc.
- Sunwoda Electronic Co., Ltd.
- Murata Manufacturing Co., Ltd.
- VARTA AG
- Toshiba Corporation
- Saft Groupe SAS
- Northvolt AB
- Microvast Holdings, Inc.
- A123 Systems LLC
- Hitachi Energy Ltd.
- Lithium Werks BV
- Tesla Inc. (Battery Division)

Market Opportunities and Future Outlook
Policy-led localization and scale procurement are creating room across cells, components, and downstream systems integration. In India, the policy pipeline is now visible in cleared proposals totaling Rs 84,515 crore (March 2026) for domestic lithium-ion cell and component manufacturing, which supports new entrants and Tier-2 and Tier-3 component capacity beyond cell assembly. Separately, the UK Battery Strategy sets a named manufacturing anchor of over 100 GWh domestic capacity by 2030, reinforcing opportunities for equipment suppliers, precursor and cathode plants, and pack integrators aligned to local sourcing requirements.
Stationary storage is expanding the addressable market for lithium-ion beyond mobility. China set a national new energy storage installed-capacity target of over 180 GW by 2027, supported by large investment plans, while US policy mechanics (such as standalone storage eligibility under federal incentives) sustain multi-year project backlogs. Compliance-led demand is also building around circularity and data infrastructure, with the EU battery passport timeline (2027) and recovery targets supporting recycling joint ventures, black mass processing, and digital traceability systems that can document material provenance and recycled-content claims across EV and industrial batteries.
Recent Industry Developments in Lithium-ion Battery Market
- June 2026: CATL introduced the TENER Sodium Energy Storage System positioned for grid-scale deployments and outlined a pathway to cumulative shipments reaching 1 GWh by end-2026. The expansion of large-format storage portfolios alongside lithium-ion increases competitive pressure on system pricing and delivery schedules for utility-scale projects.
- May 2026: LG Energy Solution Vertech signed a supply agreement with DTE Energy to develop battery energy storage solutions using Michigan-made batteries. The agreement reinforces US localization strategies for stationary storage and links cell supply to utility-side project execution in a key North American demand center.
- June 2024: Stellantis and CATL announced an investment of up to USD 4.1 billion in a joint venture for a large-scale LFP battery plant in Spain. The project supports European LFP capacity and helps align the regional supply chain with EU sustainability and traceability requirements.


Lithium-ion Battery Market Report Scope and Research Methodology
Market Definition and Coverage
This market covers the value of newly manufactured lithium-ion rechargeable cells and integrated battery packs that are sold into end uses such as vehicles, stationary energy storage, electronics, and industrial equipment, across global demand.
Scope exclusions: We exclude lead-acid and nickel-metal hydride batteries, lab-stage solid-state prototypes, battery recycling revenues, and battery metal trading activity.
Segments Covered in This Report
- By Product Type
- Lithium Cobalt Oxide (LCO)
- Lithium Iron Phosphate (LFP)
- Lithium Nickel Manganese Cobalt (NMC)
- Lithium Nickel Cobalt Aluminium (NCA)
- Lithium Manganese Oxide (LMO)
- Lithium Titanate (LTO)
- By Form Factor
- Cylindrical
- Prismatic
- Pouch
- By Power Capacity
- 0 to 3,000 mAh
- 3,000 to 10,000 mAh
- 10,000 to 60,000 mAh
- Above 60,000 mAh
- By End-use Industry
- Automotive (EV, HEV, PHEV)
- Consumer Electronics
- Industrial and Power Tools
- Stationary Energy Storage
- Aerospace and Defense
- Marine
- By Geography
- North America
- United States
- Canada
- Mexico
- Europe
- United Kingdom
- Germany
- France
- Spain
- Nordic Countries
- Russia
- Rest of Europe
- Asia-Pacific
- China
- India
- Japan
- South Korea
- Malaysia
- Thailand
- Indonesia
- Vietnam
- Australia
- Rest of Asia-Pacific
- South America
- Brazil
- Argentina
- Colombia
- Rest of South America
- Middle East and Africa
- United Arab Emirates
- Saudi Arabia
- South Africa
- Egypt
- Rest of Middle East and Africa
- North America
Data Sources, Market Sizing, and Validation
Desk Research
Desk research starts by building a clean fact base on battery demand and supply, and then aligning it to lithium-ion only. Public sources such as the International Energy Agency, the US Geological Survey, UN Comtrade trade statistics, and national statistics agencies help us track EV adoption, storage deployments, and upstream material availability. We also use resources such as peer-reviewed journals and patent databases to understand chemistry shifts and format trends that affect average selling prices.
On the company side, filings, annual reports, investor presentations, and reputable press coverage are used to map capacity additions, plant ramp timing, and technology milestones. For hard-to-collect items like shipment directionality and tender volumes, we selectively use paid databases focused on import and export shipments, contracts and tenders, and company financials and intelligence. The sources listed here are illustrative, and many other public references were reviewed to fill gaps and validate assumptions.
Primary Interviews and Surveys
Primary work is used to pressure-test the desk model and close the gaps that public data does not explain well, including near-term pricing steps, mix changes by chemistry, and the pace of capacity utilization. We speak with a mix of cell and pack suppliers, material ecosystem participants, OEM and integrator teams, and channel-side experts, with coverage across APAC, EMEA, and the Americas so regional ramps are not overgeneralized.
Distribution of primary research fieldwork respondents
| Company type | Respondent position | Region |
|---|---|---|
| Top tier: 30% | CXOs: 12% | APAC: 47% |
| Mid tier: 55% | Functional/Unit leaders: 42% | EMEA: 33% |
| Smaller Players: 15% | Managers: 46% | Americas: 20% |
Market-Sizing & Forecasting
Sizing is built using a top-down approach where EV production and sales, grid storage additions, and electronics demand indicators are translated into a lithium-ion demand pool, and then converted to value using region and application level pricing logic. To keep the number realistic, selective bottom-up approximations are used as cross-checks, such as sampled supplier capacity roll ups, channel checks on pack versus cell pricing spreads, and a simple ASP x volume sanity check for high-volume applications.
Key inputs in the model include EV penetration by region, stationary storage installations, cell and pack pricing by chemistry (such as LFP versus NMC families), announced capacity and ramp schedules, and mix by form factor (cylindrical, prismatic, and pouch). Where a bottom-up data point is missing for a country or end use, we backfill using trade flows, utilization ranges, and expert-validated mix assumptions, and then the impact is reviewed before totals are locked.
Forecasting is done using scenario analysis supported by multivariate regression on the main demand drivers, since adoption and pricing can move together but not always in a straight line. The final forecast path is adjusted only after expert feedback confirms that the implied volumes and price steps match what is feasible in procurement cycles and factory ramp timelines.
Data Validation & Update Cycle
Outputs are checked against independent signals so the model does not drift, including published battery deployment commentary, trade and production trends, and the implied kWh per vehicle and storage unit. If a region shows an unusual jump, the drivers are re-tested and primary respondents are re-contacted to confirm whether it is a real step change or an input error.
A multi-step review is followed before sign-off, where assumptions, calculations, and the final totals are rechecked by another analyst and then aligned with the narrative. The report is refreshed annually, and interim updates are made when material events occur such as major capacity delays, sharp commodity-linked price resets, or sudden policy changes. Before delivery, a fresh pass is done so clients receive the most current view that can be supported by the evidence trail.
Mordor Intelligence's Lithium Ion Battery Market Size Versus Other Published Estimates
Published market sizes for lithium-ion batteries often do not line up because the underlying scope and conversion steps are not the same. Differences usually come from what is counted as the market (cells only versus cells plus packs), which applications are emphasized, and how pricing is converted from kWh level signals into USD values.
The main gap comes from whether pack integration value and non-lithium chemistries are blended into the total, where Mordor Intelligence counts only newly made lithium-ion cells and packs sold into defined end uses and excludes recycling and battery metals trading, which can inflate some published figures. Timing also matters because pricing can change quickly, and some sources use a broad 2025 value statement while others anchor to a different pricing window or apply aggressive versus conservative adoption cases without re-validating the implied kWh volumes.
Benchmark comparison
| Source | Market Size | Gaps in Research Methodology |
|---|---|---|
| Mordor Intelligence | USD 113.61 B (2025) | |
| Energy Agency Commentary A | USD 150.00 B (2025) | Uses a high-level value statement that can reflect broader battery market activity and price timing effects, with less transparency on whether the number is pack-level, cell-level, or blended across applications. |
| Industry Publisher B | USD 88.60 B (2025) | Often starts from a narrower demand capture and a different pricing baseline for 2025, which can understate value when fast-growing EV and storage deployments are priced using conservative ASP steps. |
The comparison shows that the spread is mostly created by scope choices and by how kWh is translated into USD using chemistry and application mix. By keeping the steps traceable to demand indicators, mix assumptions, and checked price paths, the final total stays easier to reproduce and to audit when new capacity and pricing signals emerge.


Key Questions Answered in the Report
How large is the lithium-ion battery market in 2026?
It stands at USD 136.28 billion and is set to hit USD 366.82 billion by 2031, reflecting a 21.9% CAGR.
Which chemistry leads global cell shipments today?
Lithium iron phosphate captured about 50% of 2025 shipments thanks to a USD 47 per kWh cost edge.
What segment is growing fastest by application?
Stationary energy storage is advancing at a 29.4% CAGR as utilities procure four-hour battery systems.
Which region contributes most to manufacturing capacity?
Asia-Pacific held 55.7% of 2025 value and continues to expand rapidly under China’s industrial policies.
How will U.S. policy affect future supply chains?
The Inflation Reduction Act ties consumer tax credits to local component and mineral content, driving a 500 GWh North-American capacity build-out by 2030.
Page last updated on:


 Your data is secure and never sold or shared.


