
Liquid Filling Machines Market Size and Share
Market Overview
| Study Period | 2020 - 2031 |
|---|---|
| Market Size (2026) | USD 5.83 Billion |
| Market Size (2031) | USD 7.49 Billion |
| Growth Rate (2026 - 2031) | 5.11 % |
| Fastest Growing Market | Asia Pacific |
| Largest Market | Asia Pacific |
| Market Concentration | Low |
Major Players *Disclaimer: Major Players sorted in no particular order Image © Mordor Intelligence. Reuse requires attribution under CC BY 4.0. | |
Liquid Filling Machines Market Analysis by Mordor Intelligence
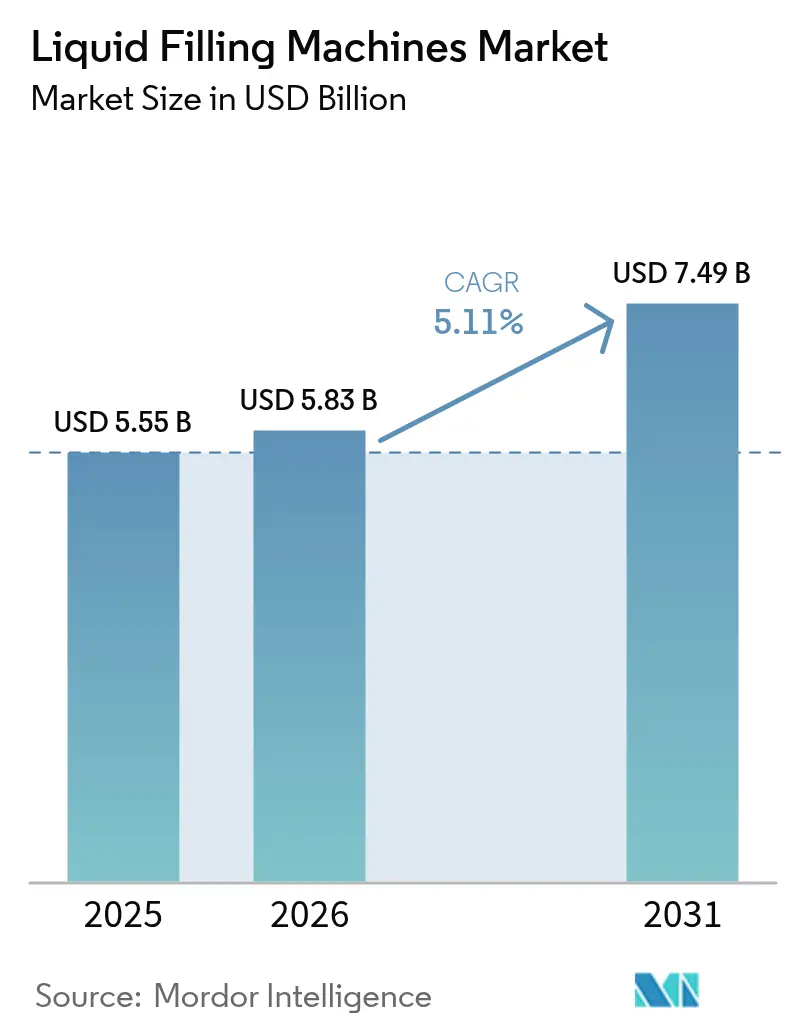
The liquid filling machines market size is expected to grow from USD 5.55 billion in 2025 to USD 5.83 billion in 2026 and is forecast to reach USD 7.49 billion by 2031 at 5.11% CAGR over 2026-2031. Rising packaged beverage consumption, pharmaceutical aseptic-processing expansion and accelerated Industry 4.0 adoption anchor this growth path. Asia-Pacific leads demand on the back of large-scale manufacturing investments, while North America sustains momentum through high-value pharmaceutical and nutraceutical production lines. Automation, sustainability features and smarter dosing technologies have become baseline purchase criteria, and suppliers that combine these elements with robust service networks continue to secure repeat orders. Capital expenditure headwinds and skilled-labor shortages temper near-term uptake, yet customer surveys show intent to upgrade remains high as operators chase throughput gains and quality consistency.
Key Report Takeaways
- By liquid type, consumable liquids dominated with 44.82% of liquid filling machines market share in 2025; liquid chemicals are projected to expand at an 8.29% CAGR through 2031.
- By equipment type, automatic systems held 59.62% of the liquid filling machines market share in 2025, and this category is advancing at a 6.38% CAGR to 2031.
- By filling technology, piston fillers controlled 44.91% of the liquid filling machines market size in 2025, while pump/peristaltic technology is on track for a 7.66% CAGR between 2026 and 2031.
- By end-user industry, food and beverage commanded 40.02% of the liquid filling machines market size in 2025; cosmetics and personal care is rising fastest at a 8.62% CAGR.
- By container type, bottles captured 55.02% of the liquid filling machines market size in 2025 and are projected to climb at a 9.12% CAGR through 2031.
- Regionally, Asia-Pacific controlled 39.88% of global revenue in 2025 and is widening its lead with a 9.31% CAGR to 2031.
Note: Market size and forecast figures in this report are generated using Mordor Intelligence’s proprietary estimation framework, updated with the latest available data and insights as of 2026.
Market Trends and Insights
Drivers Impact Analysis of Liquid Filling Machines Market*
| Driver | (~) % Impact on CAGR Forecast | Geographic Relevance | Impact Timeline |
|---|---|---|---|
| Rising demand for packaged beverages and dairy | +1.8% | Global; strongest in Asia-Pacific | Medium term (2-4 years) |
| Pharmaceutical aseptic-processing boom | +1.2% | North America and EU, spreading to Asia-Pacific | Long term (≥ 4 years) |
| Industry 4.0 drives automated, smart fillers | +1.0% | Global; concentrated in developed manufacturing hubs | Medium term (2-4 years) |
| Surge in single-serve functional drinks | +0.7% | North America and EU, emerging in Asia-Pacific | Short term (≤ 2 years) |
| Metred-dose rules for cannabis beverages | +0.4% | North America, select EU markets | Short term (≤ 2 years) |
| Retail "zero-waste" refill stations require in-store fillers | +0.3% | EU leading, North America following | Long term (≥ 4 years) |
| Source: Mordor Intelligence | |||
Rising Demand for Packaged Beverages and Dairy
Liquid dairy, ready-to-drink tea and coffee, and plant-based alternatives keep bottling halls busy. Dairy alone is expanding 2.2% annually through 2027, lifting orders for machines capable of handling varying viscosities and hot-fill conditions. Equipment such as Tetra Pak’s A1 1100 combines direct UHT processing with efficient changeover, reducing energy consumption and product waste.[1]“Tetra Pak Highlights Cutting-edge Innovations at Pack Expo 2024,” Tetra Pak, tetrapak.com Asian processors deploy similar high-speed lines to meet consumer preference for convenient single-serve formats, and regional bottlers often specify multi-lane fillers to run flavored milk, juices and water on one frame. Demand for accurate temperature control and hygienic design is creating a premium segment within the broader liquid filling machines market.
Pharmaceutical Aseptic-Processing Boom
Biologics and personalized medicine require sterile, low-volume filling. Syntegon’s Versynta microBatch, recently installed in North America, fills sub-5 ml containers with minimal product loss, making it ideal for costly mRNA formulations.[2]“Kindeva Drug Delivery and Syntegon Install First Versynta microBatch in North America,” Syntegon, syntegon.com EU GMP Annex 1 revisions accelerate adoption of barrier isolators and automated viable-air monitoring. The result is a sustained order pipeline for niche, high-margin machinery, especially in Europe and the United States, with Asia-Pacific contract manufacturers fast following. These dynamics keep the liquid filling machines market on an innovation treadmill where contamination control and flexible lot sizes drive R&D budgets.
Industry 4.0 Drives Automated, Smart Fillers
Manufacturers seek predictive maintenance, digital twins and real-time quality dashboards. China’s industrial equipment upgrading plan alone targets a 25% capex rise by 2027, channeling sizeable budgets into sensor-rich, servo-driven fillers.[3] “China Industrial Equipment Upgrading,” U.S. Department of Commerce, trade.gov Bosch Rexroth’s factory automation investments add open-control platforms that tie filler performance to plant-wide MES layers. India’s SAMARTH Udyog centers showcase similar deployments accessible to SMEs. These connected capabilities, while adding upfront cost, yield higher OEE and faster ROI, sustaining the liquid filling machines market expansion even when macroeconomic conditions cool.
Surge in Single-Serve Functional and Nutraceutical Drinks
Functional beverages packed with probiotics, vitamins and botanical extracts need fillers that deliver gentle handling and accurate micron-level dosing. Encapsulation processes preserve bioactive potency but raise viscosity, prompting a move toward peristaltic pumps for shear-sensitive flows. Cosmetic lines provide a parallel example: Mary Kay lifted mascara throughput without sacrificing quality using advanced metering solutions, a lesson beverage co-packers apply to immunity shots and energy tonics. Growth in this niche keeps specialized OEMs busy and enlarges the addressable slice of the liquid filling machines market.
Restraints Impact Analysis of Liquid Filling Machines Market*
| Restraint | (~) % Impact on CAGR Forecast | Geographic Relevance | Impact Timeline |
|---|---|---|---|
| High capital expenditure | -1.5% | Global, particularly affecting SMEs | Medium term (2-4 years) |
| Skilled-operator shortage | -1.0% | Global, acute in developed markets | Long term (≥ 4 years) |
| Food-grade lubricant supply volatility hits OEE | -0.6% | Global, supply chain dependent | Short term (≤ 2 years) |
| Cyber-security risk in connected fillers delays adoption | -0.4% | Developed markets with high automation | Medium term (2-4 years) |
| Source: Mordor Intelligence | |||
High Capital Expenditure
Interest rates sit well above pre-2023 averages, lifting borrowing costs just as processors plan line upgrades. Aluminum and PET input inflation amplifies budget stress, delaying some greenfield projects. Yet 66% of surveyed food processors still expect to buy primary equipment this cycle, with India’s production-linked incentives offsetting financing gaps for local buyers. This mix of pressure and policy support limits, but does not derail, the liquid filling machines market trajectory.
Skilled-Operator Shortage
Advanced fillers need technicians versed in PLC diagnostics and aseptic protocols. US manufacturing could leave 1.9 million roles unfilled by 2033 if training lags demand. OEMs combat this by standardizing HMI design, embedding self-guided maintenance videos and partnering with institutes through programs such as PMMI’s U Skills Fund. While automation covers some gaps, onboarding delays remain a brake on rapid equipment ramps, nudging buyers toward turnkey packages that include operator education.
*Our forecasts treat driver/restraint impacts as directional, not additive. The impact forecasts reflect baseline growth, mix effects, and variable interactions.
Liquid Filling Machines Market Segment Analysis
By Liquid Type:
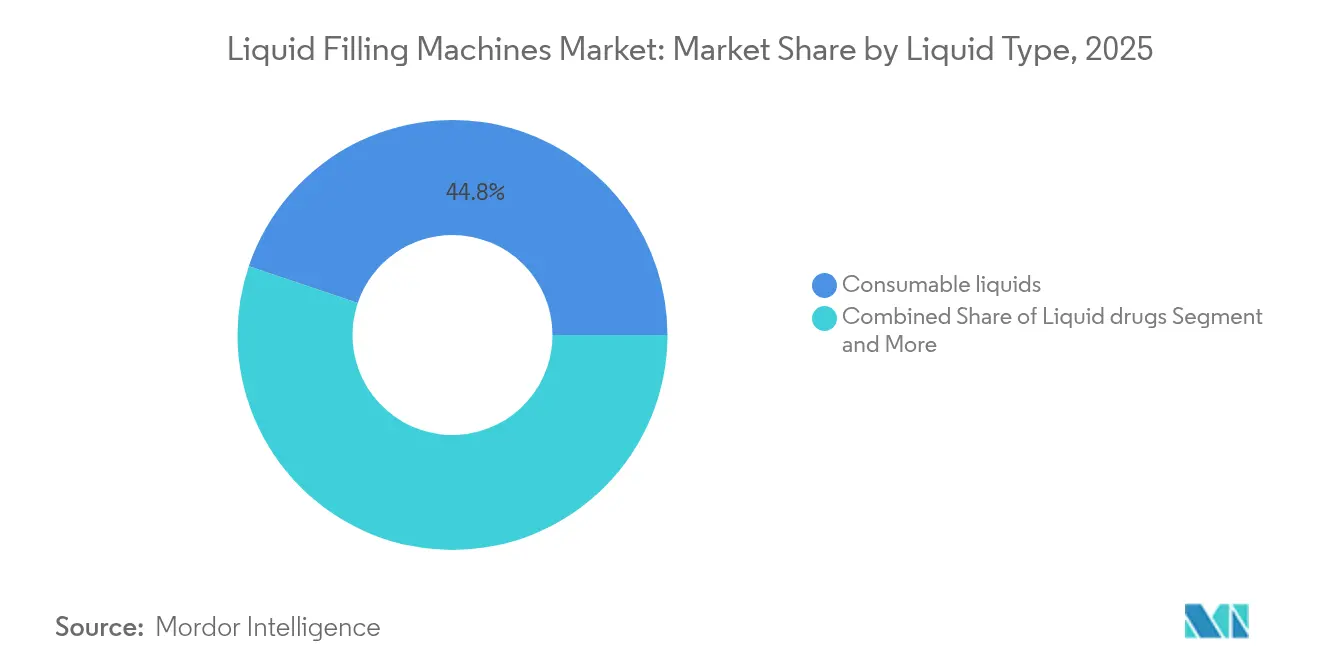
Chemicals Drive Specialized GrowthConsumable liquids held 44.82% of 2025 revenue, anchored by beverage producers that run high-speed PET and HDPE bottle lines. Rising RTD tea and flavored-milk volumes in Southeast Asia sustain fresh capex. Within the same year, liquid chemicals advanced at 8.29% CAGR, outpacing every other fluid class. Emerging solvent-free cosmetic formulations and specialty resins elevate demand for corrosion-resistant wetted parts, drip-free nozzles and CIP-ready designs.
The liquid filling machines market size for liquid chemicals is projected to widen as niche cosmetics, agrochemicals and automotive fluids require short-run, recipe-driven fillers. Specialty OEMs such as FRICKE Abfülltechnik now integrate gravimetric controls with explosion-proof housings to meet safety norms. Consumable segments remain vast, yet chemical producers are willing to pay premium margins for application-specific dosing accuracy, tilting supplier R&D priorities accordingly.


By Equipment Type:
Automation Accelerates EfficiencyAutomatic systems, at 59.62% share in 2025, form the backbone of large-volume plants. Pacific Packaging’s Intelli-Fil C handles 200 containers per minute while keeping deviation below 0.5 ml, evidence of the throughput advantage that secures its 6.38% CAGR outlook. Rising electricity and labor costs also push CFOs toward fully automatic platforms to lock in longer-term cost curves.
Semi-automatic machinery retains relevance in clinical trial filling, craft cosmetics and regional beverages where batch diversity is high. The liquid filling machines industry continues to supply modular frames that allow a future bolt-on to higher automation when volumes justify. This hybrid pathway eases adoption and cushions market volatility linked to capex cycles.
By Filling Technology:
Pump Systems Gain MomentumPiston fillers captured 44.91% revenue in 2025 thanks to their viscosity agility and straightforward maintenance. Gravity systems rule low-cost water lines, yet pump/peristaltic technology is sprinting ahead at 7.66% CAGR. It isolates product from moving parts, meeting sterile pharma needs and preventing flavor cross-talk in short changeovers. The liquid filling machines market size attributed to pumps is expanding fastest where small-dose accuracy trumps ultra-high speed.
Vacuum and pressure methods keep their niches—vacuum for medium-viscosity personal-care creams, pressure for carbonated soft drinks—but many plants blend technologies to optimize SKU mix. OEM development therefore emphasizes quick-swap manifolds and universal control software that manage multiple dispense principles under one interface.
By End-User Industry:
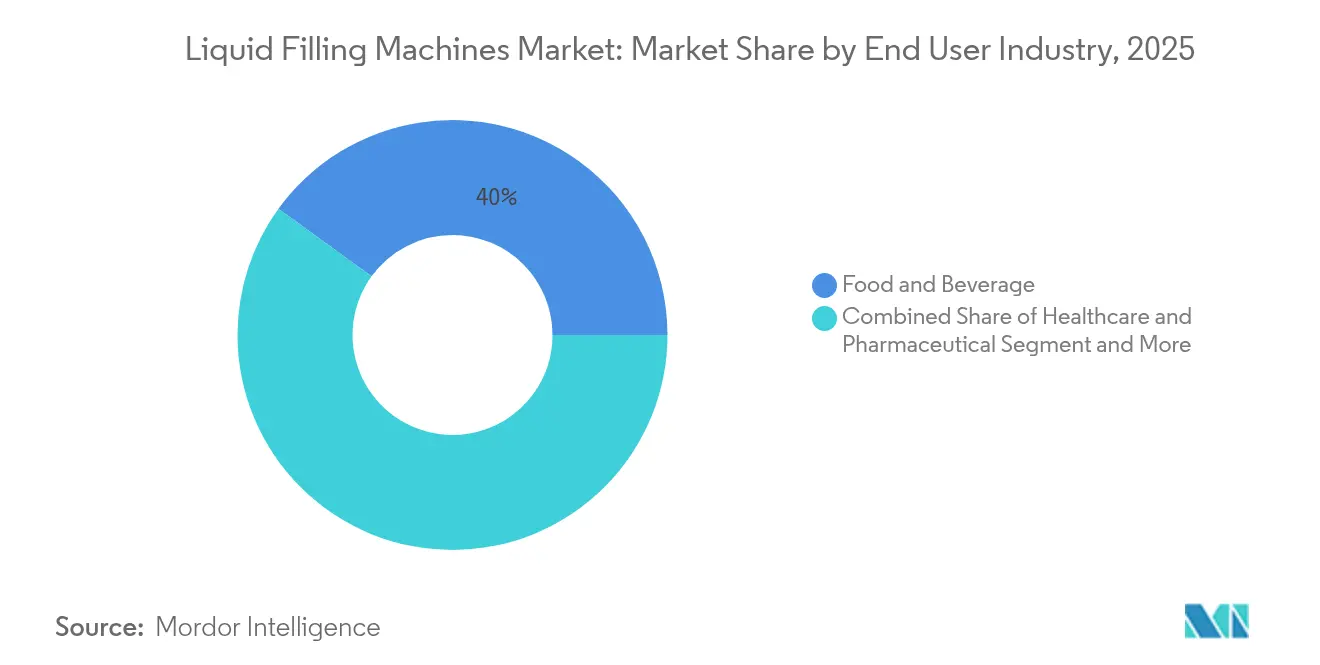
Cosmetics Accelerates InnovationFood and beverage ranked first at 40.02% of 2025 turnover, driven by nonstop SKU proliferation. Yet cosmetics and personal care, running a 8.62% CAGR, attract disproportionate engineering focus. Filling thicker emulsions without aeration, ensuring cleanroom compatibility for serums, and matching luxe packaging angles all require design tweaks. The liquid filling machines market share held by cosmetics is on course to climb as premium skincare launches multiply.
Healthcare and pharmaceutical users demand CFR 21 Part 11-compliant data logs and servo-controlled plunger movement to protect fragile biologics. Chemicals and diversified industries add volume through solvents, lube additives and bulk cleaning agents. Collectively, these sectors anchor a balanced demand pattern that cushions the market from single-industry swings.
By Container Type:
Bottles Dominate Across ApplicationsBottles earned 55.02% of 2025 sales and claim the fastest 9.12% CAGR, proving their versatility across water, OTC syrups and haircare. Glass still commands craft beverages, yet PET gains in dairy and functional drink channels due to lightweight transport benefits. Pouches serve cost-sensitive emerging markets, while cans absorb tariff-driven price fluctuation, nudging some brands toward alternative containers.
Refillable formats appear in EU zero-waste pilots, calling for compact, self-sanitizing units. The liquid filling machines industry gradually tailors hardware for this retail refill niche, opening a fresh after-sales stream as stations require frequent calibration and filter replacement.
Geography Analysis
APAC Liquid Filling Machines Market
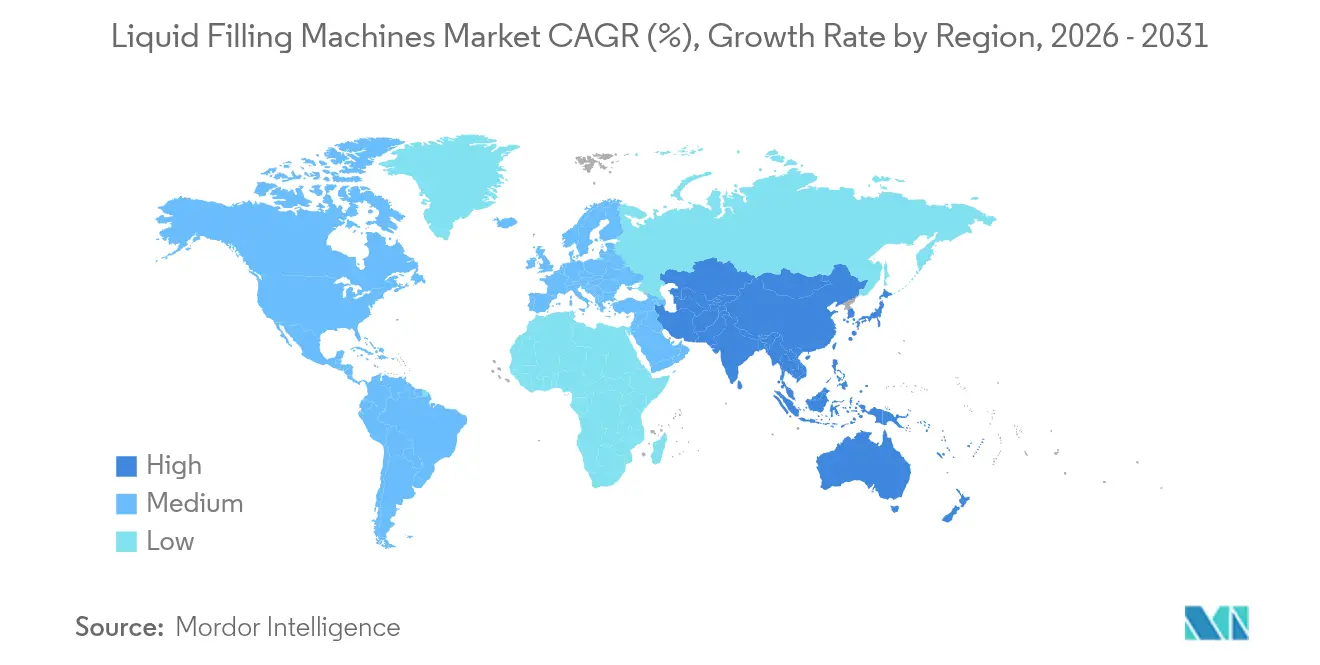
Asia-Pacific, owning 39.88% of 2025 global revenue, continues to outpace all regions with a 9.31% CAGR to 2031. China’s 25% capital investment push in manufacturing and India’s USD 165.1 billion inbound manufacturing FDI provide deep pools of demand. Multinationals install new plants while domestic OEMs supply mid-tier automatics, collectively lifting the liquid filling machines market.
North America Liquid Filling Machines Market
North America ranks second. Packaging machinery shipments rose 5.8% in 2023 and projections point to 8.0% average growth through 2027. Regulatory stringency in pharma and functional foods sustains premium machine orders, although recent aluminum tariffs raise canning costs. Companies respond by seeking fillers that switch among bottle, can and carton with minimal downtime, protecting ROI in a price-volatile packaging landscape.
EMEA and South America Liquid Filling Machines Market
Europe shows steady replacement demand, fuelled by sustainability mandates and carbon-footprint targets. Energy-efficient servo drives and water-saving CIP cycles sway purchase decisions. Meanwhile South America and Middle East & Africa log mid-single digit growth, constrained by currency swings and infrastructure gaps but buoyed by rising urban middle-class consumption. Service hubs set up by European and Asian OEMs are reducing lead times, improving competitiveness.

Regulatory Landscape
Liquid filling machine specifications are tightly linked to regulated end-markets, especially food, beverage, and pharmaceuticals. In pharmaceuticals, buyers typically look for features aligned with electronic records and audit trails under US FDA 21 CFR Part 11, alongside aseptic processing expectations that support isolators, contamination-control design, and validated cleaning regimes. Facility classifications, including ISO 14644 cleanroom classes, also shape machine selection around sealed dosing paths, cleanability, and materials of construction.
As Industry 4.0 upgrades connect production lines, compliance expectations broaden beyond product-contact hygiene to include data integrity and cybersecurity controls for networked filling equipment. This raises the bar for OEMs and integrators to provide secure connectivity, controlled user access, and traceable parameter management, particularly for higher-value pharmaceutical and nutraceutical filling operations in North America and Europe.
Competitive Landscape
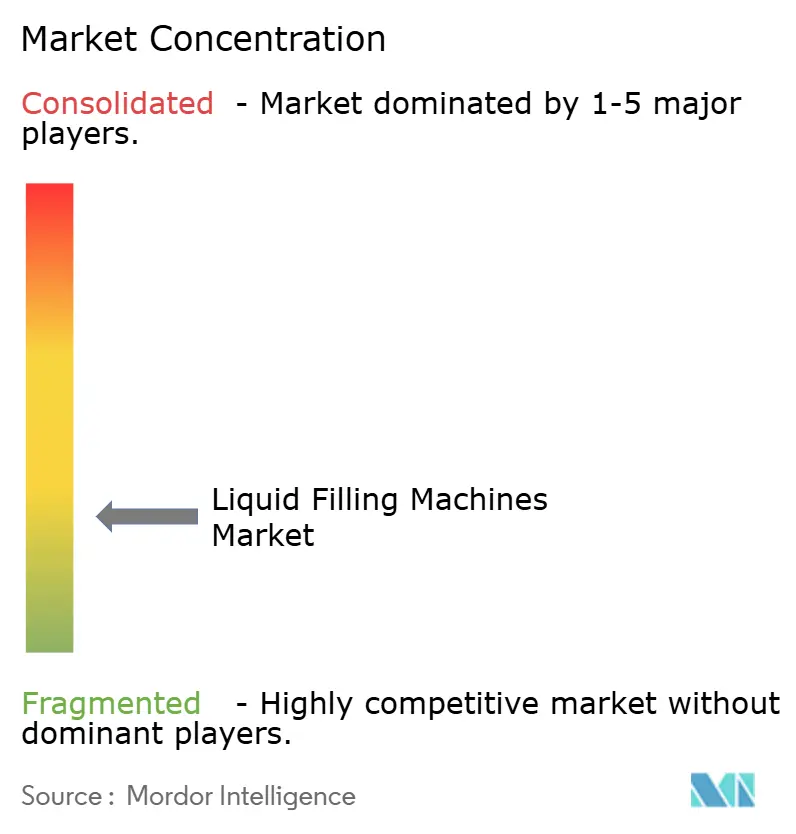
The market remains moderately fragmented. Syntegon, Krones and GEA anchor the high-performance tier, supported by deep R&D pipelines and global parts depots. Krones grew revenue 12.1% to EUR 5,293.6 billion in 2024 and maintains a EUR 4,289.5 billion backlog, confirming robust order flow. Syntegon highlights barrier-technology breakthroughs, tapping demand from biologics CDMOs. GEA leverages its process expertise to bundle upstream homogenizers with down-line fillers, winning turnkey bids.
Consolidation continues: ProMach acquired MBF and Zacmi to fortify wine, spirits and sauce capabilities. Optima and JBT focus on modular platforms that integrate dosing, capping and end-of-line inspection. Mid-sized Asian suppliers compete on cost and local service, often licensing subsystems from European partners. Differentiation now orbits around digital-twin compatibility, sustainable material handling and responsive global support, cementing long-term customer relationships within the liquid filling machines market.
Liquid Filling Machines Industry Leaders
Bosch Packaging Technology
GEA Group AG
JBT Corporation
Filling Equipment Co Inc.
Krones Group AG
- *Disclaimer: Major Players sorted in no particular order
Liquid Filling Machines Market Companies Covered in this Report
- Syntegon Technology (Bosch)
- GEA Group AG
- Krones AG
- JBT Corporation
- Tetra Laval Int'l
- KHS GmbH
- Coesia SpA
- Ronchi Mario SpA
- E-PAK Machinery
- Filling Equipment Co
- Scholle IPN
- OPTIMA Group
- IMA Group
- Serac Group
- Accutek Packaging
- ProMach
- APACKS
- Shemesh Automation
- Yundu BFS
- Universal Filling
- Sidel Group

Market Opportunities and Future Outlook
Opportunities are widening where customers want turnkey, digitally connected, and resource-efficient filling lines rather than standalone machines. A relevant proof point is the 2026 Hannover Messe demonstration by GEA, in partnership with Siemens, of a fully digital end-to-end beverage process line, highlighting cloud connectivity and equipment integration aimed at plant-wide performance management, recipe control, and faster changeovers amid SKU proliferation.
Capacity and localization efforts also support demand for suppliers with established service networks and regional manufacturing footprints. Krones has flagged production capacity expansions in the United States, China, and India in the second half of 2026 for its Filling and Packaging Technology segment, along with investments in production automation and logistics in Germany. This direction supports faster delivery, more standardized modules, and higher uptime support for global beverage and consumables customers. Separately, modular platform development, including GEA’s new flexible, modular beverage filling technology presentation at drinktec 2025, aligns with buyer preferences for scalable configurations across bottles, cans, and other formats while meeting energy efficiency and data traceability requirements that increasingly show up in procurement criteria.
Recent Industry Developments in Liquid Filling Machines Market
- May 2026: Krones Group AG released a new shrink tunnel for the Variopac Pro packer aimed at non-returnable container applications, targeting improved energy efficiency and shrink-wrap quality. The release strengthens end-of-line performance for beverage and liquid consumables plants that increasingly bundle packer purchases with filling equipment to lift total line OEE.
- April 2026: GEA Group AG, together with Siemens, demonstrated a fully digital end-to-end beverage process line at Hannover Messe (April 20-24, 2026), featuring the GSX 260 beverage separator and GEA Cloud connectivity. The demonstration supports the shift toward integrated, data-driven liquid processing and filling where differentiation comes through automation architecture and connected services.
- September 2025: Krones Group AG acquired 60% of GHS Separationstechnik GmbH and 100% of Can Systems Worldwide (CSW) to broaden its capabilities in process technology and filling and packaging equipment. The deals deepen vertical integration and expand the solution scope offered to liquid producers seeking one-source suppliers for processing, container handling, and line engineering.


Liquid Filling Machines Market Report Scope and Research Methodology
Market Definition and Coverage
For this methodology, the liquid filling machines market includes equipment used to dispense and fill liquid products into containers on packaging lines, covering industrial and consumer goods settings, and measured as revenue from machine sales and related system supply.
Scope exclusions: We exclude downstream packaging materials and consumables, along with contract packaging services.
Segments Covered in This Report
- By Liquid Type
- Consumable liquids
- Liquid drugs
- Industrial liquids
- Liquid chemicals
- Other liquid Types
- By Equipment Type
- Automatic
- Semi-automatic
- By Filling Technology
- Gravity
- Piston
- Pump / Peristaltic
- Vacuum
- Pressure
- By End-user Industry
- Food and Beverage
- Healthcare and Pharmaceutical
- Cosmetics and Personal Care
- Chemicals
- Other End-User Industry
- By Container Type
- Bottles
- Pouches
- Cans
- Other Container Types
- By Geography
- North America
- United States
- Canada
- Mexico
- Europe
- Germany
- France
- Italy
- United Kingdom
- Spain
- Rest of Europe
- Asia-Pacific
- China
- Japan
- India
- South Korea
- ASEAN
- Rest of Asia-Pacific
- South America
- Brazil
- Argentina
- Rest of South America
- Middle East and Africa
- Middle East
- Saudi Arabia
- United Arab Emirates
- Turkey
- Rest of Middle East
- Africa
- South Africa
- Kenya
- Rest of Africa
- Middle East
- North America
Data Sources, Market Sizing, and Validation
Desk Research
Desk work started with setting the market boundary and building a clear view of demand drivers that can be tracked year to year. We used public sources such as UN Comtrade trade statistics, World Bank and IMF macro indicators, US Census Bureau manufacturing data, Eurostat industrial production series, and International Trade Administration releases to understand where packaging equipment demand is rising by geography.
We then cross-checked the direction using company annual reports and investor presentations, reputable press coverage, and association sites tied to packaging and processing equipment. Where helpful, we also referenced paid subscriptions used for company financials and intelligence, shipment-level import and export signals, and patent databases to confirm technology direction and active investment areas. The sources mentioned above are illustrative only, and many other public references were also used during data collection, validation, and clarification.
Primary Interviews and Surveys
Primary work was used to test desk assumptions and convert them into sizing inputs, especially where public data is not specific to liquid fillers. We spoke with machine OEM-side experts, channel and integration partners, and end-user operations and packaging engineers across APAC, EMEA, and the Americas, so line-speed requirements, hygiene constraints, and capex timing could be reflected in the model.
Distribution of primary research fieldwork respondents
| Company type | Respondent position | Region |
|---|---|---|
| Top tier: 29% | CXOs: 13% | APAC: 43% |
| Mid tier: 51% | Functional/Unit leaders: 38% | EMEA: 30% |
| Smaller Players: 20% | Managers: 49% | Americas: 27% |
Market-Sizing & Forecasting
Sizing was built using a top-down and bottom-up approach, where packaging machinery demand is reconstructed from end-user output and investment intensity, and then split into liquid filling equipment using adoption and replacement cycles by industry. To keep the model grounded, totals were corroborated with selective bottom-up checks, including sampled average selling price ranges by line type, a volume view of new line additions, and channel feedback on order pipelines.
Inputs that mattered in this market included packaged beverage and liquid food production trends, pharmaceutical and personal care manufacturing growth, container format shifts (bottles, pouches, and similar), typical line speed and automation upgrades, and replacement timing tied to hygiene and compliance upgrades. Forecasts were produced using scenario analysis, where the base case follows expected capex cycles and packaging volume growth, and where expert feedback helps adjust the timing of major upgrade waves. Where supplier-side approximations had gaps, we used conservative ranges and then re-checked them through follow-up calls.
Data Validation & Update Cycle
Outputs were validated through stepwise checks, starting with consistency against independent signals such as industrial production, trade movement for packaging machinery categories, and capex commentary from major end-user industries. Outliers by region or year were reviewed, and assumptions were revisited when the model implied unrealistically fast penetration changes or price jumps.
Before sign-off, a second analyst review was completed to confirm calculations, currency handling, and the logic behind each key assumption. Reports refresh annually, and interim updates are triggered when material events occur, for example major policy changes, supply chain shocks, or step changes in end-user investment. Right before delivery, an analyst performs a fresh pass so clients receive the most current view available.
Mordor Intelligence's Liquid Filling Machines Market Size Versus Other Published Estimates
Different sources often show different market sizes for liquid filling machines because they count different equipment sets, use different timing for price updates, or treat service and integration revenue in their own way. Differences also come from how aggressively end-user capex cycles are projected, which can move the curve in a machinery market.
The main gap comes from whether broader filling equipment and non-liquid packaging machines get bundled into the total, and in Mordor Intelligence estimates, only liquid-focused filling machine demand is counted. This is then cross-checked using end-user production trends and realistic replacement timing, instead of assuming uniform automation upgrades across all plants.
Benchmark comparison
| Source | Market Size | Gaps in Research Methodology |
|---|---|---|
| Mordor Intelligence | USD 5.83 B (2026) | |
| Trade Journal A | USD 6.60 B (2024) | Uses an earlier base year and applies a faster upgrade cycle, and the scope appears broad enough that adjacent filling equipment categories may be included. |
| Industry Publisher B | USD 4.84 B (2025) | Runs on a different base year with a longer forecast horizon, and the growth path suggests more conservative assumptions on replacement timing and price progression. |
Across these figures, the spread is mostly explained by scope choices and the pace assumed for automation and replacement cycles, followed by timing differences in price and currency updates. Our steps keep the market tied to visible demand signals and repeatable checks, which helps decision-makers compare years and regions without mixing adjacent equipment markets.


Key Questions Answered in the Report
What is the current value of the liquid filling machines market?
The market is valued at USD 5.83 billion in 2026 and is projected to reach USD 7.49 billion by 2031.
Which region leads demand for liquid filling equipment?
Asia-Pacific holds 39.88% of global revenue and is expanding fastest at a 9.31% CAGR.
Why are automatic fillers gaining share?
They cut labor costs, raise throughput and now embed Industry 4.0 features such as predictive maintenance, driving a 6.38% CAGR.
Which liquid type is growing quickest?
Liquid chemicals show the highest growth at an 8.29% CAGR due to specialty cosmetics and industrial formulations.
What container format dominates new installations?
Bottles account for 55.02% of 2025 spending and are set to grow 9.12% annually thanks to versatility across beverages, pharma and cosmetics.
Page last updated on:


 Your data is secure and never sold or shared.


