
Linear Motion System Market Size and Share
Market Overview
| Study Period | 2020 - 2031 |
|---|---|
| Market Size (2026) | USD 13.61 Billion |
| Market Size (2031) | USD 18.28 Billion |
| Growth Rate (2026 - 2031) | 6.08% CAGR |
| Fastest Growing Market | Asia Pacific |
| Largest Market | Asia Pacific |
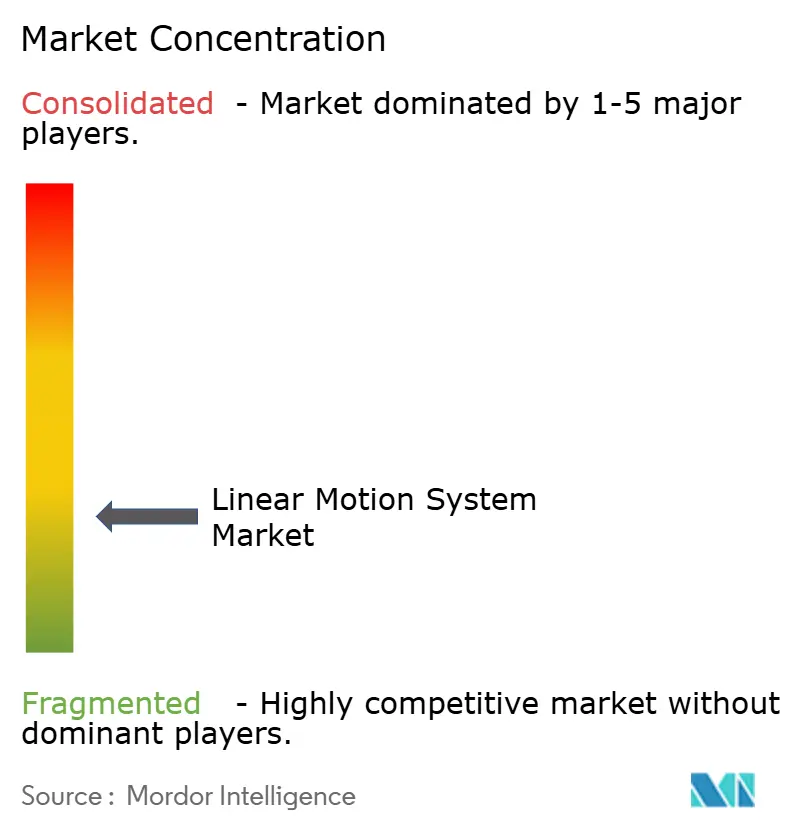
| Market Concentration | Low |
Major Players *Disclaimer: Major Players sorted in no particular order Image © Mordor Intelligence. Reuse requires attribution under CC BY 4.0. | |
Linear Motion System Market Analysis by Mordor Intelligence
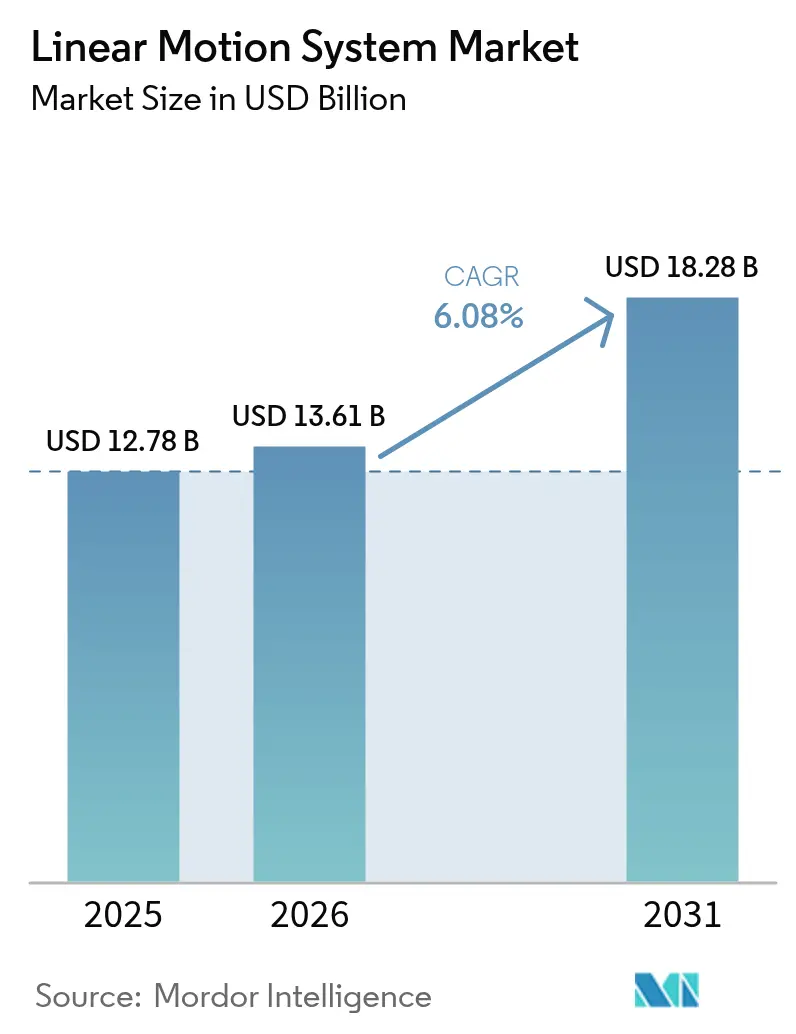
The linear motion system market size is projected to be USD 13.61 billion in 2026 and reach USD 18.28 billion by 2031, growing at a CAGR of 6.08% between 2026 and 2031. The shift from pneumatic and hydraulic platforms toward electromechanical and direct-drive architectures is accelerating as plant managers seek tighter positional repeatability, lower lifetime cost, and seamless Industry 4.0 connectivity. Multi-axis platforms dominate in revenue terms because complex machine-tool and semiconductor stages demand synchronized X-Y-Z motion, yet direct-drive topologies are winning share due to their maintenance-free operation and energy savings. Component innovation is moving toward edge-intelligent controllers that embed real-time diagnostics and trajectory optimization, while advances in linear guides and miniature actuators support cleanroom deployment across semiconductor and medical-device facilities. Manufacturers are also compressing commissioning cycles through modular, software-defined motion stacks that can be reconfigured digitally when product lifecycles shorten.
Key Report Takeaways
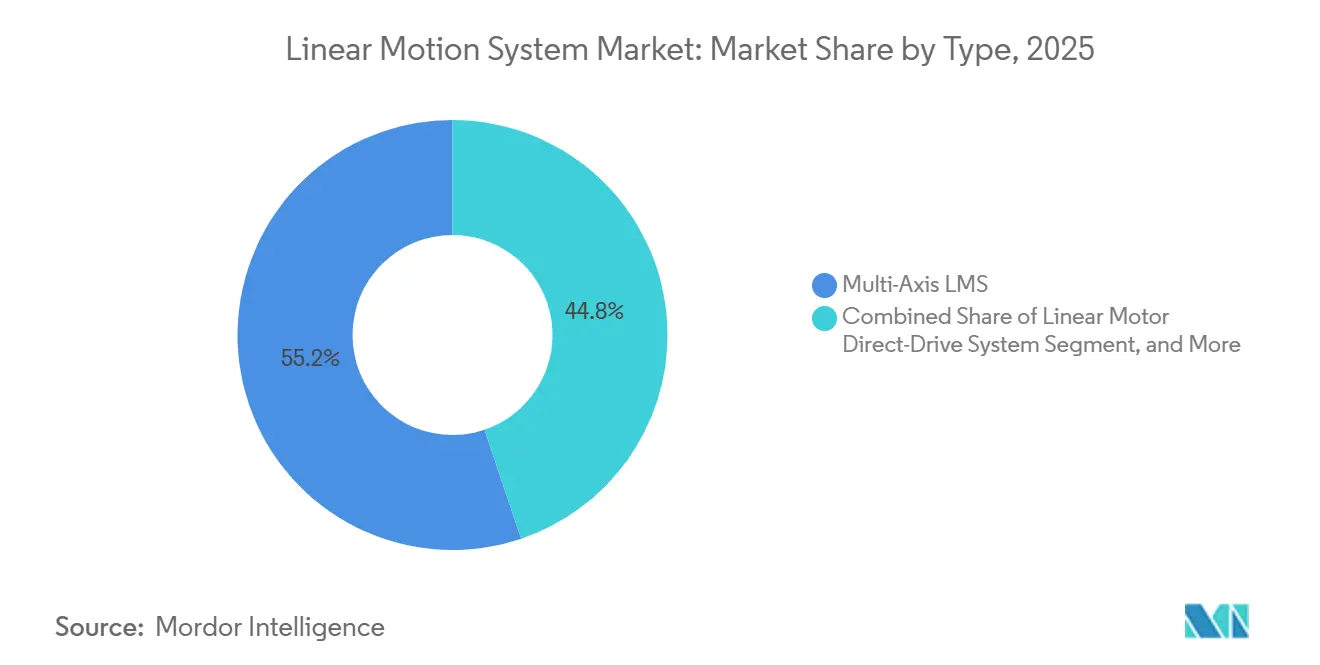
- By type, multi-axis platforms held 55.18% of the linear motion system market share in 2025, while linear motor direct-drive systems are forecast to expand at a 6.78% CAGR through 2031.
- By component, linear guides commanded 49.59% of 2025 revenue, yet controllers are projected to grow at a 6.96% CAGR to 2031.
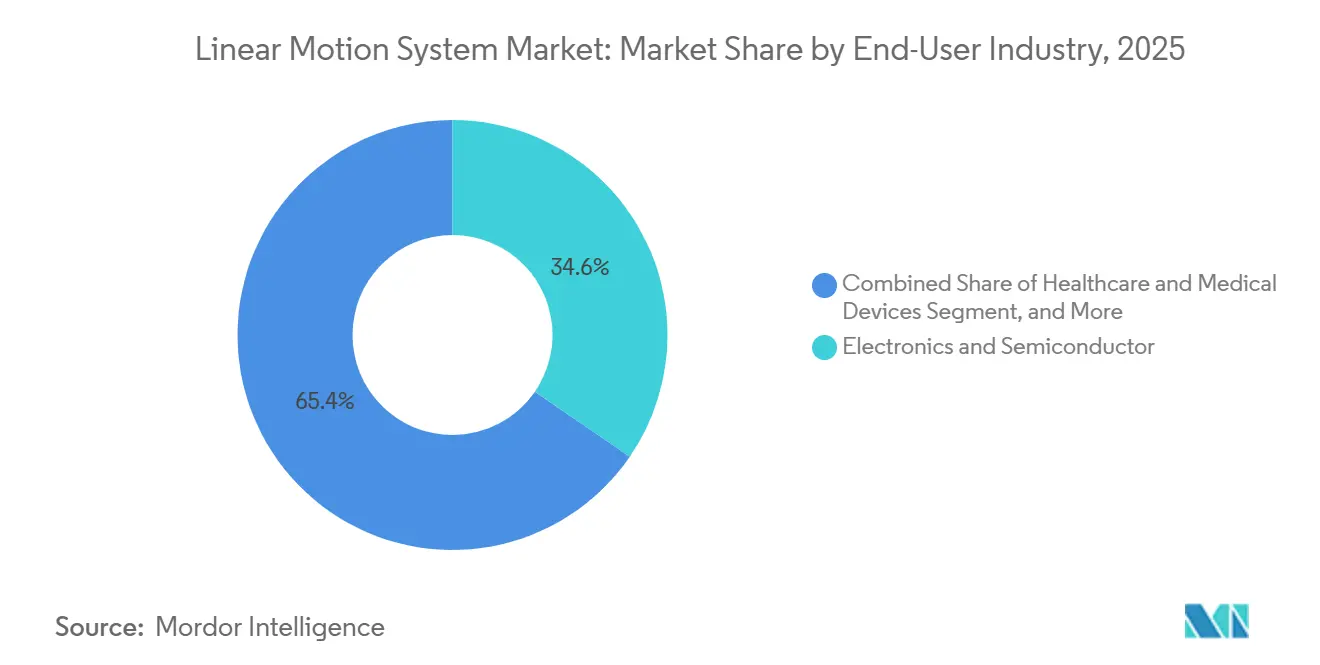
- By end-user industry, electronics and semiconductor fabrication accounted for 34.59% of 2025 demand and healthcare is expected to post a 6.55% CAGR, the fastest among all verticals, through 2031.
- By application, material handling captured 32.33% of 2025 installations, whereas robotics and cobots are poised to lead with a 7.01% CAGR to 2031.
- By geography, Asia-Pacific held 46.84% of global shipments in 2025, and South America is projected to advance at a 6.84% CAGR over 2026-2031.
Note: Market size and forecast figures in this report are generated using Mordor Intelligence’s proprietary estimation framework, updated with the latest available data and insights as of 2026.
Global Linear Motion System Market Trends and Insights
Drivers Impact Analysis*
| Driver | (~) % Impact on CAGR Forecast | Geographic Relevance | Impact Timeline |
|---|---|---|---|
| Accelerating Adoption of Industry 4.0 Automation | +1.80% | Global, with concentration in Germany, Japan, United States, South Korea | Medium term (2-4 years) |
| Expanding E-Commerce Boosting Automated Warehousing | +1.20% | North America and Europe core, APAC spill-over | Short term (≤ 2 years) |
| Rising Semiconductor and Electronics Precision Needs | +1.40% | APAC core (Taiwan, South Korea, Japan), spill-over to United States, Europe | Long term (≥ 4 years) |
| Demand Surge for Miniature Maintenance-Free LMS in Diagnostic Devices | +0.90% | North America and Europe, emerging in India, China | Medium term (2-4 years) |
| Sustainable Flexible-Package Formats Requiring High-Precision Motion | +0.60% | Global, early gains in Europe and North America | Medium term (2-4 years) |
| Reshoring Incentives for Medical-Device Clean-Room Lines | +0.70% | United States, Germany, Japan | Long term (≥ 4 years) |
| Source: Mordor Intelligence | |||
Accelerating Adoption of Industry 4.0 Automation
Industrial executives see measurable gains from digitalized production. Plant upgrades that replace pneumatic cylinders with electromechanical actuators provide sub-micrometer feedback, enable over-the-air updates, and cut commissioning time by up to 40%. Edge-ready motion controllers now host Linux-based app ecosystems that push firmware and digital-twin data directly to the shop floor. These capabilities shorten changeover intervals when product batches fragment and allow predictive maintenance schedules to be generated automatically from live sensor data. As a result, the linear motion system market is increasingly tied to Industry 4.0 investment cycles rather than traditional capital-equipment budgets.
Expanding E-Commerce Boosting Automated Warehousing
Fulfilment operators are deploying vertical lift modules, shuttle systems, and mobile robots to meet next-day delivery promises. Each subsystem relies on high-cycle linear stages that position totes within milliseconds. Space utilization benefits are compelling because a single automated storage tower can replace 10,000 ft² of static racks, while energy-efficient direct-drive motors reduce total ownership cost by up to 20% over a decade. As third-party logistics providers extend networks into secondary cities, small-footprint, maintenance-free actuators become a core specification for new cross-dock hubs.
Rising Semiconductor and Electronics Precision Needs
Sub-3 nm lithography nodes demand wafer stages capable of maintaining overlay errors below a single nanometer while accelerating at multiple g-forces. Linear motors with active thermal management sustain peak forces above 10,000 N without derating, removing throughput bottlenecks in extreme-ultraviolet scanners. Asia-Pacific fabs under construction for advanced chips are ordering hundreds of such stages per site, locking in long-term demand for ultra-precision linear motion.
Demand Surge for Miniature Maintenance-Free LMS in Diagnostic Devices
Automated blood analysers and surgical robots require actuators no wider than 50 mm that operate particle-free in ISO 14644 cleanrooms. Plug-and-play modules that integrate motor, drive, and safety switches simplify FDA design-control documentation and accelerate time-to-market for new instruments. Pharmaceutical companies investing in continuous-manufacturing lines also prefer sealed, lubrication-free linear motors that eliminate contamination risk and support electronic batch records.
Restraints Impact Analysis*
| Restraint | (~) % Impact on CAGR Forecast | Geographic Relevance | Impact Timeline |
|---|---|---|---|
| High Upfront Cost and ROI Cycle of Customised Systems | -0.90% | Global, pronounced in cost-sensitive segments | Short term (≤ 2 years) |
| Scarcity of Skilled LMS Technicians | -0.60% | North America and Europe acute, emerging in APAC | Medium term (2-4 years) |
| Rare-Earth Magnet Price Volatility | -1.10% | Global, supply concentrated in China | Long term (≥ 4 years) |
| IEC-62443 Cybersecurity Compliance Cost for Smart LMS | -0.40% | North America and Europe, spreading to APAC | Medium term (2-4 years) |
| Source: Mordor Intelligence | |||
Rare-Earth Magnet Price Volatility
Permanent-magnet linear motors depend on neodymium-iron-boron alloys, yet China supplies more than 90% of refined material. Prices for neodymium-praseodymium oxide climbed 243% between 2020 and 2025, and new non-Chinese projects face higher capital intensity and stricter environmental permits. Motor makers evaluating ferrite or reluctance alternatives must accept a 30% loss of force density, limiting those options to low-torque applications and constraining near-term diversification efforts.
High Upfront Cost and ROI Cycle of Customized Systems
Roughly a quarter of new installations require bespoke stroke lengths, seals, or mounting flanges, pushing unit prices 40%-60% above catalogue norms. Direct-drive stages can repay themselves in as little as three years for high-duty cycles, yet small and medium factories with tight capex budgets often defer upgrades, preferring incremental pneumatic fixes. Leasing and as-a-service models are emerging, but adoption outside logistics remains limited.
*Our forecasts treat driver/restraint impacts as directional, not additive. The impact forecasts reflect baseline growth, mix effects, and variable interactions.
Segment Analysis
By Type: Direct-Drive Topologies Gain Traction
Linear motor direct-drive platforms are expected to post a 6.78% CAGR, the highest among type categories, because they slash preventive-maintenance downtime and reduce energy use by up to 30%. Multi-axis assemblies still anchor more than half of 2025 revenue, driven by machine-tool gantries and semiconductor handlers that need coordinated motion. Single-axis systems satisfy simple pick-and-place duties where cost and speed outweigh sub-micron accuracy.[1]PBC Linear, “Flexible Manufacturing System Case Study,” pbclinear.com
Belt-driven stages remain the preferred solution for strokes exceeding 10 m at moderate loads, while ball-screw actuators balance thrust and pricing for general industrial automation. The linear motion system market maintains diverse topology demand because users match architecture to cycle rate, accuracy, and environmental constraints. Manufacturers increasingly evaluate safety certification, total cost, and digital-twin readiness alongside mechanical performance when selecting a topology.


By Component: Controllers Embed Edge Intelligence
Controllers are projected to outpace other components at a 6.96% CAGR because edge modules now handle vibration suppression, adaptive feed-rate control, and condition monitoring that once required separate hardware. The linear motion system market size for linear guides was nearly half of 2025 revenue thanks to their ubiquity in machine tools and packaging cells.
Linear bearings, actuators, and motors are transitioning toward brushless permanent-magnet designs that prolong life and improve thermal stability. Ball screws and lead screws still offer 5:1 to 50:1 mechanical advantage but cede precision niches to direct-drive motors. Cable chains, limit sensors, and lubrication cartridges round out system bills of material, and quick-connect interfaces shorten installation time.
By End-User Industry: Healthcare Leads Growth Trajectory
Healthcare devices are forecast to expand at a 6.55% CAGR through 2031 as hospitals automate diagnostics, surgical suites, and pharmacies. Cleanroom-rated miniature actuators underpin these gains by eliminating particulate shedding and easing regulatory validation.
Electronics and semiconductor fabs remain the largest demand pool at 34.59% of 2025 consumption, followed by automotive lines that pivot to battery and module assembly. Metals, machinery, aerospace, and food processing each apply linear motion for specialized tasks from metal forming to washdown packaging.
By Application: Robotics and Cobots Surge Ahead
Robotics and cobots are projected to lead application growth at 7.01% CAGR because collaborative workcells require force-limited linear stages that coexist safely with operators. Material handling already commands 32.33% of 2025 installations, reflecting widespread use in warehouses and palletizers.
Machine-tool spindles, labelling heads, pick-and-place gantries, and precision inspection rigs each rely on customized linear axes. The linear motion system market size for inspection platforms is expanding as zero-defect mandates push manufacturers to integrate automated metrology at every production stage.
Geography Analysis
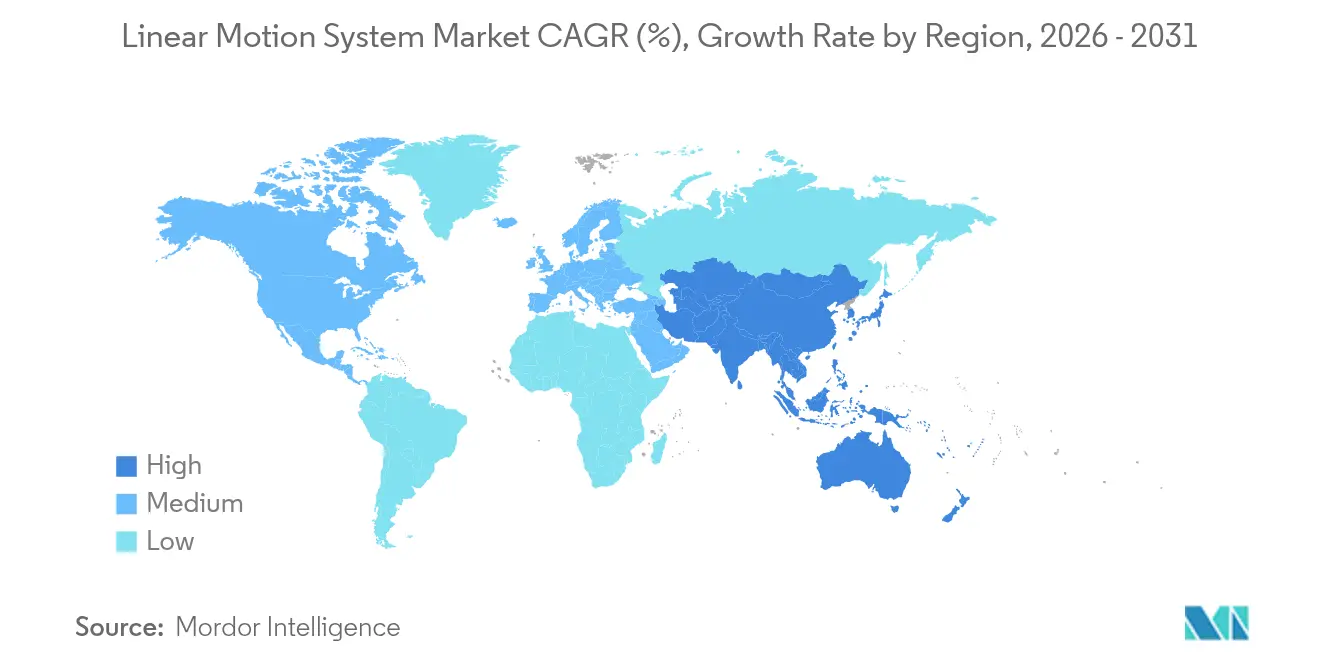
Asia-Pacific represented 46.84% of global shipments in 2025, anchored by China’s rare-earth supply chain and Japan’s component expertise. Subsidies under India’s production-linked incentive scheme and South Korea’s USD 230 billion semiconductor roadmap will bolster regional orders for ultra-precision stages. North America contributed roughly 22% of 2025 revenue, benefitting from electric-vehicle assembly lines and medical-device reshoring supported by recent U.S. policy incentives. Mexico’s nearshoring inflows are translating directly into actuator demand for automotive and electronics plants serving United States customers.[2]United States Department of Energy, “Critical Materials Assessment,” energy.gov
Europe accounted for about 20% of 2025 installations, with Germany’s Industry 4.0 program sustaining machine-tool exports despite energy-price pressures. France’s re-industrialization initiative is upgrading packaging and pharmaceutical plants with next-generation linear motors and edge controllers. The Middle East, led by Saudi Arabia and the United Arab Emirates, is emerging as a boutique automation hub as government grants offset initial capex for greenfield factories.
South America is projected to grow fastest at 6.84% CAGR through 2031 as Brazilian automotive and Argentine food processors automate to curb labour inflation. Africa remains nascent, though South African auto assembly and Egyptian food-processing lines signal early motion-control adoption. Across regions, the linear motion system market encounters varying tariff, skills, and power-cost barriers that shape technology uptake.

Regulatory Landscape
Regulation and standards compliance for linear motion systems increasingly centers on machine safety, software-enabled functions, and environmental requirements tied to electromechanical drives and connected controllers. In the European Union, Regulation (EU) 2023/1230 (Machinery Regulation) replaces the Machinery Directive 2006/42/EC and includes explicit provisions relevant to software safety functions and machine learning in machinery. The consolidated text dated 29 May 2026 reinforces a harmonized framework that affects suppliers of smart linear axes, drives, and controllers placed on the EU market.
Across major markets, suppliers align designs and documentation to functional safety and control-system requirements such as IEC 61800-5-2 for adjustable speed electrical power drive systems safety functions, EN ISO 13849-1 for safety-related parts of control systems, and IEC 61508 for functional safety of electrical/electronic systems. Market access for electronic and electromechanical motion components also requires environmental and chemical compliance, notably EU RoHS 3 (2015/863), REACH, and WEEE obligations for applicable electrical/electronic equipment, which shapes materials selection, product labeling, and end-of-life handling practices across global supply chains.
Competitive Landscape
The five largest suppliers Bosch Rexroth, THK, Hiwin, NSK, and Parker Hannifin collectively held about 40% of 2025 revenue, yielding a moderately concentrated field. Each company operates vertically integrated plants that machine guides, screws, actuators, and controllers in-house to guarantee interchangeability.[3]THK Co. Ltd, “LM Guide Actuator IoT Upgrade,” thk.com
Regional specialists such as Akribis Systems and Aerotech focus on semiconductor metrology and aerospace inspection, where micron-level tolerances justify premium pricing. Strategic differentiation now centers on digital-twin bundles, IoT-enabled health monitoring, and modular kits that slice up to 40% from commissioning time. Patent activity in thrust-ripple suppression and magnetic-flux shaping has intensified since 2024, signalling a race to improve dynamic rather than static metrics.
White-space growth areas include collaborative-robot actuators with integrated torque sensing and sealed, lubrication-free units for FDA-regulated cleanrooms. Software-defined motion startups are unbundling hardware and control logic, allowing end users to mix vendor components while maintaining synchronized trajectories, thereby challenging traditional closed ecosystems.
Linear Motion System Industry Leaders
Bosch Rexroth AG (Robert Bosch GmbH)
Schneeberger Group
Ewellix AB (Schaeffler Group)
Hiwin Corporation
Thomson Industries Inc. (Regal Rexnord Corporation)
- *Disclaimer: Major Players sorted in no particular order

Market Opportunities and Future Outlook
White-space opportunity is widening where end users are replacing pneumatic and hydraulic cylinders with electromechanical actuators to improve repeatability, diagnostics, and integration into digital production systems, which aligns with the report's shift toward direct-drive and edge-intelligent control. Schaeffler (Ewellix) introduced additional EMA-series electromechanical actuator variants for industrial and medical applications, while Yaskawa highlighted AI-integrated i3-Mechatronics within its Vision 2035 plan, reinforcing demand for controllers and motion platforms that expose data for predictive maintenance and software-defined tuning.
Supply availability and localization also point to an opportunity for linear guides, bearings, and actuator subassemblies as OEMs work through long lead times and trade-policy exposure. Customer preference for regional supply resilience and faster delivery is reflected in capacity actions cited in 2026, including igus expanding automation and local production infrastructure and Thomson Industries ramping capacity at its Radford, Virginia facility. At the application level, high-cycle automated warehousing and robotics cells are specifying faster linear axes and more sensorized components for vibration, temperature, and lubrication monitoring, supporting premiumization of integrated, condition-aware linear motion modules.
Recent Industry Developments
- April 2026: Schaeffler (Ewellix) debuted EMA-50 and EMA-60 electromechanical linear actuators at Hannover Messe 2026, targeting replacement of hydraulic and pneumatic cylinders in industrial and mobile machinery. The launch reflects the competitive push toward electrified, maintenance-reduced actuation and expands options for OEMs standardizing on electromechanical architectures across multiple machine platforms.
- October 2025: Schneeberger introduced new PULSE PRO cage technology for linear guides, focusing on performance improvements for demanding machine tool and precision automation environments. The update supports higher-duty applications where reliability and the dynamic behavior of guidance elements affect uptime and total cost of ownership.
- November 2024: Parker Hannifin acquired Precision Motion Industries for USD 280 million, expanding its position in precision motion components used in medical and miniature actuator applications. The deal broadened Parker's product and engineering footprint in regulated and high-precision end markets that increasingly specify compact, cleanroom-ready linear motion solutions.


Research Methodology Framework and Report Scope
Market Definition and Coverage
The linear motion system market, for this sizing, covers products and sub-assemblies that create controlled straight-line movement in industrial and commercial equipment, along with the core supporting parts that enable positioning, guidance, and drive.
Scope exclusions: We exclude purely manual linear slides without powered or controlled motion, and we also exclude broad factory automation services that are not sold as linear motion hardware.
Segmentation Overview
- By Type
- Single-Axis Linear Motion System
- Multi-Axis Linear Motion System
- Belt-Driven Linear Motion System
- Ball Screw Linear Motion System
- Linear Motor Direct-Drive System
- By Component
- Actuators and Motors
- Linear Guides
- Linear Bearings
- Controllers
- Ball Screws and Lead Screws
- Other Components
- By End-User Industry
- Automotive
- Electronics and Semiconductor
- Manufacturing, Metals and Machinery
- Aerospace and Defense
- Healthcare and Medical Devices
- Food and Beverage
- Logistics and Warehousing
- Other End-User Industries
- By Application
- Material Handling
- Machine Tools
- Robotics and Cobots
- Packaging and Labelling
- Pick-and-Place
- Inspection and Metrology
- Other Applications
- By Geography
- North America
- United States
- Canada
- Mexico
- South America
- Brazil
- Argentina
- Rest of South America
- Europe
- Germany
- France
- United Kingdom
- Italy
- Spain
- Rest of Europe
- Asia-Pacific
- China
- Japan
- India
- South Korea
- Australia
- Rest of Asia-Pacific
- Middle East
- Saudi Arabia
- United Arab Emirates
- Turkey
- Rest of Middle East
- Africa
- South Africa
- Egypt
- Nigeria
- Rest of Africa
- North America
Data Sources, Market Sizing, and Validation
Desk Research
Desk research was used to set the market boundaries, build the demand map, and collect reference indicators that can be checked each year. We leaned on public sources such as U.S. Census Bureau manufacturing data, Eurostat industrial production series, UN Comtrade trade statistics for relevant mechanical components, and ISO and IEC publications that clarify how motion components are specified and tested. We also reviewed patents through a paid patent database subscription to understand where designs are moving (for example, direct-drive adoption and controller integration), which helps shape the input variables.
Alongside official statistics, we used company annual reports, investor presentations, and reputable trade press coverage to track product mix shifts and end-use exposure by region. Import and export signals were also supported using a paid shipment-level trade database subscription when public trade codes were too broad, which helps reduce over-counting of adjacent parts. The desk sources named here are illustrative and not exhaustive, and many other public documents were used for data collection, cross-checking, and clarification.
Primary Interviews and Surveys
Primary discussions were run with component manufacturers, automation equipment integrators, distributors, and procurement and engineering users across key end-use industries such as machine tools, robotics and cobots, material handling, and electronics production. Inputs were collected across APAC, EMEA, and the Americas so regional pricing and adoption patterns could be tested, and then we confirmed assumptions like mix of belt-driven versus screw-driven solutions and typical replacement cycles. When gaps appeared in desk data, respondents helped us choose conservative ranges and align the final totals to realistic installation and upgrade activity.
Distribution of primary research fieldwork respondents
| Company type | Respondent position | Region |
|---|---|---|
| Top tier: 28% | CXOs: 16% | APAC: 51% |
| Mid tier: 56% | Functional/Unit leaders: 26% | EMEA: 29% |
| Smaller Players: 16% | Managers: 58% | Americas: 20% |
Market-Sizing & Forecasting
The market model starts from a top-down view where industrial output, machine tool and automation investment, and trade flows are used to reconstruct the likely demand pool for linear motion systems by region and major end uses. Once that structure is in place, we validate totals using selective bottom-up approximations, such as sampled average selling prices multiplied by shipment proxies, distributor channel checks, and supplier revenue exposure checks for key component groups. The model is adjusted only when the checks consistently point in one direction.
A few inputs that matter in this market include factory automation and robot installation trends, machine tool production cycles, semiconductor and electronics capex patterns, the share shift toward direct-drive linear motors in high-speed use cases, and typical replacement timing for bearings, guides, and screws in high-duty environments. For forecasting, scenario analysis is used so the model can reflect different investment cycles in manufacturing, and then assumptions are refined using what interviewees expect for lead times, pricing behavior, and end-market demand. Where bottom-up evidence is incomplete for smaller applications, the gaps are handled through ratio-based allocations anchored to observed end-use activity, then rechecked against trade and production signals.
Data Validation & Update Cycle
Validation is done through several passes so that obvious overstatements do not slip in. We compare outputs against independent indicators like industrial production movement, trade direction changes, and noted capacity expansions, and then outliers are reviewed until a reasonable explanation is found. If a key assumption shifts, such as a sharp change in automation spending or a price reset in a major component group, we re-contact respondents to confirm whether it is temporary or structural.
Before sign-off, the model and assumptions are reviewed by another analyst, and any large regional variance is challenged with a trace back to the input drivers. The report is refreshed annually, and interim updates are made when material events change demand, supply, or pricing. Right before delivery, a final review pass is completed so clients receive the most current view available.
Mordor Intelligence's Linear Motion System Market Size Compared Against Other Published Estimates
Published market sizes for linear motion systems do not always match, even when the topic name looks the same, because the scope lines are drawn differently and the math inputs are not identical. The biggest differences usually come from what is counted as a system versus a component, what years are treated as the starting point, and how prices are handled when product mix changes.
Trade movement in relevant mechanical parts, industrial output cycles, and end-use capex signals are the evidence points used to keep Mordor Intelligence's 2026 value aligned to a defined hardware demand pool, and then the forecast follows the same scope as adoption expands in automation-heavy end uses. Many other estimates widen the boundary by blending adjacent motion control electronics or by counting broader automation platforms, which can raise the number. In addition, differences can come from using aggressive pricing progression, using a different currency conversion timing, or not validating the split between belt-driven, screw-driven, and direct-drive solutions with real buyer and supplier feedback.
Benchmark comparison
| Source | Market Size | Gaps in Research Methodology |
|---|---|---|
| Mordor Intelligence | USD 13.61 B (2026) | |
| Industry Publisher A | USD 13.62 B (2026) | Uses a different base-year framing and a shorter component list by type in the public summary, which can shift the counted value between system-level bundles and standalone components. |
| Global Consultancy B | USD 12.63 B (2025) | Reports a neighboring year and appears to apply a broader linear motion definition in places, and the year shift alone changes the total when pricing and automation investment are moving year to year. |
Taken together, the spread is explained more by boundary and timing choices than by a disagreement that the market is growing. Our approach stays traceable because each regional total is tied back to observable demand signals, and then cross-checks are used to avoid mixing adjacent motion categories into the same number.


Key Questions Answered in the Report
How large will the global linear motion system size be by 2031?
It is forecast to reach USD 18.28 billion by 2031.
What compound annual growth rate is expected for linear motion systems between 2026 and 2031?
A 6.08% CAGR is projected for the 2026-2031 period.
Which platform type is expanding at the quickest pace?
Direct-drive linear motor systems are set to grow the fastest, advancing at a 6.78% CAGR.
Why are healthcare applications adopting linear motion technology so rapidly?
Hospitals and laboratories need miniature, maintenance-free actuators for diagnostics and surgical robotics, fueling a 6.55% CAGR in healthcare demand.
Which geographic region is projected to post the highest growth through 2031?
South America is expected to advance at a 6.84% CAGR, led by Brazilian and Argentine automation investments.
How concentrated is supplier competition in linear motion systems?
The top five vendors control about 40% of global revenue, indicating moderate concentration with room for regional specialists.
Page last updated on:






