
Lignin Products Market Size and Share
Market Overview
| Study Period | 2020 - 2031 |
|---|---|
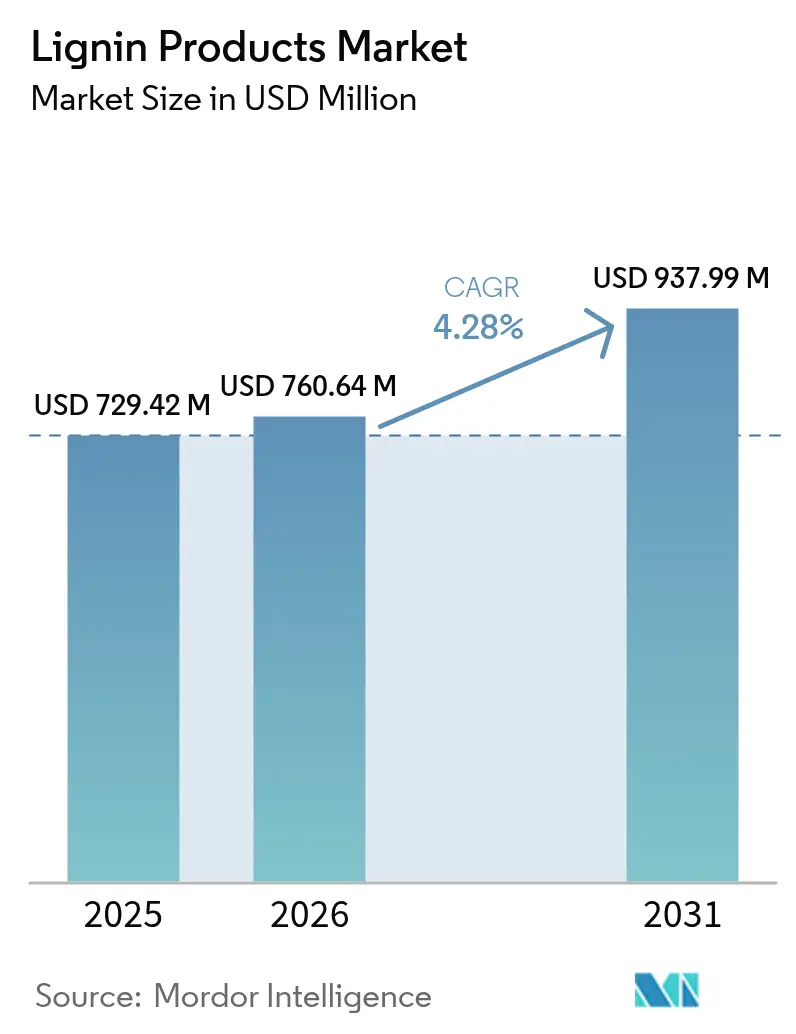
| Market Size (2026) | USD 760.64 Million |
| Market Size (2031) | USD 937.99 Million |
| Growth Rate (2026 - 2031) | 4.28 % |
| Fastest Growing Market | North America |
| Largest Market | Europe |
| Market Concentration | Medium |
Major Players *Disclaimer: Major Players sorted in no particular order Image © Mordor Intelligence. Reuse requires attribution under CC BY 4.0. | |
Lignin Products Market Analysis by Mordor Intelligence
The Lignin Products market size is expected to grow from USD 729.42 million in 2025 to USD 760.64 million in 2026 and is forecast to reach USD 937.99 million by 2031 at 4.28% CAGR over 2026-2031. Performance gains stem from rising demand for low-carbon construction chemicals, stricter sustainability regulations across mature economies, and continuing breakthroughs in bioconversion pathways that open high-value outlets for lignin‐based aromatics. The shift from waste-stream disposal toward value-added biorefinery integration reinforces pricing power, especially for high-purity grades supplied to the pharmaceutical and electronics value chains. Europe preserves first-mover advantage thanks to long-standing pulp-mill infrastructure, while North America records the fastest growth on the back of cellulosic ethanol mandates and automotive lightweighting programs. Competitive intensity remains moderate, with integrated pulp producers leveraging scale to protect margins against smaller specialty processors
Key Report Takeaways
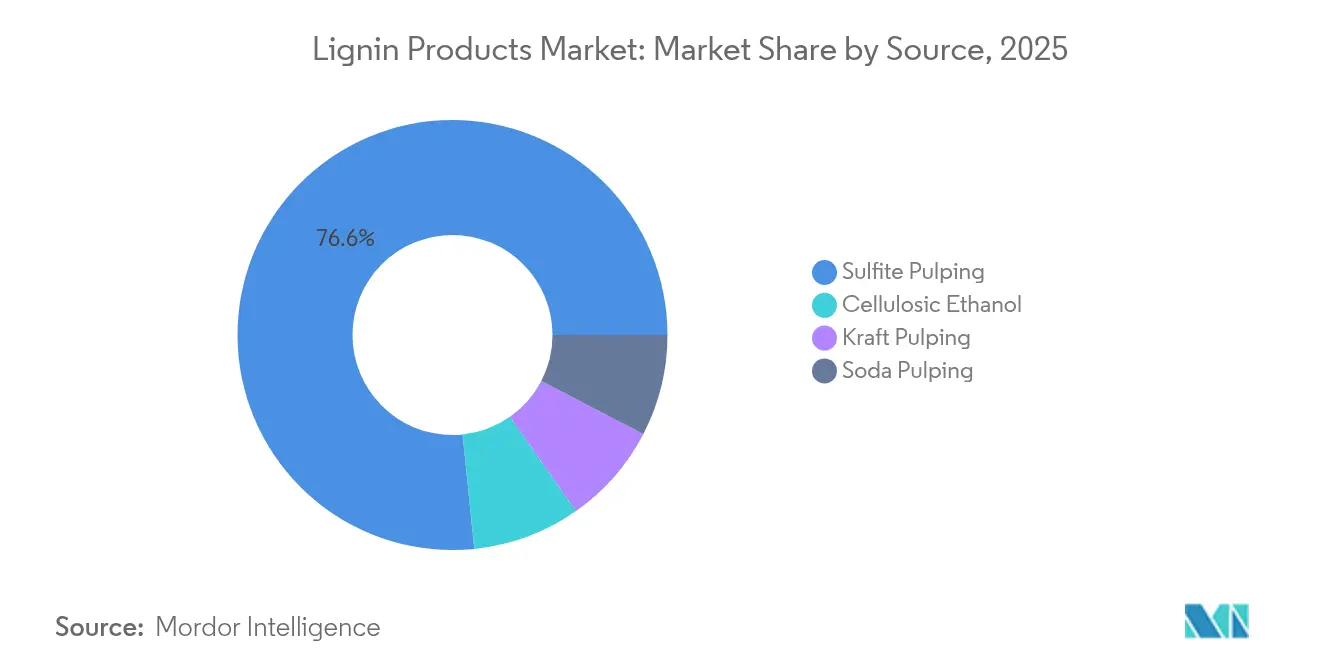
- By source, sulfite pulping led with 76.62% lignin products market share in 2025; cellulosic ethanol posted the highest projected 4.95% CAGR through 2031.
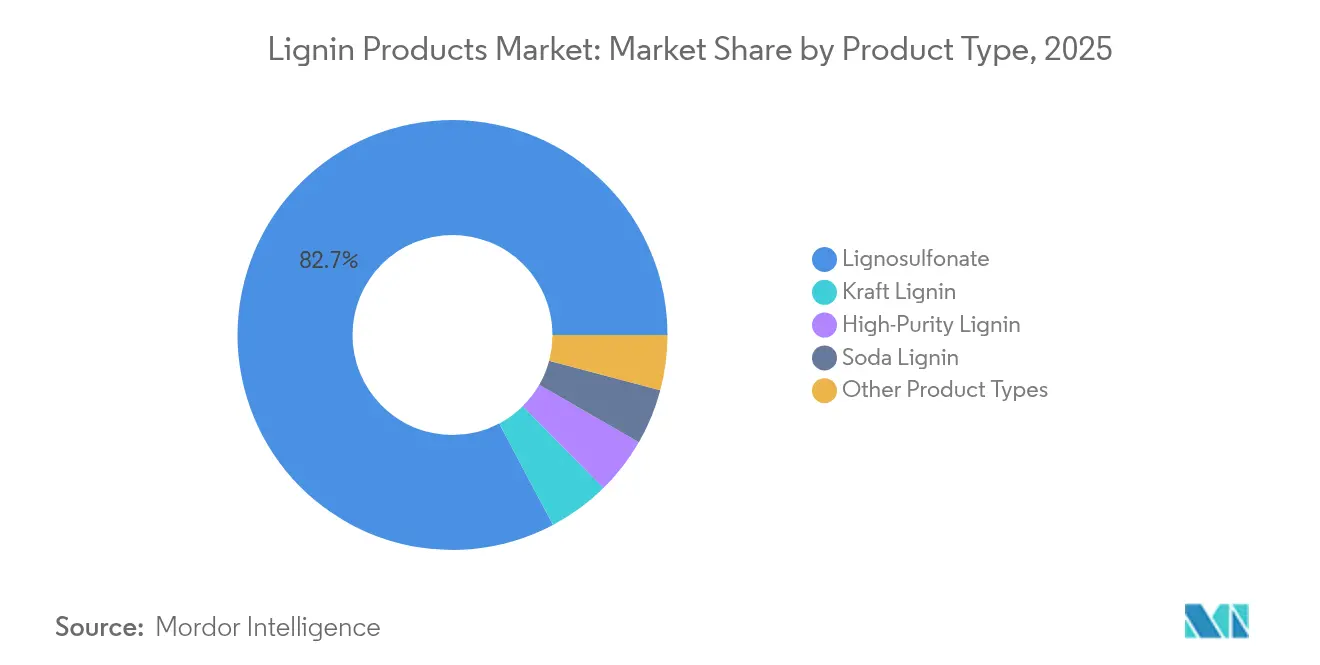
- By product type, lignosulfonate accounted for 82.74% of the lignin products market size in 2025, while kraft lignin is poised to expand at a 5.29% CAGR to 2031.
- By application, dispersants held 30.44% revenue share in 2025; concrete additives are forecast to grow at a 5.31% CAGR to 2031.
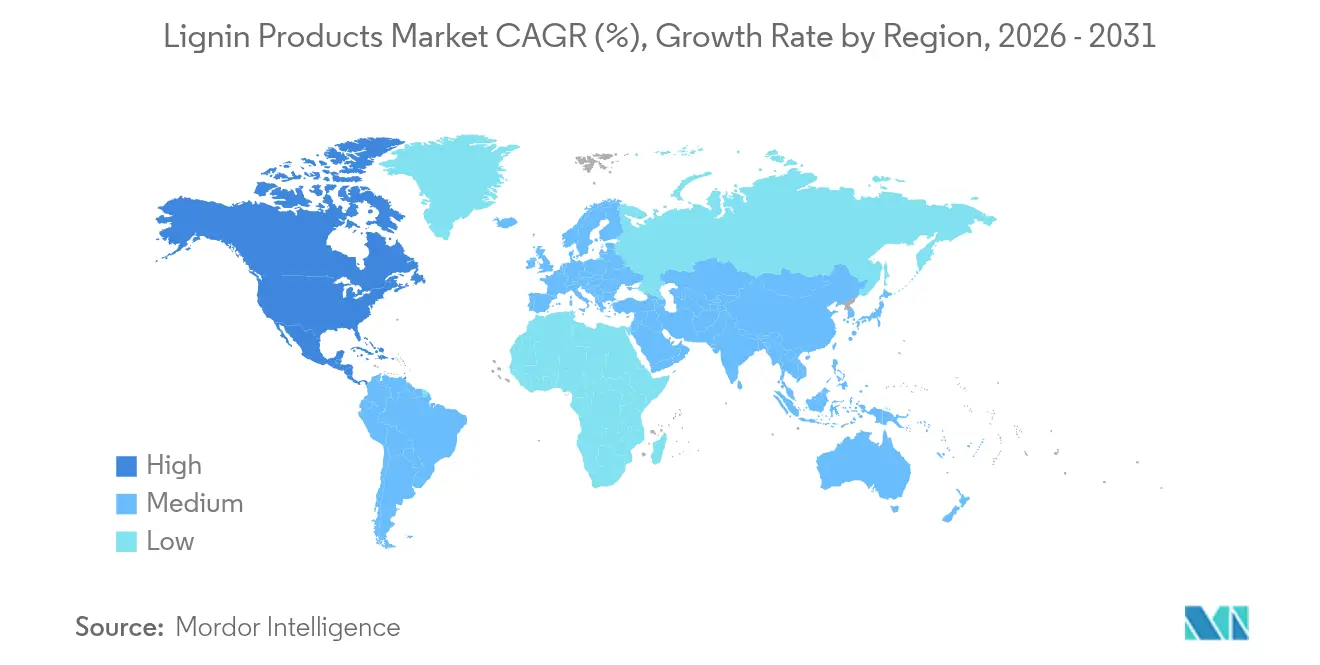
- By geography, Europe captured 33.55% share of the lignin products market in 2025, whereas North America is projected to register the highest 5.08% CAGR through 2031
Note: Market size and forecast figures in this report are generated using Mordor Intelligence’s proprietary estimation framework, updated with the latest available data and insights as of 2026.
Market Trends and Insights
Drivers Impact Analysis of Lignin Products Market*
| Driver | (~) % Impact on CAGR Forecast | Geographic Relevance | Impact Timeline |
|---|---|---|---|
| Rising Demand for High-Performance Concrete Admixtures | +1.8% | Global, with concentration in APAC and North America | Medium term (2-4 years) |
| Uptake of Lignin-Based Feed Binders in Animal Nutrition | +1.2% | Europe and North America core, expanding to APAC | Long term (≥ 4 years) |
| Valorisation of Pulp-Mill Side-Streams for Circular Revenue | +0.8% | Nordic countries, North America, Brazil | Short term (≤ 2 years) |
| Breakthrough Lignin-To-Vanillin Bioconversion Routes | +0.6% | Europe and North America, pilot projects in Asia | Long term (≥ 4 years) |
| Automotive Push for Lignin-Derived Bio-Carbon Fibre | +0.5% | Germany, Japan, United States automotive clusters | Long term (≥ 4 years) |
| Source: Mordor Intelligence | |||
Rising Demand for High-Performance Concrete Admixtures
Infrastructure expansion across Asia-Pacific and Latin America raises the need for superplasticizers that improve flow while lowering cement consumption. Lignin-based admixtures reduce water-cement ratios, boosting compressive strength by 15-20% and cutting cement use by 8-12%[1]. Construction firms pursuing LEED certification favor these bio-based solutions because they lower embodied carbon in high-rise and transportation projects. Green-building codes in China and India now endorse natural admixtures, providing a regulatory pull that accelerates commercialization. Producers scale up capacity to keep pace with large metro and highway contracts that specify performance concrete. Steady gains in smart-city investments anticipate durable demand for lignin superplasticizers through the medium term.
Uptake of Lignin-Based Feed Binders in Animal Nutrition
European regulations that restrict antibiotic growth promoters have moved feed formulators toward lignosulfonate binders. Studies show 25-30% better pellet durability versus molasses systems, translating into lower feed dust and reduced transport losses. Specific lignin fractions exhibit prebiotic activity that enhances ruminant gut microbiota, allowing feed companies to price at a premium. Danish and Dutch manufacturers report 12-15% logistics cost savings after sourcing local lignin derivatives from regional pulp mills. North American producers adopt similar strategies as large integrators target antibiotic-free supply chains. The long-term outlook remains strong as Asia-Pacific livestock operators shift toward higher-value protein and require efficiency gains in compound feed.
Valorisation of Pulp-Mill Side-Streams for Circular Revenue
Pulp producers, under pressure from tighter emission standards and fiber cost inflation, increasingly monetize lignin streams. Recovery systems yield 8-12% incremental revenue per ton of pulp, turning a legacy waste into a profit center. Equipment suppliers offer retrofits that achieve 85-90% recovery with minimal energy penalty, giving mills processing over 500,000 tons annual capacity three-to-four-year payback periods. Nordic operators lead adoption, but installations in Brazil and Canada quickly follow as carbon-pricing schemes raise disposal costs. Captive lignin output feeds on-site boilers, reducing fossil fuel demand and improving mill energy balance. Combined with renewable-power credits, the circular model supports financial resilience in the volatile pulp sector.
Breakthrough Lignin-to-Vanillin Bioconversion Routes
Enzymatic pathways now deliver 15-20% vanillin yields from kraft lignin, fivefold higher than legacy oxidation. The process eliminates aggressive chemicals and runs 60–80 °C cooler, slashing energy use and generating higher-purity output. Pilot plants in Finland, France, and the United States demonstrate 40-50% lower unit cost than petroleum routes. Rising global vanilla demand at an 8–10% clip strengthens the business case, and food companies keen on natural labels contract early offtake volumes. Regulatory bodies accept lignin-origin vanillin as “natural flavor,” widening the addressable market. Commercial-scale facilities are scheduled for start-up by 2027, signaling meaningful supply additions in the long term.
Restraints Impact Analysis of Lignin Products Market*
| Restraint | (~) % Impact on CAGR Forecast | Geographic Relevance | Impact Timeline |
|---|---|---|---|
| Quality Variability Across Extraction Processes | -0.7% | Global, particularly affecting emerging market producers | Short term (≤ 2 years) |
| Competition from Sugar-Derived Bio-Aromatics | -0.4% | North America and Europe, where sugar processing is established | Medium term (2-4 years) |
| Lack of International Lignin Product Standards | -0.3% | Global, with strongest impact on cross-border trade | Long term (≥ 4 years) |
| Source: Mordor Intelligence | |||
Quality Variability Across Extraction Processes
Differences in sulfur content and molecular weight between kraft, sulfite, and soda lignin complicate procurement for users that require consistent specifications. Sulfite variants carry 20-30% higher sulfur, impacting resin cure kinetics and demanding tailored processing protocols[2]. Downstream firms maintain parallel inventories and dual qualification programs, inflating supply-chain spending by 8-12%. Smaller mills rarely possess analytical labs to certify each batch, restricting market access to low-margin outlets. Near-term uncertainty remains until shared testing standards emerge and cloud-based traceability platforms mature. Quality harmonization is therefore pivotal for broader adoption in specialty segments.
Competition from Sugar-Derived Bio-Aromatics
Fermentation platforms converting glucose to vanillin, phenol, and other aromatics achieve 99.5% purity, outclassing lignin-based products that generally reach 95–97%. Pharmaceutical and premium flavor markets pay 15-20% extra for the higher consistency. Brazil and India leverage existing cane and corn sucrose streams, enabling continuous supply at industrial scale. As sugar prices stay subdued, the cost gap narrows, pressuring lignin players in high-value chemical niches. To defend share, lignin producers invest in purification innovations and co-product valorization. The medium-term outlook hinges on parity in purity and price.
*Our forecasts treat driver/restraint impacts as directional, not additive. The impact forecasts reflect baseline growth, mix effects, and variable interactions.
Lignin Products Market Segment Analysis
By Source:
Sulfite Pulping Dominates Despite Cellulosic GrowthThe lignin products market size linked to sulfite pulping totaled the bulk of global value, securing 76.62% in 2025 on the back of abundant volumes and well-known performance in dispersants. Cellulosic ethanol plants offer much smaller but higher-margin flows, and their 4.95% CAGR makes them the most dynamic source category to 2031. Production incentives under the U.S. Renewable Fuel Standard and EU RED-II encourage biorefineries to integrate lignin separation units, adding revenue equal to 12-15% of ethanol sales. Sulfite operators, chiefly in Europe and China, defend position by optimizing recovery yields and launching tailor-made grades for concrete and feed. Soda pulping keeps niche importance in India and Southeast Asia, processing agricultural residues into low-ash lignin for regional textile chemicals.
Cellulosic ethanol lignin typically displays lower ash and narrower molecular-weight distribution than kraft material, granting it a premium in specialty polymers. Pilot users in automotive composites value the predictable rheology that aids continuous fiber spinning. As ethanol producers scale capacity, supply of this high-quality lignin grows, tightening integration between biofuel and specialty chemical chains. Although sulfite volumes dwarf other sources, competitive dynamics hinge on value per ton rather than tonnage alone, especially as carbon revenue streams influence profitability.

By Product Type:
Kraft Lignin Gains Despite Lignosulfonate LeadershipLignosulfonate controlled 82.74% of 2025 value due to entrenched applications in concrete, feed, and dust suppression, benefiting from water solubility that eases blending. Kraft lignin expansion at a 5.29% CAGR derives from severe interest in carbon fibre precursors and bio-based resins. High-purity fractions, though costly to make, open doors in electronics and pharma intermediates where metal content must stay below strict thresholds. Soda lignin meets regional demand for dispersants in pulp and paper mills that process agri-residue, especially in China and Vietnam.
Growth strategies rest on purification technology. Stora Enso’s Sunila line adopts membrane and ion-exchange polishing, pushing kraft lignin to pharmaceutical grade. Ingevity and Valmet develop fractionation know-how to tailor molecular-weight cuts, delivering better compatibility in epoxy systems. Lignosulfonate producers focus on specialty concrete admixtures that satisfy ASTM C494 and European EN 934 standards. Competitive advantage shifts from bulk cost to property consistency, enabling differentiated pricing and lower sensitivity to commodity cycles.
By Application:
Concrete Additives Drive Growth Beyond Dispersant DominanceDispersants accounted for 30.44% share in 2025 thanks to lignosulfonate’s long history in dye, pesticide, and gypsum slurry formulations. Concrete additives, however, register the quickest 5.31% CAGR as governments fund megaprojects and green-building codes proliferate. Lignin superplasticizers reduce cement content by up to 20%, an attractive attribute when cement production faces carbon taxes. Animal feed demand gains from antibiotic restrictions, while resins benefit from consumer electronics assembly lines seeking formaldehyde-free adhesives.
Specification driven markets demand precise molecular-weight windows and low heavy-metal counts. Producers employ ultrafiltration to remove ash that can hinder concrete set time and feed palatability. For resins, lignin reacts with epoxides to replace bisphenol-A partially, offering safer profiles aligned with consumer product regulations. The diversification across multiple downstream uses insulates suppliers from cyclical swings in any single sector, supporting steady revenue streams through 2031.

Geography Analysis
Europe Lignin Products Market
Europe held 33.55% of global value in 2025 because integrated forest industries and strict climate policies foster early lignin valorization. Pulp mills in Finland and Sweden retrofit extraction lines to capture new revenue, while German concrete and automotive sectors absorb steady volumes. REACH chemicals regulation nudges formulators toward bio-derived inputs, improving demand visibility. Horizon Europe research grants accelerate pilot deployments in vanillin and carbon-fibre, solidifying the region’s innovation leadership.
North America Lignin Products Market
North America posts the fastest 5.08% CAGR through 2031 as federal cellulosic fuel mandates widen lignin supply and automotive lightweighting efforts raise the bar on sustainable composites. The lignin products market size for concrete admixtures climbs in the United States on the back of the Bipartisan Infrastructure Law, which modernizes bridges and transit. Canadian forestry companies leverage abundant boreal resources to diversify beyond pulp into specialty lignin, supported by provincial carbon-pricing mechanisms that favor low-emission materials. Mexico’s construction boom also creates room for admixture imports, rounding out continental demand.
APAC Lignin Products Market
Asia-Pacific stands at an earlier adoption curve yet offers vast upside. China’s rapid urbanization elevates concrete consumption, and state standards begin to recognize lignin superplasticizers. India scales soda pulping for agri-residue, producing cost-competitive lignin for local feed and dye dispersants. Japan exploits lignin’s aromatic backbone in electronics resins, while South Korea includes lignin-based chemicals in green-procurement lists. Ongoing ASEAN infrastructure initiatives and growing meat production foster multipronged demand, though standards harmonization will be critical for cross-border trade.
Regulatory Landscape
In the United States, lignin regulatory obligations vary by substance identity under the Toxic Substances Control Act (TSCA). For example, organosolv lignin (CAS 8068-03-9) is subject to a Significant New Use Rule under 40 CFR 721.5460 when used with a number average molecular weight below 700 daltons, while "pulp, cellulose, reaction products with lignin" (CAS 167062-70-6) is covered by a SNUR under 40 CFR 721.11011, with reporting tied to specified particle size distributions. Generic lignin listings appear as ACTIVE on the TSCA Inventory, but suppliers still need to manage inventory flags and reporting exemptions that depend on the specific substance identity used in commerce.
In the European Union, compliance is shaped by REACH registration and Classification, Labelling and Packaging (CLP) rules, with Regulation (EU) 2024/2865 (23 October 2024) amending Regulation (EC) No 1272/2008 and driving updates to classification and labelling workflows on phased timelines starting in July 2026. Across regions, safety and handling requirements also influence commercial operations: dried kraft lignin can present combustible dust hazards, pushing producers and downstream users to implement dust control, storage, and process-safety measures alongside chemical regulatory compliance.
Value Chain Analysis
The lignin products value chain begins with biomass feedstock and pulping or biorefinery operations that generate lignin-containing streams (notably black liquor in chemical pulping). It then moves through extraction and refining (precipitation, filtration, fractionation, and polishing) into technical lignin, lignosulfonates, and higher-purity cuts. Technology providers and engineering partners have outsized influence because product performance hinges on molecular-weight distribution, sulfur content, ash, and metals control, which in turn affects suitability for end uses such as concrete additives and plasticizers, animal feed binders, dispersants, and resins. Distribution typically combines direct supply agreements for large formulators with specialty distributors for polymer and additive markets, where consistent specifications and application support are required.
Industrial-scale availability of consistent grades remains a key bottleneck, alongside limited harmonization of property standards across extraction routes and the economics of extraction and upgrading. Pulp mills also face an operational trade-off: extracting lignin from black liquor can reduce onsite electricity generation, making operating rules sensitive to power-price volatility and mill energy balance. Recent partnerships and pilots show the chain moving toward closer integration between mills, process licensors, and end users, such as Metsä Group starting a LigniOx lignin refining demonstration at its Äänekoski bioproduct mill with ANDRITZ and Dow focused on concrete plasticizers, and downstream commercialization collaborations in wood-panel adhesives and polymer distribution that aim to shorten qualification cycles and improve route-to-market.
Competitive Landscape
Market structure remains moderately fragmented because integrated pulp giants coexist with agile biotech startups. Borregaard, Stora Enso, and Suzano exploit scale and secure wood supply while investing heavily in fractionation technology that upgrades lignin for pharmaceutical and advanced-material targets. Mid-tier players like Ingevity and RYAM focus on kraft-lignin derivatives for carbon-fibre and epoxy resins, employing proprietary molecular-weight control to carve niches.
Technology collaboration defines strategy. Borregaard’s alliance with Archer Daniels Midland opens North American feed markets, combining biochemical skillsets with distribution muscle. Valmet supplies turnkey extraction systems, securing installed-base service revenue and cross-selling opportunities. Patent activity climbed 35% in 2024, reflecting intense R&D in enzymatic depolymerization, vanillin synthesis, and electrospinning of lignin fibres. Specialty processors differentiate through low-metal content, sulfur control, and tailored functionality that address high-margin sectors like electronics solder masks and pharmaceutical excipients.
Capital deployment patterns reveal a pivot from bulk capacity toward downstream integration. Stora Enso’s EUR 50 million Sunila expansion raises high-purity output by 40%, enabling entry into medical-grade polymers. RYAM’s Temiscaming upgrade adds 25,000 tons annual kraft lignin, designed for stringent composite applications. Fragmentation persists because small mills continue supplying commoditized lignosulfonate to tradable markets, yet rising quality expectations may spur consolidation as buyers gravitate to certified vendors.
Lignin Products Industry Leaders
-
Borregaard AS
-
Ingevity
-
Stora Enso
-
Sappi Ltd
-
RYAM
- *Disclaimer: Major Players sorted in no particular order

Lignin Products Market Companies Covered in this Report
- Borregaard AS
- Burgo Group S.p.A.
- Domsjö Fabriker AB
- Ingevity
- Lignin Industries AB
- MetGen
- Metsä Group
- NIPPON PAPER INDUSTRIES CO., LTD.
- RYAM
- Sappi Ltd
- Stora Enso
- Suzano S/A
- UPM Biochemicals
- Valmet
Market Opportunities and Future Outlook
Opportunity is widening where lignin shifts from a low-value side stream into qualified, application-specific intermediates for construction chemicals, resins, and polymer additives. Concrete-focused product development is supported by new pilot and demonstration capacity located near established Nordic and European pulp clusters, including Metsä Group starting up its Metsä LigO demo plant at Äänekoski (2 tons/day) and the commissioning of CENERs ZEBRA-LIFE pilot plant in Aoiz, Spain (20 kg/hour) converting lignin and black liquor into renewable antioxidants. These programs generate application data and supply samples that help formulators validate performance and compliance for higher-margin grades beyond commodity lignosulfonates.
A second whitespace is in scaling continuous processing and purification pathways that meet tighter specifications for resins and specialty chemicals, supported by named projects and facilities across Europe and the Americas. UPM reported stable operations in separating lignin and sugars at its Leuna biorefinery in Germany (with a stated target of 220,000 tonnes/year of biochemicals including lignin-based fillers at full capacity by 2027), Moonshot Flanders LignoValue pilot plant in Antwerp achieved a 72-hour continuous run processing 40 kg/h, and CMPC inaugurated Chiles first lignin production pilot plant in Coronel with the University of Concepcion and UDT. Taken together, these initiatives broaden the set of bankable use cases for lignin as a functional filler or partial replacement for fossil-derived inputs such as phenol, carbon black, and silica, while also underscoring the remaining unmet need for standardized specifications and reliable multi-source supply.
Recent Industry Developments in Lignin Products Market
- May 2026: Stora Enso published a circularity plan aligned with the Global Circularity Protocol, setting a target of 90% circular materials in its operations by 2030 from a 79% baseline in 2025. The plan tightens internal requirements around material selection and traceability, reinforcing demand pull for renewable raw materials and upgraded biobased intermediates such as higher-value lignin fractions used in specialty applications.
- January 2026: Ingevity completed the sale of its North Charleston crude tall oil refinery assets and the majority of its Performance Chemicals Industrial Specialties product line to Mainstream Pine Products for USD 110 million. The transaction sharpened Ingevitys portfolio focus toward higher-margin specialty areas while retaining lignin-related dispersant positions, affecting how the company prioritizes capital and commercialization resources tied to wood-derived chemistries.
- December 2024: Metsä Group developed Metsä LigO at its Äänekoski demo plant as a lignin product intended to replace fossil-based chemicals in concrete production. The development strengthened the pathway from pulp-mill side streams to construction chemicals, supporting qualification work with concrete admixture formulators that require repeatable performance and supply assurance.
Lignin Products Market Report Scope and Research Methodology
Market Definition and Coverage
For this study, the lignin products market covers commercial lignin and lignin-derived products sold as materials or additives across applications such as dispersants, concrete additives, resins, and related uses, measured in revenue terms.
Scope exclusions: We exclude in-house lignin streams that are not sold as products and any energy-only burning of lignin without downstream product value addition.
Segments Covered in This Report
- By Source
- Sulfite Pulping
- Cellulosic Ethanol
- Kraft Pulping
- Soda Pulping
- By Product Type
- Lignosulfonate
- Kraft Lignin
- High-Purity Lignin
- Soda Lignin
- Other Product Types
- By Application
- Dispersant
- Concrete Additive
- Animal Feed
- Resins
- Other Applications
- By Geography
- Asia-Pacific
- China
- India
- Japan
- South Korea
- ASEAN Countries
- Rest of Asia-Pacific
- North America
- United States
- Canada
- Mexico
- Europe
- Germany
- United Kingdom
- France
- Italy
- Russia
- NORDIC Countries
- Rest of Europe
- South America
- Brazil
- Argentina
- Rest of South America
- Middle East and Africa
- Saudi Arabia
- South Africa
- Rest of Middle East and Africa
- Asia-Pacific
Data Sources, Market Sizing, and Validation
Desk Research
Desk research starts by mapping lignin availability to realistic conversion into marketable products, because lignin is mainly generated as a by-product of pulping and some biorefinery routes. We reviewed public sources such as the USDA and the US Energy Information Administration for bioeconomy and fuel pathway context, the USGS for industrial materials context, and Eurostat for industrial production and trade indicators that help frame regional activity.
To anchor what is actually made and used, we also relied on sources such as UN Comtrade for import-export flows, patent databases for visibility on productization pathways, and peer-reviewed journals that discuss lignin chemistry and performance in concrete admixtures and dispersant roles. Company annual reports, investor decks, and credible industry press were used to identify capacity announcements, end-use focus, and pricing direction in broad terms. Paid subscriptions were used selectively for company financials and intelligence, news and financials, and patent databases to speed up screening and cross-check timelines. The sources listed above are illustrative only, and many other public and internal references were also used for collection, validation, and clarification.
Primary Interviews and Surveys
Primary work focused on interviews and short surveys with lignin product producers, distributors, downstream formulators, and large end users who buy lignin for concrete, dispersant, and binder type applications. Since this is a global market, inputs were balanced across APAC, EMEA, and the Americas, and the conversations were used to confirm usable product volumes, typical contract structures, and the direction of average pricing by grade.
Distribution of primary research fieldwork respondents
| Company type | Respondent position | Region |
|---|---|---|
| Top tier: 39% | CXOs: 13% | APAC: 44% |
| Mid tier: 43% | Functional/Unit leaders: 36% | EMEA: 32% |
| Smaller Players: 18% | Managers: 51% | Americas: 24% |
Market-Sizing & Forecasting
Sizing begins with a top-down build where lignin output by source route is translated into an addressable pool that can realistically be upgraded and sold, and then split by major end uses using adoption shares validated in interviews. To keep the numbers practical, we leaned on a small set of repeatable inputs, such as pulping and biorefinery activity by region, share of lignin recovered versus internally consumed, product mix between lignosulfonates and kraft lignin, the role of lignin in concrete admixtures and dispersant formulations, and typical price ranges by grade and purity.
After that, selective bottom-up approximations were used to test the totals, mainly through supplier capacity signals, channel checks on volumes moving into key applications, and sampled ASP times volume calculations for a few high visibility product groups. When bottom-up visibility was partial, gaps were handled by using conservative utilization assumptions and then rechecking them with primary respondents who see buying patterns across more than one application.
Forecasting is built using scenario analysis supported by short variable-level outlooks from industry experts, because changes in construction activity, pulp production, and substitution in dispersants do not move in a straight line each year. We also stress-tested the forecast against expected shifts in recovered lignin availability, pricing movement for higher purity grades, and the pace of qualification in emerging applications like carbon materials.
Data Validation & Update Cycle
Outputs are validated through multiple checks, where modeled revenues are compared with independent signals like regional pulping activity, trade movement for lignin-related product streams, and observed price direction shared by buyers and formulators. Outliers are flagged, the assumptions behind them are reviewed, and then a second analyst review is completed before sign-off so errors do not slip through.
The report is refreshed annually, and interim updates are triggered when a material event changes supply, demand, or pricing, such as a capacity change or a major end-use shift. Before delivery, we do a fresh pass on the key inputs and recalculate the model so clients receive the latest updated view.
Mordor Intelligence's Lignin Products Market Size Compared Against Other Published Estimates
Published market sizes for lignin products often differ, even when the topic name looks the same, because firms make different calls on what counts as a lignin product and which applications are counted today versus treated as emerging.
The table shows a spread that mainly comes from scope and pricing logic, plus the year used for currency conversion and how often assumptions are refreshed. Some estimates blend in broader lignin-based chemicals and longer-dated potential uses, while others keep the count closer to currently traded product grades and established application demand pools.
Benchmark comparison
| Source | Market Size | Gaps in Research Methodology |
|---|---|---|
| Mordor Intelligence | USD 760.64 M (2026) | |
| Industry Research Publisher A | USD 1300.00 M (2024) | Uses a broader product basket that leans into high value downstream derivatives and counts a larger share of lignin conversion into specialty uses, which lifts the total versus a model centered on commercialized volumes and realized pricing. |
| Industry Research Publisher B | USD 463.92 M (2025) | Applies a tighter inclusion set and more conservative ASP progression for lignin grades, and it can also undercount regions where trade and distribution are less visible in public sources. |
The table points to a scope and year effect, and in Mordor Intelligence's model the value is tied to traded lignin product grades and established application demand, then priced with interview-checked ranges and region-level activity checks. As a result, the estimate stays traceable to inputs like recovered lignin availability, product mix, and end-use uptake, which are easier to revisit and update when conditions change.
Key Questions Answered in the Report
What is the projected global value of lignin products by 2031?
The market is forecast to reach USD 937.99 million by 2031, rising at a 4.28% CAGR.
Which region currently holds the largest share of lignin product demand?
Europe leads with a 33.55% share thanks to established pulp‐mill infrastructure and stringent sustainability rules.
Which application is expanding the fastest in the next five years?
Concrete additives show the highest growth, advancing at a 5.31% CAGR as green-building codes encourage low-carbon superplasticizers.
How are cellulosic ethanol plants influencing lignin supply?
They recover high-purity lignin as a co-product, adding 12-15% extra revenue per ton of ethanol and growing at a 4.95% CAGR through 2031.