
Lighting As A Service (LaaS) Market Size and Share
Market Overview
| Study Period | 2021 - 2031 |
|---|---|
| Market Size (2026) | USD 1.01 Billion |
| Market Size (2031) | USD 4.01 Billion |
| Growth Rate (2026 - 2031) | 31.64 % |
| Fastest Growing Market | Asia Pacific |
| Largest Market | North America |
| Market Concentration | Medium |
Major Players *Disclaimer: Major Players sorted in no particular order Image © Mordor Intelligence. Reuse requires attribution under CC BY 4.0. | |

Lighting As A Service (LaaS) Market Analysis by Mordor Intelligence
Lighting As A Service market size in 2026 is estimated at USD 1.01 billion, growing from 2025 value of USD 0.77 billion with 2031 projections showing USD 4.01 billion, growing at 31.64% CAGR over 2026-2031.
This acceleration stems from a structural pivot away from capital-intensive fixture purchases toward subscription models that offload financing, technology, and maintenance risks onto specialized providers. Municipal smart-city budgets, stricter energy-efficiency regulations, and persistent corporate net-zero pledges are synchronizing to elevate service adoption. Hardware cost deflation and the rising ability to embed AI-driven controls inside luminaires are enlarging addressable opportunity pools, while bond-backed OPEX financing keeps projects off municipal balance sheets. Competitive intensity is shifting from luminaire manufacturing to analytics-enabled performance guarantees, transforming lighting grids into data-driven platforms.
Key Report Takeaways
- By installation type, indoor deployments held 69.92% of the Lighting as a Service market share in 2025, whereas outdoor projects are projected to expand at a 37.6% CAGR to 2031.
- By component, luminaires and controls captured a 59.10% revenue share in 2025; software and analytics are expected to grow at a 41.2% CAGR through 2031.
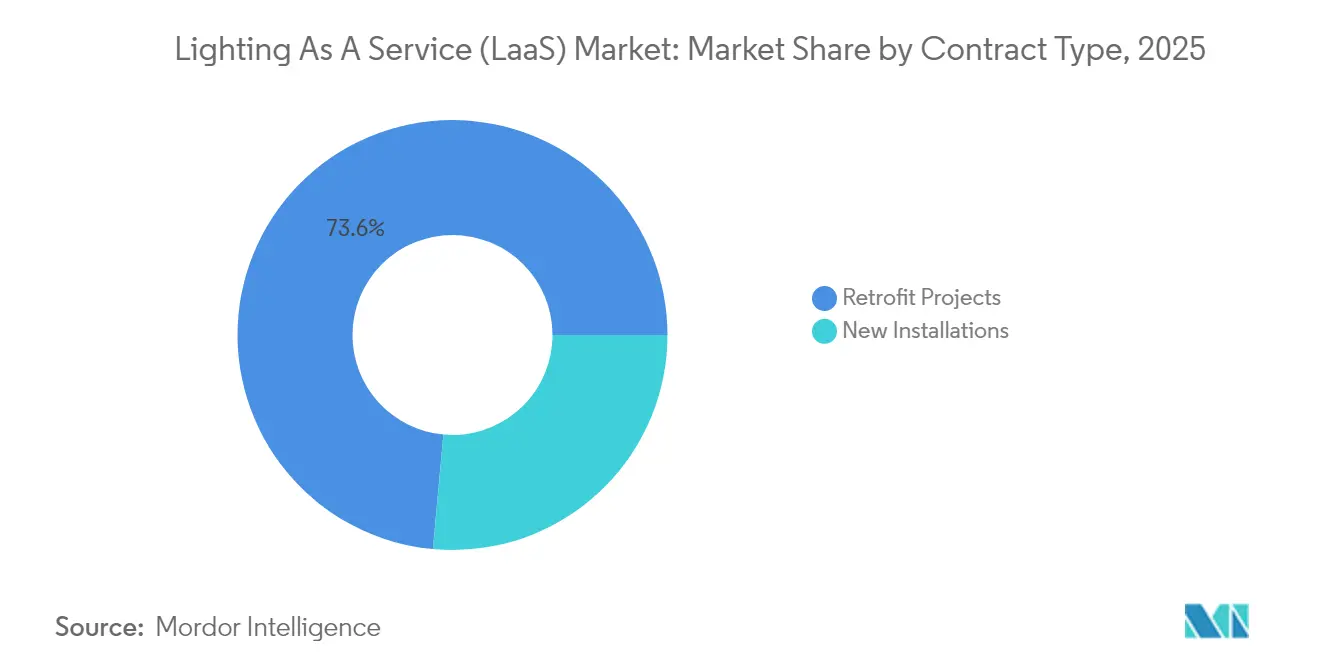
- By contract type, retrofit projects accounted for 73.55% of the Lighting as a Service market size in 2025, while new installations are projected to record the highest CAGR of 42.1% from 2025 to 2031.
- By end-user, commercial facilities led with 47.85% revenue share in 2025; municipal projects are advancing at a 38.2% CAGR through 2031.
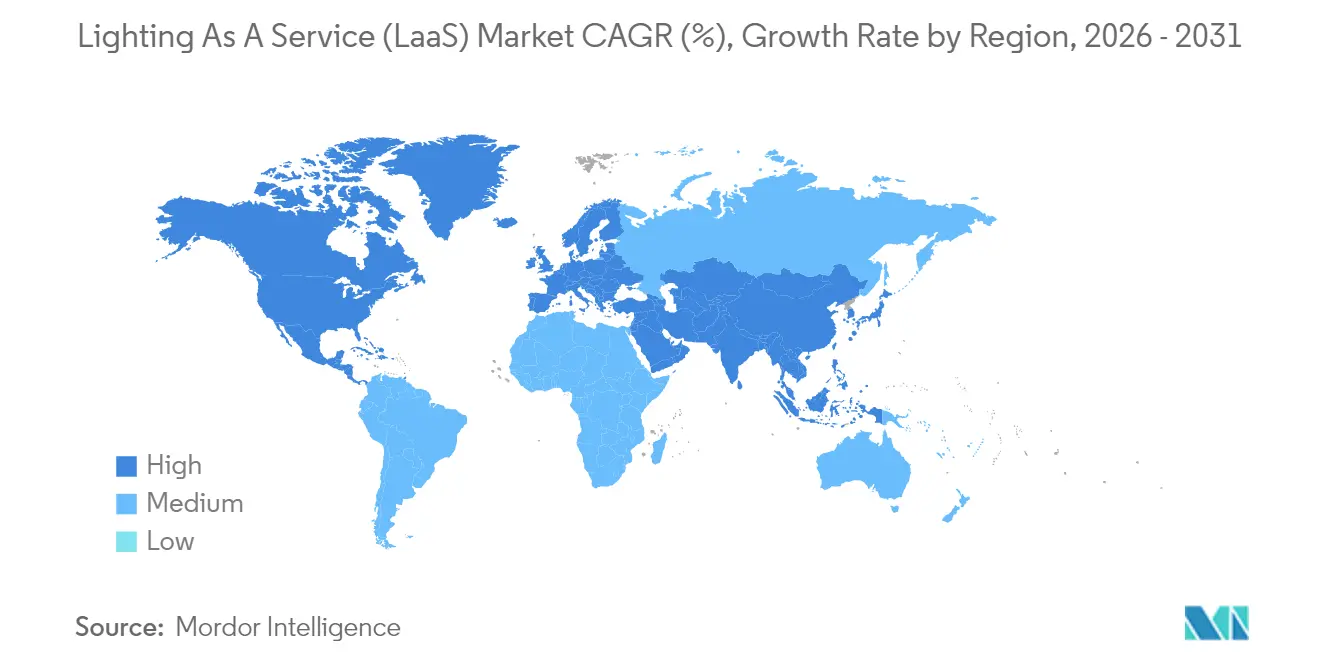
- By geography, North America commanded a 44.12% share in 2025, but the Asia-Pacific region is on track for the fastest growth, with a 43.9% CAGR to 2031.
Note: Market size and forecast figures in this report are generated using Mordor Intelligence’s proprietary estimation framework, updated with the latest available data and insights as of 2026.
Global Lighting As A Service (LaaS) Market Trends and Insights
Drivers Impact Analysis*
| Driver | (~) % Impact on CAGR Forecast | Geographic Relevance | Impact Timeline |
|---|---|---|---|
| Government energy-efficiency mandates | +8.20% | Global, with strongest impact in North America and EU | Medium term (2-4 years) |
| Declining LED & sensor costs | +6.80% | Global, with accelerated adoption in APAC and emerging markets | Short term (≤ 2 years) |
| Corporate net-zero & ESG targets | +5.40% | North America & EU core, expanding to APAC corporate sectors | Long term (≥ 4 years) |
| IoT-enabled smart-building retrofits | +4.90% | Global urban centers, concentrated in smart city initiatives | Medium term (2-4 years) |
| Green-bond financing for lighting OPEX models | +3.70% | North America and EU municipal markets, emerging in APAC | Long term (≥ 4 years) |
| AI-driven lighting-as-a-platform upsell potential | +2.80% | North America and EU commercial sectors, selective APAC adoption | Long term (≥ 4 years) |
| Source: Mordor Intelligence | |||
Government Energy-Efficiency Mandates
New rules, such as the U.S. Department of Energy’s 120 lumens-per-watt standard, effective July 2028, trigger widespread fixture obsolescence, positioning service contracts as a compliance shortcut that avoids heavy upfront cap-ex. Municipal utilities in California invested USD 223 million in 2022 efficiency programs, with lighting accounting for 34% of the gross annual savings, underscoring the urgency of purchasing. Because service providers assume replacement and regulatory risk, cities and corporates pivot toward outcome-based agreements that guarantee standards alignment while delivering measurable carbon-cutting baselines.(1)U.S. Department of Energy, “Final Rule: Energy Conservation Standards for General Service Lamps,” energy.gov
Declining LED & Sensor Costs
LED package prices have fallen sharply, enabling service providers to offer subscriptions at prices below those of incumbent utilities while maintaining their margins. With LED units already accounting for 70% of global shipments in 2024 and projected to reach 87% by 2030, a secondary replacement demand of 5.8 billion lamps emerges, boosting recurring revenue prospects. Connected luminaires reduce energy consumption by up to 80% when sensor-guided dimming is combined with native LED efficiency, enhancing the service value proposition.(2)Semiconductor Today, “LED Lamp Prices Continue to Fall,” semiconductortoday.com
Corporate Net-Zero & ESG Targets
Enterprises under Scope 2 disclosure pressure often prefer outsourcing their lighting assets to vendors that certify their energy and carbon performance. Signify reports that 65% of its 2025 sales are tied to climate-positive products, signaling a buyer preference for partners that couple hardware with verifiable sustainability metrics. Service contracts integrate lighting OPEX into ESG budgets and supply data for annual sustainability filings, accelerating board-level approvals for portfolio-wide retrofits.
IoT-Enabled Smart-Building Retrofits
Lighting grids are evolving into sensor backbones for occupancy analytics, indoor air quality alerts, and asset tracking. Studies indicate an average power reduction of 36.8 kW when autonomous controls optimize brightness against real-time occupancy. The added operational intelligence, unavailable through basic LED replacements, differentiates full-scope service offers and justifies multi-year managed contracts.(3)MDPI, “Smart Building Lighting Control for Energy Savings,” mdpi.com
Restraints Impact Analysis*
| Restraint | (~) % Impact on CAGR Forecast | Geographic Relevance | Impact Timeline |
|---|---|---|---|
| High total contract cost vs. cap-ex purchase | -4.60% | Global, with strongest impact in price-sensitive emerging markets | Short term (≤ 2 years) |
| Utility rebate uncertainty | -3.80% | North America and EU markets with established rebate programs | Medium term (2-4 years) |
| Cyber-security concerns in connected luminaires | -2.90% | Global enterprise and government sectors | Medium term (2-4 years) |
| Limited LaaS awareness in mid-sized enterprises | -2.10% | Global, concentrated in mid-market commercial segments | Short term (≤ 2 years) |
| Source: Mordor Intelligence | |||
High Total Contract Cost vs. Cap-Ex Purchase
Monthly fees can appear burdensome when compared with spot purchases, despite LEDs consuming 75% less power and lasting 25 times longer than incandescent fixtures. Organisations possessing strong cash reserves often decide to self-finance equipment to capture full savings, especially in economies prone to currency swings that inflate service premiums. Providers need to emphasize guaranteed uptime, refresh cycles, and performance warranties to offset sticker shock.
Utility Rebate Uncertainty
Rebate pools, such as Austin Energy’s USD 420-per-kW program, regularly reach funding ceilings, forcing providers to hedge their offers or risk margin erosion. In California, public utilities allocated USD 159 million to efficiency programs in 2021; however, lighting eligibility rules shifted for the next fiscal year, clouding ROI modeling. This volatility slows sales and lengthens contract negotiations, particularly for mid-scale retrofits dependent on incentive stacking.
*Our forecasts treat driver/restraint impacts as directional, not additive. The impact forecasts reflect baseline growth, mix effects, and variable interactions.
Segment Analysis
By Installation Type: Indoor Dominance Drives Service Standardization
Indoor projects accounted for 69.92% of the Lighting as a Service market in 2025, reflecting abundant demand in offices, logistics hubs, and manufacturing facilities where standardized ceiling grids reduce engineering variance and simplify service pricing. Providers bundle predictive maintenance and future technology upgrades into contracts, ensuring clients avoid stranded assets as control protocols evolve. Energy code tightening across North America and the EU intensifies the focus on indoor environments, while AI-driven occupancy analytics unlock new revenue opportunities per square foot. Outdoor implementations are scaling quickly at a 37.6% CAGR thanks to municipal smart-street programs; poles now support cameras, 5G small cells, and environmental sensors. Washington D.C.’s USD 309 million concession validates the economics by pairing 50% energy savings with revenue-sharing from data services, an example that is being mirrored in Miami-Dade’s USD 211.7 million multi-sensor rollout. These projects demonstrate how lighting poles evolve into digital urban infrastructure, signaling a deeper level of municipal engagement for Lighting as a Service market teams.
Outdoor’s expansion prompts vendors to refine ruggedized hardware, adaptive dimming algorithms, and financial structures, such as public-private partnerships, that align with 15-year debt amortization schedules. The segment’s growth also stimulates ancillary markets for security analytics, parking management, and air-quality monitoring. As more cities re-tender legacy fixtures, providers with turnkey design-build-finance-maintain packages gain commercial leverage. Indoor environments will remain volume leaders, but the higher per-node revenue and public-sector tenures of outdoor solutions will balance overall portfolio risk for top vendors within the Lighting as a Service market.


By Component: Software Analytics Emerge as Growth Engine
Hardware still accounts for 59.10% of 2025 revenue, yet software and analytics are racing ahead at a 41.2% CAGR through 2031, transforming data insights into the new competitive frontier for the Lighting as a Service industry. Energy dashboards, predictive failure alerts, and integration APIs embed lighting networks inside broader building-management stacks. The Lighting as a Service market size tied to analytics unlocks performance-based billing, allowing providers to monetize kilowatt-hour savings and productivity improvements rather than billing strictly per luminaire. AI-enabled optimisation now delivers up to 26% incremental energy cut on top of LED gains across multi-tenant offices.
Service modules covering asset financing, preventive maintenance, and luminaire recycling continue to underpin vendor cash flows. However, margin expansion also arises from proprietary algorithms that refine light-level tuning based on time-of-day, occupancy, and daylight harvesting inputs. Platforms that maintain open-protocol interoperability outpace closed ecosystems by facilitating seamless integration of third-party sensors and HVAC systems. The differentiation shift forces legacy manufacturers to invest in software talent or acquire SaaS-native firms to protect their installed bases. Customers benefit through lifecycle cost transparency and feature extensibility, reinforcing stickiness inside the Lighting as a Service market.
By Contract Type: Retrofit Projects Lead Market Maturity
Retrofit programmes captured 73.55% of the revenue in 2025 because they deliver immediate energy savings and regulatory compliance for facilities equipped with fluorescent or high-intensity discharge fixtures. Clear pre-retrofit baselines allow providers to model return profiles precisely, aligning payment schedules with verified savings in Lighting. The Lighting as a Service market size tied to retrofits is expected to peak as the first LED cohort, installed a decade ago, approaches end-of-life, between 2025 and 2028, driving a secondary replacement wave projected to represent 78% of LED demand.
New installations, expanding at the fastest rate of 42.1% CAGR, predicate their appeal on embedding service contracts from day one. Developers treat Lighting as a package within holistic smart-building concessions, bundling HVAC, security, and sensor grids for unified command and control platforms. This design-build-operate model shortens sales cycles because financing closes alongside property construction loans. It also accelerates software adoption because systems launch on modern IP networks rather than retrofit legacy wiring. Providers that can integrate BIM data and digitize lighting handoffs possess a crucial edge in the Lighting as a Service market.
By End User: Municipal Sector Accelerates Smart-City Integration
Commercial real estate led 2025 revenue with 47.85% share, bolstered by corporations aligning ESG roadmaps with operational cost cuts. Portfolio owners of logistics centres and retail chains leverage multi-site contracts to average payback over larger energy footprints. Yet municipal entities show the sharpest 38.2% CAGR through 2031 by tapping OPEX-friendly concession models. India’s programme, which replaced 29.5 million streetlamps, demonstrates how aggregated procurement unlocks supplier scale and delivers 48.42 billion kWh of yearly savings, making the Lighting as a Service market contract politically attractive.
Municipal customers also value data-rich poles that host traffic sensors, public Wi-Fi, and environmental monitoring, converting lighting grids into revenue-sharing civic assets. Industrial plants and residential complexes emerge as smaller but promising verticals; each requires tailored SLAs addressing harsh ambient conditions or strata-committee decision dynamics. Vendor segmentation strategies that tailor financial terms and service levels by vertical will dictate share gains throughout the Lighting as a Service market forecast period.
Geography Analysis
North America held a 44.12% share in 2025, driven by mature public-private partnership frameworks and rebate portfolios that reduce payback horizons. Washington D.C.’s USD 309 million street-lighting overhaul illustrates how city governments achieve 50% energy cuts while upgrading poles for surveillance and 5G backhaul. Federal efficiency rules mandating 120 lumens per watt by 2028 inject urgency into school, airport, and roadway retrofits. Utility incentives such as Austin Energy’s USD 420-per-kW credits further sweeten contract economics.
The Asia-Pacific region posts the fastest 43.9% CAGR, undergirded by high-density urbanization and state-engineered smart-city budgets. India’s Street Lighting National Program already retrofitted 29.5 million fixtures, translating into 39.30 million tonnes of annual CO₂ abatement. China’s multi-city digital-twin demonstrations and projects, such as the PHP 2.105 billion Bacolod Super City initiative, amplify the regional appetite for large-scale Lighting as a Service market convergence, Including Lighting, connectivity, and e-governance.
Europe’s market follows a stable replacement rhythm anchored to stringent climate legislation and aging sodium-vapor networks. Copenhagen switched 18,800 streetlights to LED, saving 55% of energy and eliminating 3,200 tons of CO₂ each year, while installing a remote-monitoring platform that future-proofs the poles for environmental sensors. Providers compete primarily on service-level adherence and cybersecurity credentials, as EU directives focus on data protection. Emerging regions in the Middle East, Africa, and South America display uneven but rising interest, where multilateral lenders and export-credit agencies bridge financing gaps, lighting the way for nascent Lighting as a Service market penetration.

Regulatory Landscape
In the United States, federal procurement and contracting frameworks support service-based lighting upgrades alongside efficiency standards. The BRIGHT Act (Public Law 117-202) directs the General Services Administration (GSA) to procure life-cycle cost-effective, energy-efficient lighting systems in federal buildings, reinforcing specification of qualified high-efficiency products and controls in public facilities. Energy Savings Performance Contracts (ESPCs) administered through DOE FEMP provide an established contracting path for agencies to implement lighting upgrades via ESCOs, with payments tied to guaranteed energy cost savings and contract terms that can extend up to 25 years.
In Europe, ecodesign and sustainability rules increasingly shape luminaire and control-gear requirements and documentation. Commission Regulation (EU) 2019/2020 sets mandatory ecodesign requirements for light sources and separate control gears, tightening energy performance thresholds across product categories relevant to LaaS retrofits. Regulation (EU) 2024/1781 (Ecodesign for Sustainable Products Regulation, ESPR), which entered into force in 2024, broadens compliance expectations toward durability, reparability, and product information (including digital product passport concepts), pushing LaaS providers to align offerings with circularity and traceability requirements across multi-year service obligations.
Competitive Landscape
The field displays moderate fragmentation but rapid consolidation among incumbents transitioning from manufacturing to outcome-centric service portfolios. Acuity Brands’ USD 1.215 billion QSC acquisition enhances its Intelligent Spaces Group by introducing audio-visual controls that expand the platform's scope beyond illumination. Siemens’ planned takeover of Altair Engineering, slated to absorb the Toggled LED brand, signals heightened integration of lighting with wider building-automation stacks. These moves underscore a race to bundle controls, analytics, and financing within single-vendor propositions, which are viewed favourably by risk-averse buyers.
Technology leadership now rests on open-architecture software that secures IEC 62443 compliance, interoperates with HVAC and access control, and scales AI modules without vendor lock-in. Signify attaining DEKRA cybersecurity validation for Interact illustrates rising baseline expectations, pushing smaller providers toward partnerships or niche vertical focus. White-space opportunities remain in mid-market enterprises that perceive LaaS as complex; nimble specialists simplifying deployment may rapidly accumulate market share. Hardware commoditization means brand differentiation migrates to algorithmic energy optimization and lifecycle assurance—strategic pivot points defining future winners within the Lighting as a Service market.
M&A appetite remains high as diversified distributors, such as Wesco, and private-equity groups sharpen their supply-chain depth and regional channel span. Price competition persists in commodity fixtures, yet the total bundled contract value rises because software and data analytics layers expand ticket size. Vendors with integrated finance arms or access to green-bond pools enjoy lower capital costs, creating defensive moats and heightening the likelihood of further consolidation waves.
Lighting As A Service (LaaS) Industry Leaders
Every Watt Matters
Lumenix
Stouch Lighting
LEDVANCE GmbH
Signify Holdings
- *Disclaimer: Major Players sorted in no particular order


Market Opportunities and Future Outlook
Public-sector and municipal procurement continues to create whitespace for LaaS providers that can package design, financing, installation, controls, and measurement and verification into outcome-based contracts. ESPC-style delivery models are a concrete scaling channel in markets where agencies and municipalities prioritize OPEX treatment and verified savings, and where contract standardization helps reduce transaction costs for multi-site retrofits. Traction in complex facilities is visible in a LaaS retrofit at Nexans Cortaillod in Switzerland, achieving an annual reduction in CO2e of 300 tons.
Technology-led opportunities sit at the intersection of connected controls, performance verification, and circularity. Academic and industry work in 2026 highlights intelligent lighting controls as core enablers for maximizing energy outcomes and supporting circular-economy execution in LaaS models, which keeps demand focused on platforms that support continuous optimization and auditable KPIs rather than one-time component swaps.
Recent Industry Developments
- January 2026: RCG Lighthouse completed an ESCO lighting modernization project across 45 municipal institutions in Tukums, Latvia, structured as a 7-year service contract. This deployment shows continuing reliance on performance-based procurement to move LED and controls upgrades into operating budgets and provides a replicable template for multi-site municipal rollouts.
- January 2025: Acuity Brands completed its acquisition of QSC for USD 1.215 billion, expanding its platform scope in cloud-managed building systems beyond lighting controls. This broadens bundled, outcome-based propositions for enterprise customers by integrating lighting with broader energy management solutions.
- June 2024: Signify announced a 10-year LaaS agreement with Leonardo UK to provide turnkey LED lighting and Interact management software across multiple facilities at its Yeovil site. The contract illustrates how LaaS can shift upgrades to operating budgets while embedding connected controls for ongoing optimization and reporting.


Research Methodology Framework and Report Scope
Market Definition and Coverage
For this methodology, the lighting as a service market covers contract-based lighting outcomes where the customer pays a recurring or agreed fee, and the provider supplies, operates, and maintains the lighting system over the contract term.
Scope exclusions: We exclude one-time lighting product sales without a service contract and general building energy services that do not include lighting delivery.
Segmentation Overview
- By Installation Type
- Indoor
- Outdoor
- By Component
- Luminaires and Controls
- Software and Analytics
- Services (Maintenance, Financing)
- By Contract Type
- Retrofit Projects
- New Installations
- By End User
- Commercial
- Municipal
- Industrial
- Residential
- By Geography
- North America
- United States
- Canada
- Mexico
- Europe
- Germany
- United Kingdom
- France
- Italy
- NORDIC Countries
- Russia
- Rest of Europe
- Asia-Pacific
- China
- India
- Japan
- South Korea
- ASEAN Countries
- Rest of Asia-Pacific
- South America
- Brazil
- Argentina
- Rest of South America
- Middle East and Africa
- Saudi Arabia
- United Arab Emirates
- South Africa
- Egypt
- Rest of Middle East and Africa
- North America
Data Sources, Market Sizing, and Validation
Desk Research
To set the market perimeter and starting values, we rely on public, non-paywalled sources that describe lighting demand, retrofit momentum, and energy efficiency direction. Common inputs include government energy statistics and building energy datasets (such as from the US EIA), efficiency and lighting program material (such as DOE or ENERGY STAR), and international energy indicators (such as IEA). We also use technical standards and adoption guidance (such as IES publications), and procurement and policy signals from public agencies and municipalities.
On the commercial side, we review company annual reports, investor presentations, and press releases to understand contract structures, service bundles, and revenue recognition cues that affect what should be counted as LaaS. For additional cross-checks, we selectively use paid subscriptions for company financials and intelligence, news and financials screening, patent databases, and tender and contract monitoring, mainly to verify deal activity patterns rather than to force a number. The desk research sources cited above are illustrative, and many other public references are used for data collection, validation, and clarification.
Primary Interviews and Surveys
Primary work focuses on validating what is actually sold under LaaS contracts, and how pricing is typically quoted (per site, per fixture, or per area) across retrofit and new installation contexts. We speak with a mix of service providers, system integrators, controls and software stakeholders, and end users such as facility and energy managers across major regions, so assumptions on attach rates, contract length, and service intensity can be corrected before totals are finalized.
Distribution of primary research fieldwork respondents
| Company type | Respondent position | Region |
|---|---|---|
| Top tier: 36% | CXOs: 12% | APAC: 43% |
| Mid tier: 48% | Functional/Unit leaders: 29% | EMEA: 32% |
| Smaller Players: 16% | Managers: 59% | Americas: 25% |
Market-Sizing & Forecasting
Sizing starts with a top-down build that reconstructs the addressable installed base and upgrade pool, then converts it into serviceable LaaS demand using adoption and contract penetration rates by region and end-use. Inputs that typically move the model include LED retrofit activity, public building efficiency targets, average contract term and renewal behavior, share of projects bundled with controls and software analytics, and the mix shift between retrofit projects and new installations.
The totals are then checked using selective bottom-up approximations, such as sampled contract value per site, typical monthly fee ranges, and supplier and channel checks on active project volumes, which helps adjust for gaps where public reporting is thin. Where a sub-segment lacks stable disclosure, we use conservative ranges that are reconciled back to observed deal sizes and procurement signals. For forecasting, scenario analysis is used around retrofit cycles, energy price sensitivity, and financing availability, and the chosen path is aligned to what interviewees expect for conversion pace and renewal rates over the next few years.
Data Validation & Update Cycle
Outputs are stress-tested through variance checks across regions, end users, and contract types, and then compared with independent signals like retrofit programs, tender activity, and the pace of controls and software attachment. If a result looks out of line, the assumptions are re-opened, and follow-up calls are triggered to confirm whether the issue is pricing, adoption, or scope interpretation. Before sign-off, the model and narrative go through multiple analyst reviews so calculation logic and unit consistency are kept intact.
Reports are refreshed annually, and interim updates are made when material events occur, such as policy shifts, demand shocks, or large contract announcements that can change near-term adoption. Before delivery, a final check is done so clients receive the most current view available at the time of release.
Mordor Intelligence's Lighting As A Service Market Size Compared With Other Published Estimates
Published market sizes for lighting as a service often differ because some studies count different revenue buckets, and they also assume different speeds for retrofit conversion and contract renewals. Timing matters too, since exchange-rate dates and the year selected as the starting point can move the headline number.
Some external figures appear to bundle broader smart building spend, including hardware-heavy lighting sales that are not tied to an ongoing service contract, and they can also assume aggressive uptake without matching it to procurement and contract signals. In contrast, Mordor Intelligence counts LaaS only when lighting delivery is governed by a contract fee and the scope is limited to luminaires and controls, software and analytics, and services that are part of that service model.
Benchmark comparison
| Source | Market Size | Gaps in Research Methodology |
|---|---|---|
| Mordor Intelligence | USD 1.01 B (2026) | |
| Industry Media A | USD 2.56 B (2024) | Uses an earlier base year and appears to include broader managed lighting and adjacent building services, which raises the starting value versus a contract-only LaaS count. |
| Market Commentary B | USD 2.79 B (2024) | Includes additional buckets such as general luminaires and controls sold alongside service programs, and the jump in forecast suggests more aggressive adoption and pricing escalation assumptions. |
The table shows that the spread is mainly explained by what gets counted as service revenue and how quickly retrofit demand is assumed to convert into contracted fees. By keeping the inputs tied to contract structure, attach rates for controls and analytics, and realistic renewal behavior, the resulting market size stays traceable to clear steps that can be repeated and reviewed.


Key Questions Answered in the Report
How large is the Lighting as a Service market in 2026?
The Lighting as a Service market size stood at USD 1.01 billion in 2026 and is forecast to climb rapidly through 2031.
What CAGR is forecast for Lighting as a Service solutions?
Market value is projected to rise at a 31.64% CAGR between 2026 and 2031 on the strength of energy-efficiency regulations and smart-city spending.
Which end-user segment is growing fastest?
Municipal projects lead growth at a 38.2% CAGR because cities prefer long-tenor service contracts that modernize infrastructure without capital outlay.
Which geographic region will add the most incremental revenue?
Asia-Pacific shows the steepest 43.9% CAGR owing to large-scale urbanization programs and government-driven LED streetlight schemes.
Why are software and analytics critical in LaaS contracts?
Software layers optimise energy use, predict failures, and supply ESG reporting data, enabling vendors to charge performance-based fees beyond fixture supply.
What is the biggest barrier to adoption among mid-sized enterprises?
Limited awareness of service benefits and confusion over total contract cost versus cap-ex purchase delay decision-making, though education campaigns are starting to narrow the gap.
Page last updated on:


 Your data is secure and never sold or shared.


