
Light Therapy Market Size and Share
Market Overview
| Study Period | 2020 - 2031 |
|---|---|
| Market Size (2026) | USD 1.08 Billion |
| Market Size (2031) | USD 1.33 Billion |
| Growth Rate (2026 - 2031) | 4.38 % |
| Fastest Growing Market | Asia-Pacific |
| Largest Market | North America |
| Market Concentration | Medium |
Major Players *Disclaimer: Major Players sorted in no particular order Image © Mordor Intelligence. Reuse requires attribution under CC BY 4.0. | |
Light Therapy Market Analysis by Mordor Intelligence
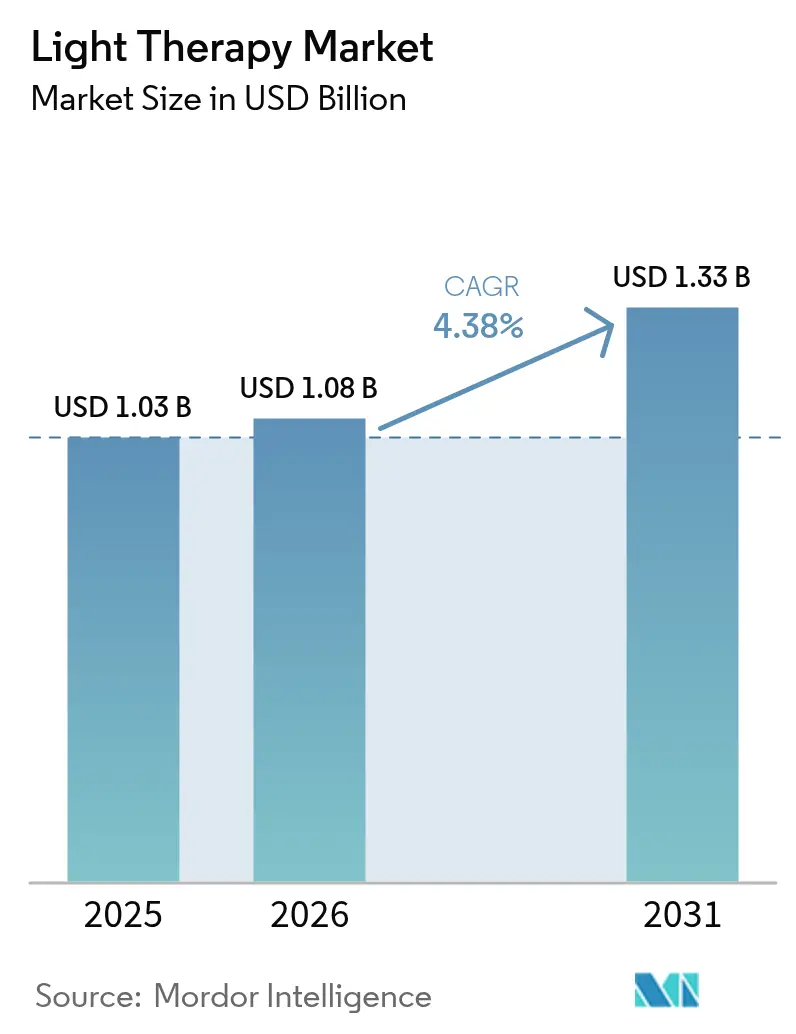
The light therapy market size in 2026 is estimated at USD 1.08 billion, growing from 2025 value of USD 1.03 billion with 2031 projections showing USD 1.33 billion, growing at 4.38% CAGR over 2026-2031. Momentum stems from expanding clinical validation across dermatology, psychiatry, and ophthalmology, with the FDA’s 2024 authorization of the Valeda Light Delivery System for dry age-related macular degeneration marking a pivotal inflection. Home-use modalities are moving into mainstream care after the LITE study confirmed that at-home narrowband UV-B phototherapy achieves non-inferior outcomes to clinic treatment for psoriasis. Growth also benefits from LED cost declines, improved energy efficiency, and heightened public demand for non-invasive aesthetic procedures. Yet regulatory fragmentation and product-quality concerns restrain rapid scale-up, underscoring the importance of standardized dosing protocols and rigorous device testing.
Key Report Takeaways
- By product type, Light Boxes led with 27.10% of the light therapy market share in 2025, while Hand-held Devices are set to expand at a 4.82% CAGR through 2031.
- By light type, Blue light accounted for 35.30% revenue share in 2025; Red light is forecast to grow at 4.72% CAGR to 2031.
- By application, Skin Disorders captured 29.60% of the light therapy market size in 2025, whereas Depression & Sleep-cycle Disorders are advancing at a 4.93% CAGR through 2031.
- By end user, Dermatology Clinics held 40.20% of the light therapy market in 2025, while Home-care Settings are projected to rise at 4.96% CAGR to 2031.
- By geography, North America commanded 44.10% revenue share in 2025; Asia-Pacific represents the fastest-growing region with a 5.01% CAGR through 2031.
Note: Market size and forecast figures in this report are generated using Mordor Intelligence’s proprietary estimation framework, updated with the latest available data and insights as of 2026.
Global Light Therapy Market Trends and Insights
Drivers Impact Analysis*
| Driver | (~) % Impact on CAGR Forecast | Geographic Relevance | Impact Timeline |
|---|---|---|---|
| Rising prevalence of dermatological & mood disorders | +1.2% | North America & Europe | Medium term (2-4 years) |
| Rapid uptake of at-home / wearable solutions | +0.9% | North America & Asia-Pacific | Short term (≤ 2 years) |
| LED cost curve & energy-efficiency gains | +0.7% | Global manufacturing hubs (primarily Asia-Pacific) | Long term (≥ 4 years) |
| Heightened awareness of non-invasive aesthetics | +0.6% | North America & Europe, emerging in Asia-Pacific | Medium term (2-4 years) |
| IoT-enabled personalised dosing platforms | +0.4% | Tech-forward markets: North America, Europe, Japan | Long term (≥ 4 years) |
| Sports-medicine adoption for musculoskeletal recovery | +0.3% | North America & Europe (professional sports markets) | Short term (≤ 2 years) |
| Source: Mordor Intelligence | |||
Rising Prevalence of Dermatological & Mood Disorders
Seasonal affective disorder affects up to 30% of individuals with major depressive or bipolar disorders in higher latitudes, creating a sizeable pool of candidates for light-based mood management. Psoriasis, vitiligo, and atopic dermatitis incidences continue growing worldwide, with 60% of psoriasis patients achieving clear or nearly clear skin after 12 weeks of home UV-B therapy in the LITE study. Concurrent vitamin D insufficiency, still prevalent in a large number of United States residents, further supports growth for phototherapy options that stimulate dermal synthesis pathways. Together, these epidemiological patterns lift clinical demand and underpin insurers’ willingness to broaden coverage for evidence-backed devices. The resulting expansion of the light therapy market reflects an alignment between unmet clinical needs and maturing device efficacy data.
Rapid Uptake of At-Home / Wearable Solutions
Patient adherence improves when therapy is delivered at home, as travel time, scheduling conflicts, and clinic queues disappear. Within the LITE trial cohort, home-based users completed more prescribed sessions than clinic peers, confirming commercial viability for consumer-centric designs. IoT-linked glasses and visors, such as circadian-light eyewear, now fine-tune dose timing according to biometric feedback, adding perceived value for tech-savvy buyers. Despite rising unit sales, performance variability remains wide; an independent pilot study showed large differences in irradiance and treatment guidelines across retail handheld LEDs [1]. Premium brands, therefore, differentiate via clinical validation, precision dosage controls, and compliant manufacturing, reinforcing tiered price-point strategies across the light therapy market.
LED Cost Curve & Energy-Efficiency Gains
LED efficacy gains cut operating costs for clinics and consumers alike. Advanced phosphor-converted light sources and micro-LED matrices now deliver equivalent therapeutic irradiance with lower wattage draw, easing electric-bill concerns for full-body panels [2]. Researchers at KAIST demonstrated a flexible origami-style mask containing 3,770 micro-LEDs that improved deep-skin elasticity 3.4-fold versus rigid designs. Such breakthroughs cut material usage, reduce heat build-up, and open new form-factor options, expanding adoption in aesthetic and sports-medicine niches. Over the long term, LED cost erosion remains a structural tailwind that keeps device ASPs within reach of budget-conscious home users.
Heightened Awareness of Non-Invasive Aesthetics
Consumer surveys show a clear preference for procedures that avoid needles, incisions, or downtime, accelerating demand for photobiomodulation in wrinkle reduction and skin-tone enhancement. Dermatologists underscore safety for most skin types, provided users follow illumination schedules and protect photosensitive areas. Social-media endorsements further amplify interest, pushing manufacturers to launch sleek, fashion-forward wearables. Clinics respond by bundling red-light sessions with existing laser or chemical-peel packages, widening revenue streams without major capital spend. These intertwined drivers enlarge the light therapy market by attracting lifestyle-oriented buyers as well as medically referred patients.
Restraints Impact Analysis*
| Restraint | (~) % Impact on CAGR Forecast | Geographic Relevance | Impact Timeline |
|---|---|---|---|
| Side-effects & lack of dosing standards | −0.8% | Global, especially North America & Europe | Medium term (2-4 years) |
| Fragmented regulatory classifications | −0.6% | Global, with complexity in EU and emerging markets | Long term (≥ 4 years) |
| Proliferation of low-quality e-commerce imports | −0.5% | North America & Asia-Pacific online retail channels | Short term (≤ 2 years) |
| High electricity prices for full-body panels | −0.3% | Europe and other developed markets with elevated power costs | Medium term (2-4 years) |
| Source: Mordor Intelligence | |||
Side-Effects & Lack of Dosing Standards
Systematic reviews reveal wide variation in light fluence, wavelength, and session length across clinical trials, complicating cross-study comparisons and hampering guideline creation. Although adverse events are generally mild, reports of dizziness and headaches persist, and bipolar patients face the risk of manic switching if exposure exceeds safe thresholds. Manufacturers must therefore supply clear protocols, but rapid entry of price-led brands often dilutes messaging. The resulting uncertainty deters cautious clinicians and undermines insurance confidence, slowing penetration of the light therapy market in conservative health systems.
Fragmented Regulatory Classifications
Device class assignments vary by indication and jurisdiction, forcing companies to navigate multiple approval tracks that inflate development timelines and compliance costs. The FDA places seasonal-affective light boxes under Class II exemptions, whereas the European Union now demands stricter CE marking evidence for many aesthetic rigs. China recently tightened oversight of red-light myopia devices, abruptly blocking several imported models. Such shifts complicate global rollout strategies and favor firms with deeper regulatory affairs capability, slightly tempering overall light therapy market growth prospects.
*Our forecasts treat driver/restraint impacts as directional, not additive. The impact forecasts reflect baseline growth, mix effects, and variable interactions.
Segment Analysis
By Product Type: Hand-held Devices Drive Innovation
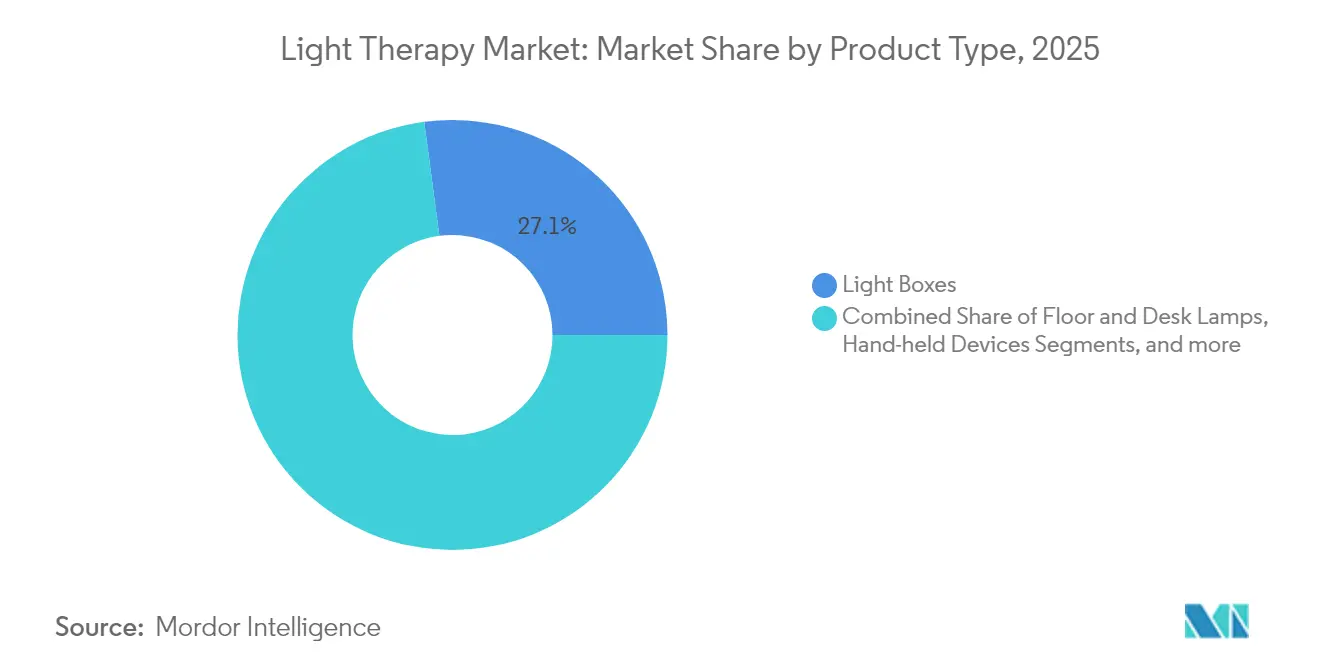
Light Boxes retained 27.10% of 2025 revenue because 10,000-lux panels remain the gold standard for seasonal affective disorder. Hand-held systems represent the fastest-expanding slice of the light therapy market with a 4.82% CAGR, supported by consumer desire for portability and private use. Floor and Desk Lamps fill the gap for users balancing portability and intensity, while Light Visors allow treatment during routine tasks. Dawn Simulators appeal to circadian-rhythm sufferers seeking gentle morning exposure, and Light Bulbs offer the lowest entry cost, though efficacy depends on distance and angle. The wide spectrum of form factors helps suppliers serve distinct price bands and use environments.
Growth within handheld devices also benefits from smartphone-linked dosing apps that guide users through session scheduling, maximizing adherence. Manufacturers now integrate multiwavelength arrays in pocket-sized housings, addressing diverse dermatology and sports-recovery needs. Performance variability, highlighted in laboratory tests showing irradiance differences of more than 40%, continues pushing premium brands to publish peer-reviewed validation. Elevated consumer expectations for clinical proof and safety certification reinforce differentiation across the light therapy market.
Hand-held innovation aligns with telehealth expansion, letting dermatologists prescribe specific devices with remote progress tracking. The resulting data loops feed algorithmic refinements that fine-tune wavelength selection and dose incrementally. Longer-life lithium batteries extend uninterrupted session times, and heat-sink designs mitigate skin discomfort. Accessory ecosystems—tripods, facial shields, replacement LED heads—create aftermarket revenue streams. Retail channels now include pharmacies and electronics chains, broadening reach beyond traditional medical suppliers. Overall, the evolving product mix underpins a resilient light therapy market size trajectory while reshaping revenue allocation across categories.

By Light Type: Red Light Gains Therapeutic Momentum
Blue light therapy secured 35.30% light therapy market share in 2025 by targeting acne, neonatal jaundice, and circadian applications, yet Red light registers the highest future pace at 4.72% CAGR. Red and near-infrared wavelengths (630–850 nm) stimulate mitochondrial cytochrome c oxidase, boosting ATP production and collagen synthesis, which aids wound repair and muscle recovery. Sports clinics increasingly deploy red-light rigs during post-training cool-downs to cut creatine-kinase spikes and accelerate readiness. White light retains steady demand for mood disorders, delivering full-spectrum illumination that maximizes retinal photoreceptor engagement without pharmacologic side effects.
Dual-wavelength systems allowing blue-plus-red sequencing gain attention because sequential bacterial reduction and dermal metabolism stimulation may shorten acne treatment cycles. Regulatory scrutiny remains toughest for blue light regarding retinal-toxicity thresholds, while red light enjoys a more lenient safety reputation, expediting consumer approval. The combination of growing evidence and safety perception tilts investment toward red-dominant devices in clinical and home channels across the light therapy market.
By Application: Depression Treatment Accelerates Growth
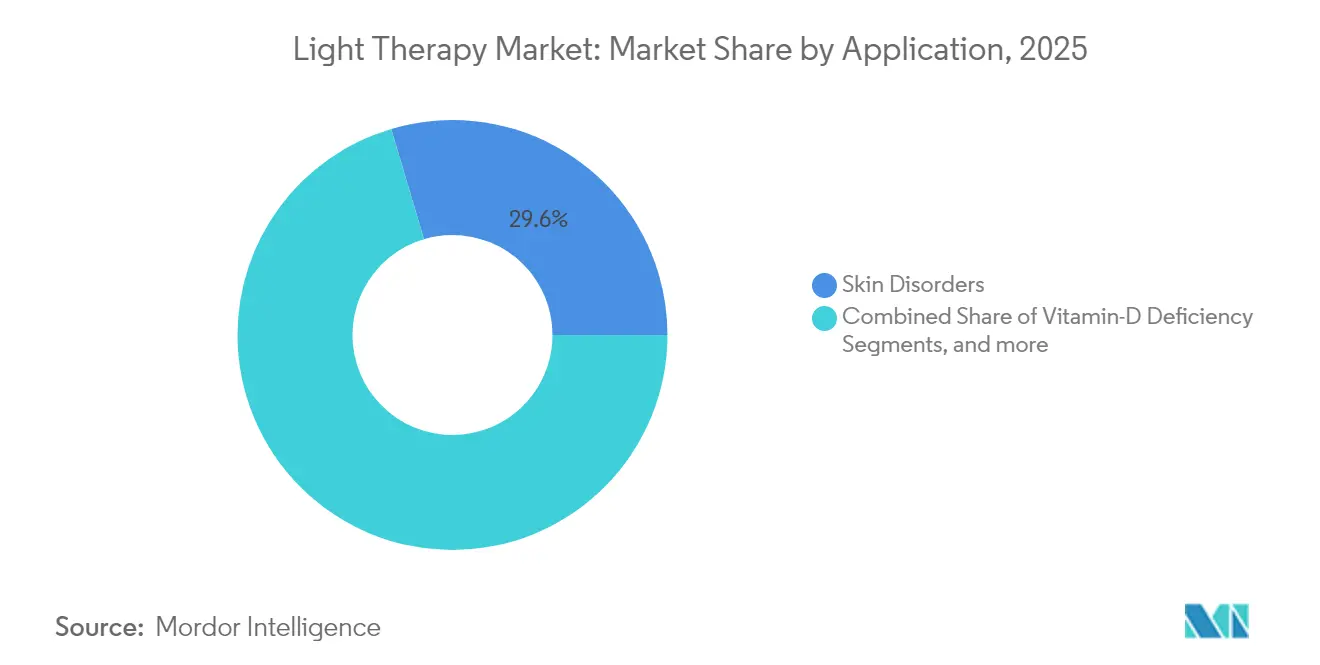
Skin-disorder uses, including psoriasis and vitiligo, delivered 29.60% of 2025 sales; however, Depression & Sleep-cycle Disorders are on a 4.93% CAGR ascent as psychiatrists endorse bright-light sessions as first-line care for seasonal affective disorder. Meta-analysis shows meaningful symptom reduction when patients receive photobiomodulation in morning blocks lasting 30 minutes . Wearable circadian glasses fit office routines, broadening user demographics beyond clinic attendees. Neonatal Jaundice treatments continue relying on high-intensity blue arrays to accelerate bilirubin breakdown, while emerging ophthalmology protocols after Valeda’s FDA clearance signal fresh demand in aging cohorts. Oncology support, where red or near-infrared light mitigates oral mucositis, provides an additional specialist niche.
Continued publication of randomized trials sharpens dosing parameters, encouraging insurers to extend coverage, especially for depression. As stigma around mental-health treatment declines, willingness to self-treat in homes increases, sustaining volume growth. The synergy between psychiatric and dermatologic indications dilutes seasonality, smoothing revenue streams across the light therapy market calendar.
By End User: Home-care Settings Transform Delivery Models
Dermatology Clinics held 40.20% of 2025 transactions, but Home-care Settings demonstrate the quickest trajectory at 4.96% CAGR, propelled by evidence that home UV-B therapy matches clinic outcomes. Nursing-supervised rollouts reduce misuse risk and bolster adherence, lowering relapse rates. Hospitals keep leveraging full-body cabinets for complex dermatoses and neonatal wards, yet procurement teams favor compact LED towers to save floor space. Sports-medicine centers, though smaller in unit count, purchase high-irradiance red-light arrays for professional teams, raising visibility among amateur athletes.
Growth in home-care hinges on clear user instructions, app-based coaching, and remote clinician dashboards that track session logs. Reimbursement pilots in the United States allow device rental schemes reimbursed under durable-medical-equipment codes, cutting upfront cost barriers. As technology matures, subscription models bundling hardware, consumables, and teleconsults could further expand the light therapy market size allocated to residential use.
Geography Analysis
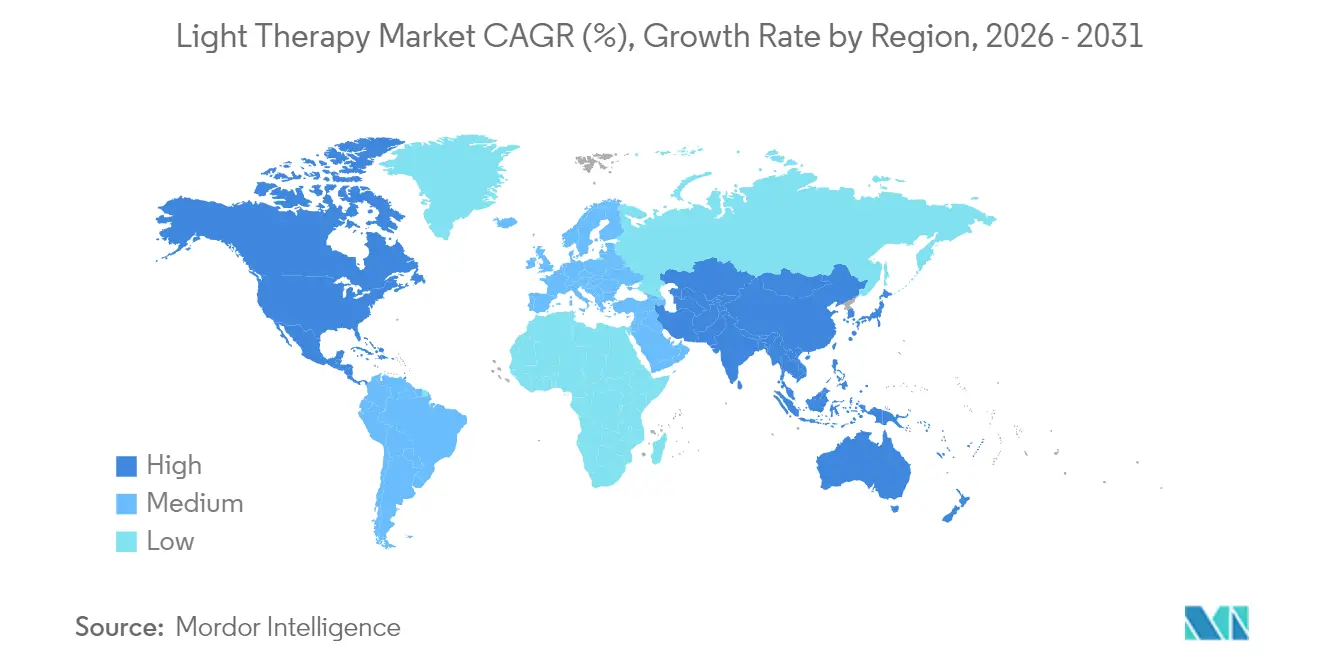
North America accounted for 44.10% of 2025 spending, thanks to robust clinical infrastructure, broad insurance coverage for psoriasis and seasonal affective disorder, and high consumer awareness. The FDA’s de novo authorization of photobiomodulation for dry age-related macular degeneration validates ophthalmic use and may shorten clearance times for follow-on devices, reinforcing regional technology leadership. Canada’s publicly funded system reimburses clinic-based UV-B for vitiligo and psoriasis, while private insurers increasingly trial home-phototherapy pay-for-performance models. Mexico’s medical-tourism corridors draw price-sensitive cosmetic clients, raising unit demand for aesthetic red-light rigs in private clinics. Elevated electricity tariffs have led some United States dermatology practices to retrofit legacy fluorescent cabinets with energy-efficient LED panels, lowering operating overheads and extending service life.
Europe posts steady expansion as stringent Medical Device Regulation rules screen out under-validated imports, boosting consumer confidence. Germany and the United Kingdom adopt phototherapy widely for chronic plaque psoriasis, supported by national treatment guidelines and hospital day-care facilities. Scandinavian countries exhibit high uptake of dawn-simulation alarms and full-spectrum white-light boxes during dark winters, stabilizing the light therapy market across seasonal cycles. The European Commission’s Green Deal pushes clinics toward energy-efficient hardware, supporting LED vendor growth. Ongoing pan-EU registry studies, such as LumiThera’s long-term AMD tracking, supply real-world evidence and inform reimbursement negotiations.
Asia-Pacific represents the fastest progression with a 5.01% CAGR through 2031. Rising dermatological disorder prevalence in China and India, together with growing disposable incomes, bolsters sales of consumer-grade facial masks and portable panels. Japan’s super-aged society creates demand for ophthalmic and musculoskeletal photobiomodulation, while South Korea’s beauty-technology ecosystem accelerates early adoption of high-density LED masks. Regulatory tightening in China for pediatric myopia devices shifted market share toward compliant domestic players, demonstrating the region’s maturing oversight landscape. Meanwhile, Australia’s high skin-cancer rates drive public awareness campaigns promoting phototherapy options that minimize medication reliance.
Regulatory Landscape
In the United States, the Food and Drug Administration (FDA) continues to refine how light-based systems are classified and controlled across indications. On May 1, 2026, the FDA issued a final order classifying a specific phototherapy device indication (reducing the appearance of acute post-surgical incisions) as Class II with special controls under 21 CFR 878.4880. The order reinforces a risk-based pathway for certain phototherapy uses and explicitly excludes products containing drugs or biologics.
Quality and safety compliance requirements also tightened in 2026. The FDA Quality Management System Regulation (QMSR) became effective on February 2, 2026 and incorporates ISO 13485:2016 by reference, raising expectations for design controls, production, and post-market processes for manufacturers selling into the US. In Europe, Regulation (EU) 2017/745 (MDR) remains the central framework for medical devices, and the publication of EN IEC 60601-2-57:2026 by CEN-CENELEC in February 2026 provides a clearer electrical-safety and essential-performance standard for non-laser light source equipment used for therapeutic and aesthetic purposes. This supports more consistent conformity assessment under MDR.
Competitive Landscape
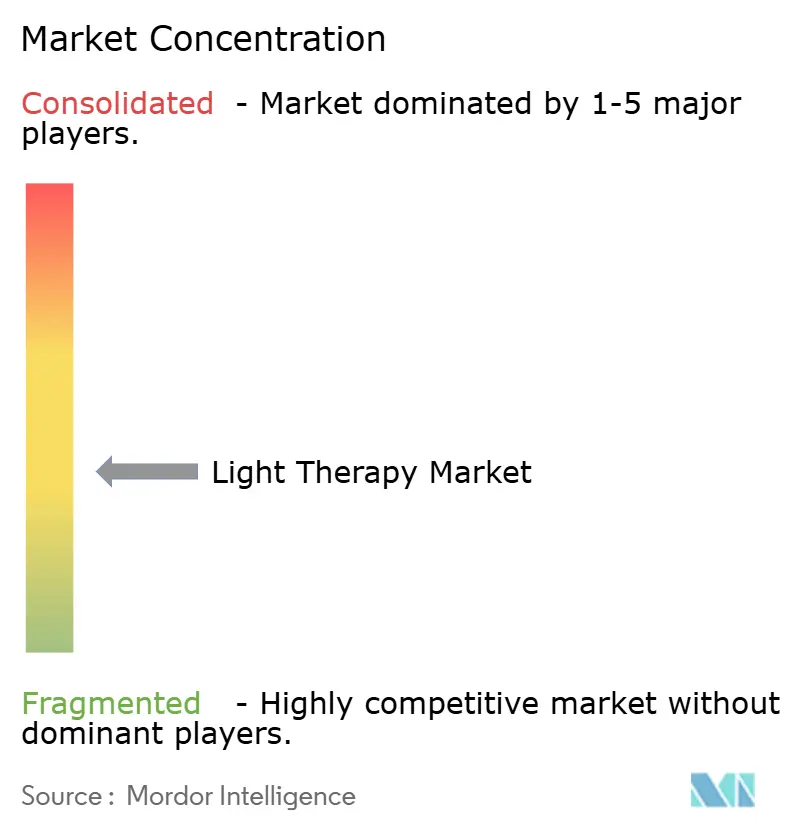
The light therapy market remains moderately fragmented, with specialty firms focusing on dermatology, psychiatric, neonatal, or aesthetic segments. Platform consolidation has begun; Hahn & Co.’s merger of Cynosure and Lutronic in 2024 created a sizeable aesthetic-laser portfolio poised to cross-sell LED phototherapy accessories through an expanded distributor network. Philips continues leveraging hospital relationships to upsell full-body UV-B cabinets, underpinned by its service infrastructure and bundled maintenance contracts.
Strategic investments target AI-driven dosing and connected-device ecosystems. Start-ups like PhotoPharmics, which raised USD 6 million in 2025 to progress Parkinson’s light-therapy trials, illustrate therapeutic diversification beyond skin and mood disorders. Large consumer-electronics firms eye crossover opportunities, licensing medical-grade diodes to embed into wellness wearables. Intellectual-property portfolios center on wavelength-specific LED arrays, thermal-management designs, and predictive analytics algorithms.
Price competition intensifies in online channels, with low-cost imports eroding margins. To defend their share, premium brands highlight FDA or CE clearances, publish peer-reviewed results data, and offer extended warranties. Co-marketing with dermatologists and sports-teams builds credibility and cultivates influencer-driven demand. Overall, competitive positioning now hinges on regulatory compliance, clinical evidence depth, and integration of smart-device functionality, all of which monitor treatment adherence and outcomes while generating proprietary datasets that reinforce brand stickiness.
Light Therapy Industry Leaders
-
Koninklijke Philips N.V.
-
Verilux, Inc.
-
Northern Light Technologies
-
Beurer GmbH
-
Zepter International
- *Disclaimer: Major Players sorted in no particular order
Market Opportunities and Future Outlook
A key whitespace is the shift from consumer-facing form factors toward regulated, indication-backed devices, particularly for dermatology and hair-related uses where home-care adoption is rising. In April 2026, BioPhotas introduced the Celluma MYSTIQUE as an FDA-cleared LED mask indicated for acne, facial wrinkles, and hair loss on the scalp. The multi-indication clearance widens addressable demand and also provides a more defensible basis for premium pricing compared with unvalidated e-commerce alternatives.
Clinical expansion beyond core dermatology and mood-disorder use cases is opening additional commercialization paths tied to specialist care, trial design, and reimbursement narratives. In May 2026, Photopharmics presented top-line results from the pivotal LIGHT for PD trial (NCT04453033) for the Celeste light therapy device, supporting movement toward higher-evidence neurology claims that can differentiate therapeutic devices from general wellness products. Separately, emerging delivery concepts such as a wearable near-infrared LED photothermal microneedle patch (randomized pilot data published in 2026) and supportive-care PBM applications (a randomized, double-blind trial reported in February 2026 showing reduced severe oral mucositis with an intraoral PBM device) point to combination modalities and oncology supportive care as additional lanes. Differentiation here depends on clinical protocols, dosing controls, and lifecycle evidence generation.
Recent Industry Developments
- August 2026: Signify announced United States market availability for Philips Skylight and Philips Skylight VitaUp starting September 2026. The announcement extends circadian and wellness-oriented ceiling lighting into a larger consumer and professional channel footprint. It also increases competitive pressure on traditional light box and lamp suppliers to differentiate on dosing, safety, and clinical positioning.
- December 2025: Royal Philips expanded commercial availability of LumiGuide, a real-time AI-enabled light-based 3D navigation solution for image-guided therapy, with broader rollout in Europe and the United States effective January 2026. While not a phototherapy product, the rollout highlights accelerating adoption of light-based platforms in clinical procedure workflows. It also reinforces investment in optical hardware, software, and validation capabilities across healthcare applications.
- November 2024: The FDA granted de novo authorization for LumiThera's Valeda Light Delivery System for dry age-related macular degeneration. This milestone established a defined regulatory precedent for ophthalmic photobiomodulation. It also supported follow-on product development programs seeking clearer pathways for clinical evidence and labeling.
Research Methodology Framework and Report Scope
Market Definition and Coverage
This market covers light therapy devices and systems used to deliver controlled visible or near-infrared light for therapeutic purposes across clinical and home settings, where the equipment is intended to support treatment routines in areas such as skin care, mood, sleep, neonatal care, and pain relief.
Scope exclusions: We exclude UV tanning beds, UVB phototherapy cabins, industrial or horticultural lighting, and single-use diagnostic light probes.
Segmentation Overview
- By Product Type
- Light Boxes
- Floor & Desk Lamps
- Light Visors
- Dawn Simulators
- Light Therapy Bulbs
- Hand-held Devices
- Others
- By Light Type
- White
- Blue
- Red
- Others
- By Application
- Vitamin-D Deficiency
- Seasonal Affective Disorder (SAD)
- Depression & Sleep-cycle Disorders
- Skin Disorders
- Neonatal Jaundice
- Others
- By End User
- Dermatology Clinics
- Hospitals
- Home-care Settings
- Others
- By Geography
- North America
- United States
- Canada
- Mexico
- Europe
- Germany
- United Kingdom
- France
- Italy
- Spain
- Rest of Europe
- Asia-Pacific
- China
- Japan
- India
- South Korea
- Australia
- Rest of Asia-Pacific
- Middle East and Africa
- GCC
- South Africa
- Rest of Middle East and Africa
- South America
- Brazil
- Argentina
- Rest of South America
- North America
Data Sources, Market Sizing, and Validation
Desk Research
Desk research starts by mapping the demand and supply context for where light therapy is actually used, and then translating that into device categories that can be priced and tracked over time. We relied on public sources such as the US FDA device databases and recall notices, the US National Library of Medicine (clinical publications), and the WHO and CDC pages that help validate clinical use patterns and condition prevalence signals.
To make the supply picture more consistent, we also reviewed company annual reports, regulatory press releases, investor presentations, and reputable healthcare media coverage, which helped confirm product launches, geographic presence, and channel focus. In parallel, we referenced paid databases for company financials and intelligence, news and financials sources, and patent databases to cross-check filing activity, ownership changes, and technology focus. The desk sources listed here are illustrative only, and many other public documents and datasets were also reviewed for data collection, cross-checks, and clarifications.
Primary Interviews and Surveys
Primary interviews and surveys were used to test what we saw in desk research and to tighten assumptions that usually swing the model, especially adoption by setting and realistic average selling prices by device format. We spoke with a mix of device-side leaders, distributors, clinicians, and care providers across major regions, and we used follow-up outreach when responses suggested large variance in utilization, reimbursement, or replacement cycles.
Distribution of primary research fieldwork respondents
| Company type | Respondent position | Region |
|---|---|---|
| Top tier: 32% | CXOs: 18% | APAC: 44% |
| Mid tier: 50% | Functional/Unit leaders: 26% | EMEA: 36% |
| Smaller Players: 18% | Managers: 56% | Americas: 20% |
Market-Sizing & Forecasting
Sizing was built using a top-down and bottom-up approach. Condition and care-setting demand pools are first translated into device needs, then checked against supply-side indicators. The top-down path uses a penetration-based demand pool assessment by application and setting, and then converts that into annual device revenue using typical replacement cycles and pricing bands by product format.
To keep the totals grounded, selective bottom-up approximations were used, including roll-ups of reported revenues where available, channel checks on shipment intensity, and sampled ASP x volume logic for high-visibility device types. Where company disclosures do not break out light therapy cleanly, we handle gaps through conservative allocation rules that are reviewed with interview feedback, and then stress-tested so one assumption does not dominate the full market.
Key model inputs include indicators such as prevalence and treated share for common target conditions, the split between clinic and home use, ASP progression for LED-based and near-infrared devices, replacement or upgrade cadence (often tied to durability and clinical protocols), and regional mix shifts that influence pricing and adoption. Forecasts are produced using scenario analysis, with base, conservative, and expansion cases built around adoption rates, pricing trends, and regulatory or reimbursement signals. The final view is selected after expert checks on what is realistic for the next few years.
Data Validation & Update Cycle
Outputs are validated through triangulation across independent signals, so modeled revenue is checked against regulatory activity, product launch timing, and observed changes in clinical use discussions. When a country or segment shows an unexpected jump or drop, the drivers are rechecked, assumptions are revisited, and interview follow-ups are triggered to confirm whether it reflects a true shift or a modeling artifact.
Before sign-off, the work goes through multi-step analyst reviews that include logic checks, year-over-year variance checks, and consistency checks across regions and applications. Reports are refreshed annually, and interim updates are made when material events occur, such as major regulatory actions, large pricing changes, or notable shifts in care delivery. Right before delivery, a final pass is completed so clients receive the most current view available.
Mordor Intelligence's Light Therapy Market Size Versus Other Published Estimates
Market size numbers for light therapy can look different across publishers because the product boundary is not always drawn in the same way, and year labeling also varies between studies. Differences in what gets counted as light therapy, how home-use devices are treated, and how pricing is normalized across regions tend to create the largest spreads.
The table points to a wide range that is mostly explained by scope and conversion choices, and then by the growth case embedded in the forecast. Some estimates fold in UVB cabin-style phototherapy or broader phototherapy equipment, while others focus narrowly on SAD lamps or only medical settings, which changes the counted revenue base and the implied adoption curve.
Benchmark comparison
| Source | Market Size | Gaps in Research Methodology |
|---|---|---|
| Mordor Intelligence | USD 1.08 B (2026) | |
| Trade Journal A | USD 0.52 B (2021) | Uses an earlier base year and a narrower revenue pool that leans toward selected device categories, and it also does not clearly separate UV-adjacent phototherapy revenues from core visible and near-infrared therapeutic devices. |
| Global Consultancy B | USD 1.30 B (2025) | Applies a broader product umbrella that can blend medical phototherapy equipment and consumer wellness lighting, and the total is sensitive to how currency timing and regional price averages are set for that year. |
The spread across sources is mainly about what is counted and when it is counted, which is why simple year-to-year comparisons can be misleading. The table shows this clearly, and in Mordor Intelligence's model the total is built from visible and near-infrared therapeutic devices while excluding UV tanning and UVB cabin-style systems. With that scope locked, our checks on adoption by setting, replacement cycles, and regional mix help keep the market value traceable and practical for planning.
Key Questions Answered in the Report
What is the current size of the light therapy market?
The market stands at USD 1.08 billion in 2026 and is forecast to reach USD 1.33 billion by 2031, supported by a 4.38% CAGR.
Which segment is expanding fastest within the light therapy market?
Hand-held Devices lead growth with a projected 4.82% CAGR, driven by portability and strong uptake in home-care settings.
Why is North America dominant in the light therapy market?
North American leadership stems from robust clinical infrastructure, favorable reimbursement, and early regulatory approvals such as the FDA’s clearance of photobiomodulation for dry AMD.
How are regulatory differences impacting light-therapy device makers?
Fragmented classifications across regions increase cost and complexity, favoring firms with deep regulatory expertise and documented clinical evidence.
What clinical conditions most benefit from light therapy today?
Dermatological disorders like psoriasis, mood conditions such as seasonal affective disorder, and neonatal jaundice remain core, while ophthalmology and sports-recovery uses are rising quickly.
Are home-use light-therapy devices as effective as clinic treatments?
Randomized studies, including the LITE trial, indicate that properly dosed at-home narrowband UV-B can match clinic results for psoriasis, provided users follow validated protocols under clinician guidance.