
Light Sensors Market Size and Share
Market Overview
| Study Period | 2020 - 2031 |
|---|---|
| Market Size (2026) | USD 4.39 Billion |
| Market Size (2031) | USD 6.08 Billion |
| Growth Rate (2026 - 2031) | 6.75 % |
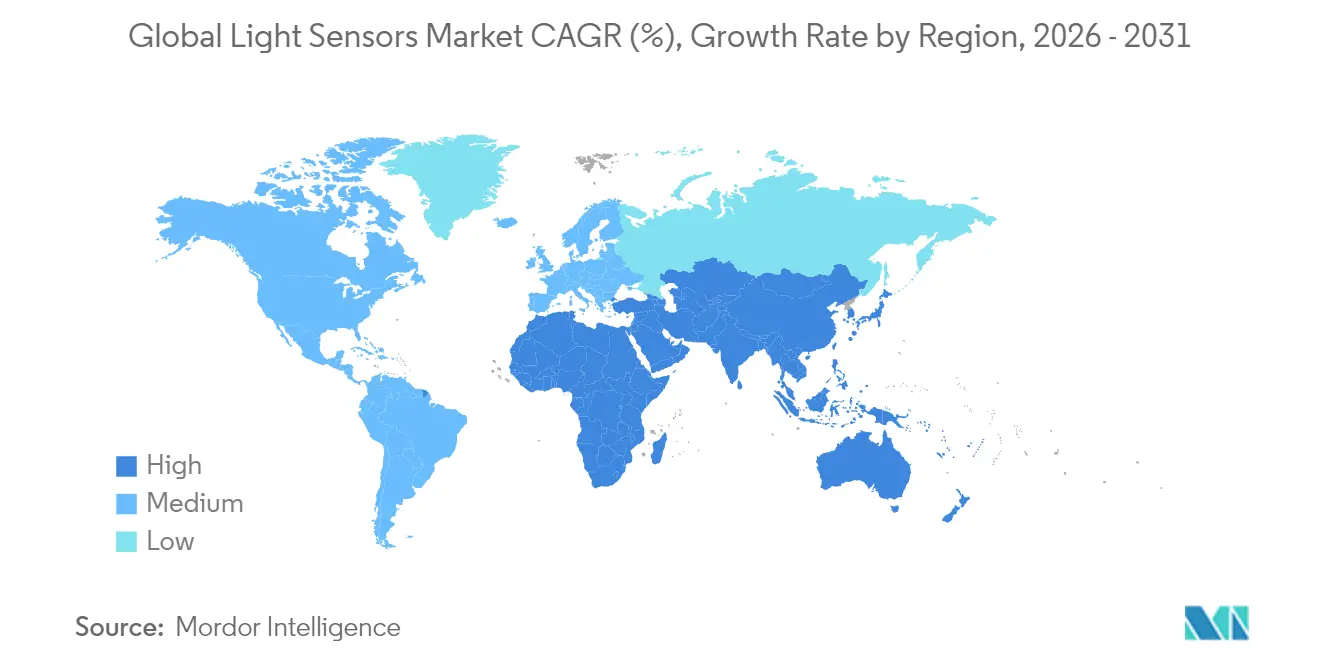
| Fastest Growing Market | Middle East and Africa |
| Largest Market | Asia Pacific |
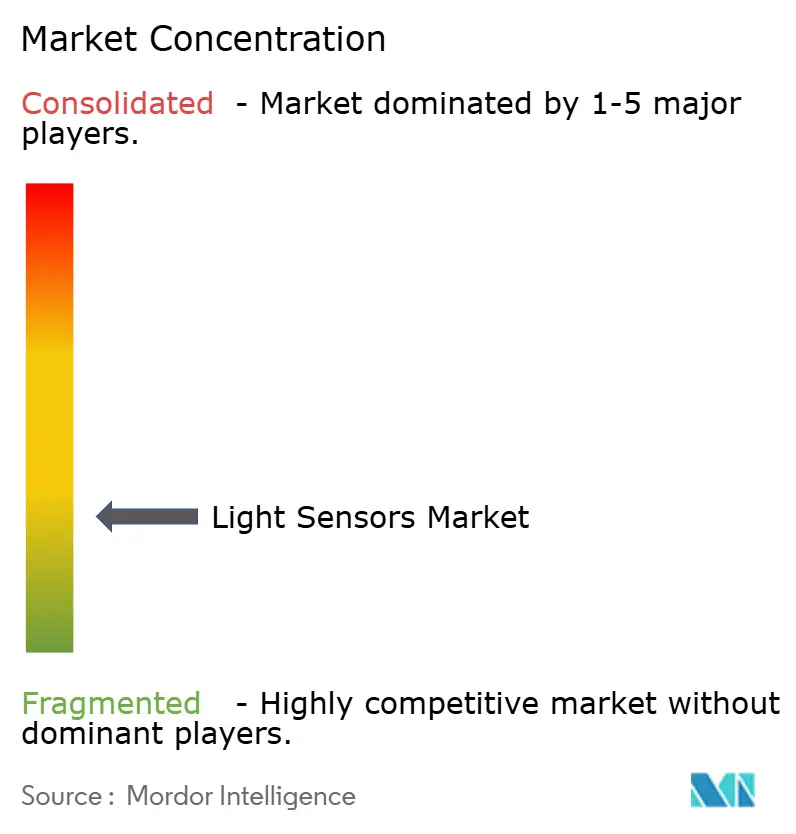
| Market Concentration | Low |
Major Players *Disclaimer: Major Players sorted in no particular order Image © Mordor Intelligence. Reuse requires attribution under CC BY 4.0. | |
Light Sensors Market Analysis by Mordor Intelligence
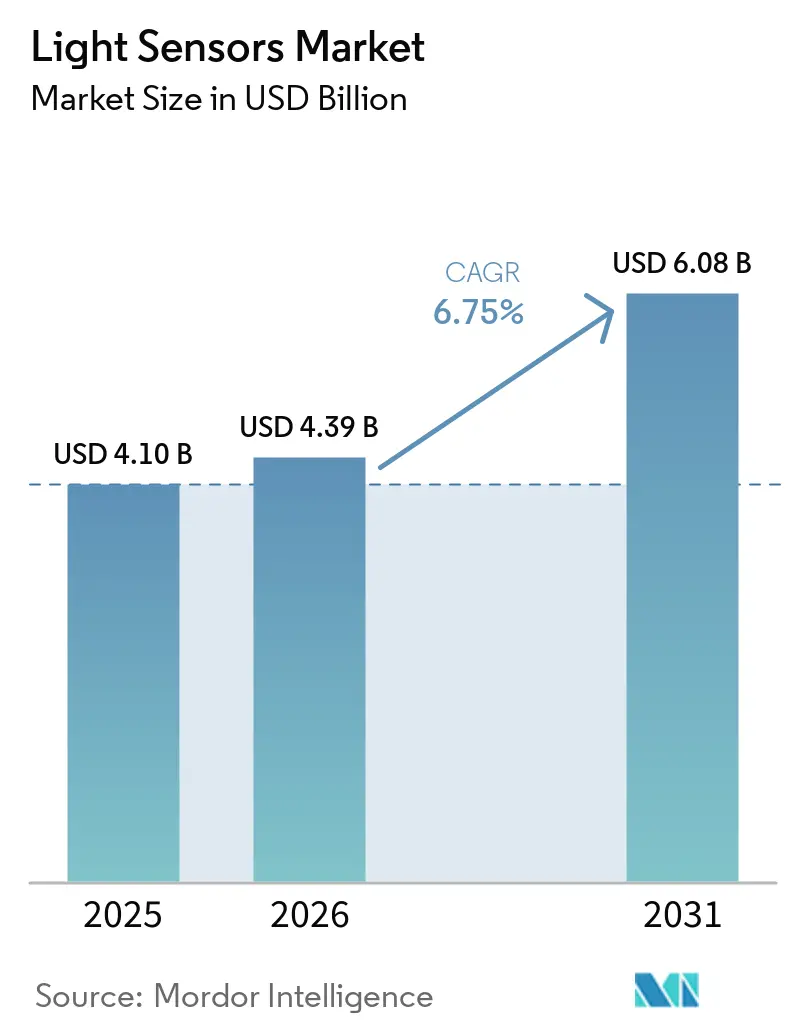
The light sensor market size in 2026 is estimated at USD 4.39 billion, growing from 2025 value of USD 4.1 billion with 2031 projections showing USD 6.08 billion, growing at 6.75% CAGR over 2026-2031. Demand resilience stems from the parallel rise of automotive safety systems and bezel-free smartphone displays, both of which rely on precise optical detection. CMOS image-sensor integration keeps overall costs contained, while MEMS architectures unlock compact form factors for wearables. Asia’s dominance in semiconductor fabrication shortens development cycles, and automotive regulations in Europe and North America underpin long-term volume commitments. Price competition remains intense in consumer electronics, yet higher-margin opportunities persist in LiDAR, driver monitoring, and multispectral sensing for agriculture.
Key Report Takeaways
- By end-use industry, consumer electronics led with 47.60% light sensor market share in 2025, while automotive and transportation is advancing at a 11.80% CAGR through 2031.
- By geography, Asia-Pacific accounted for 40.10% of revenue in 2025; North America is poised for the fastest regional expansion at 9.00% CAGR through 2031.
- By technology, CMOS held 67.60% light sensor market size in 2025; MEMS technology is expected to grow at 11.10% CAGR.
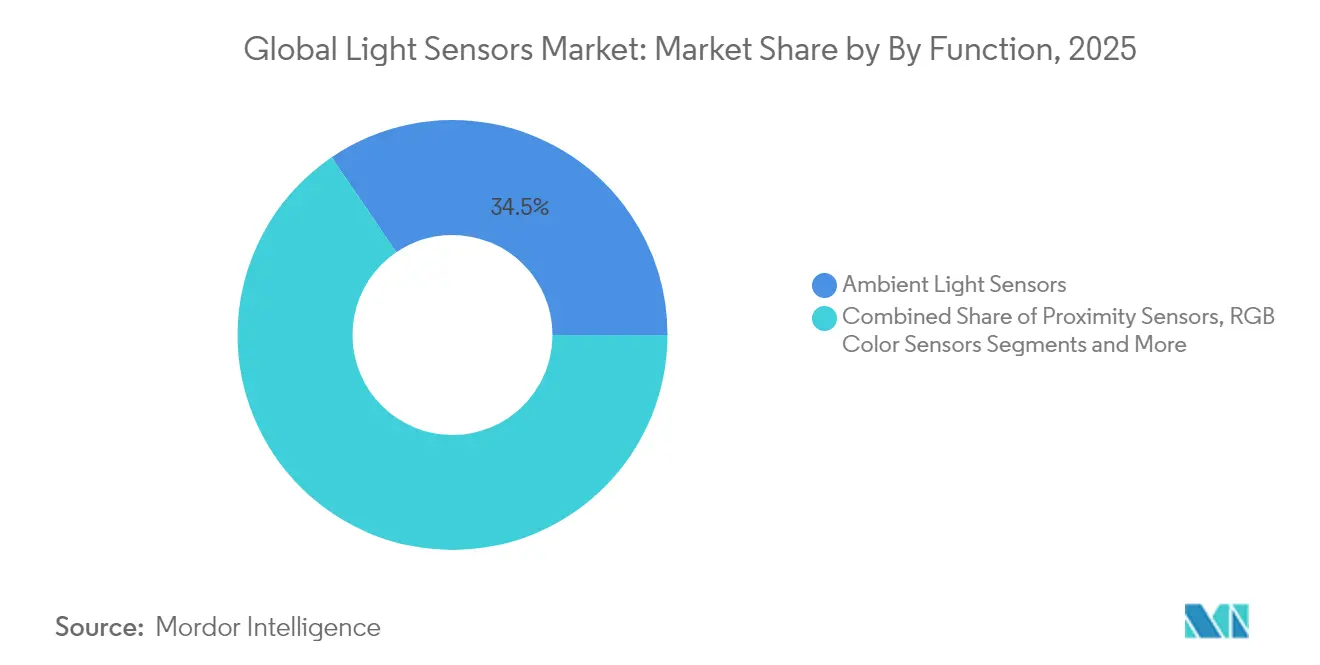
- By function, ambient light sensors controlled 34.50% revenue in 2025, whereas gesture recognition sensors are scaling at 13.50% CAGR.
- By output type, digital sensors occupied 59.40% share of the light sensor market size in 2025 and are forecast to expand at 9.10% CAGR through 2031.
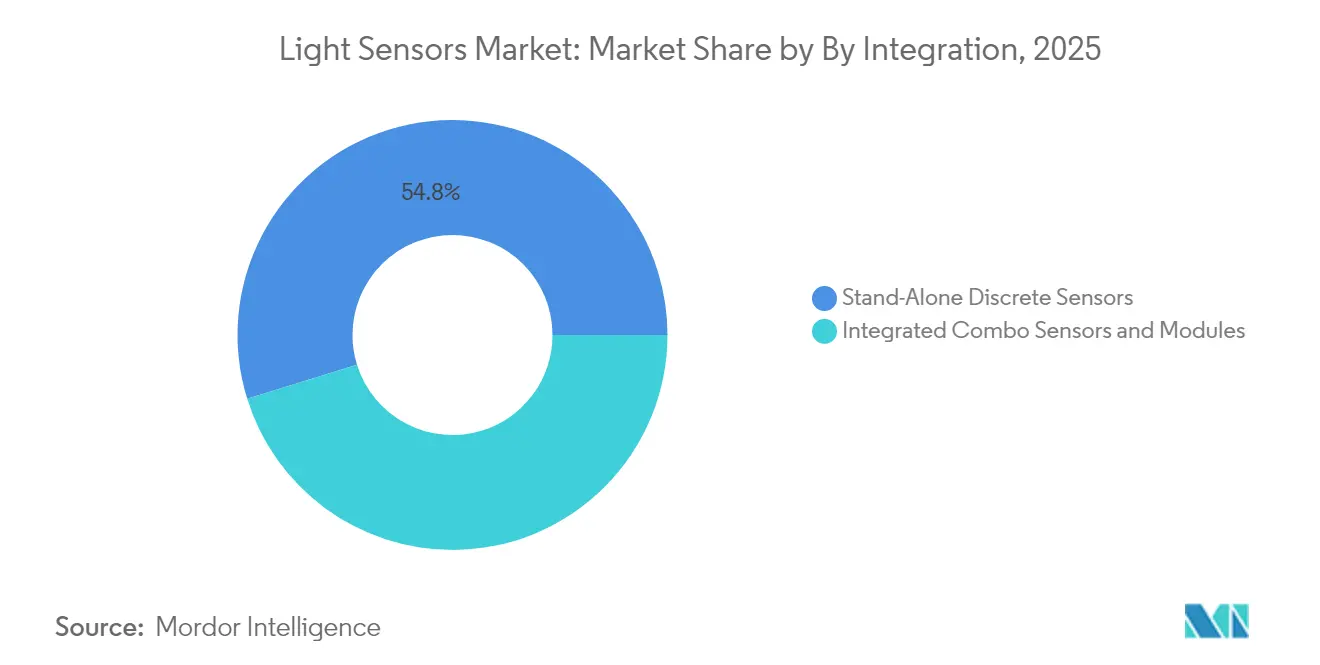
- By integration level, combo modules are the fastest-growing configuration at 12.40% CAGR, although discrete devices still command 54.80% of shipments.
- ams-OSRAM, Sony Semiconductor Solutions, and STMicroelectronics jointly captured 38.00% of 2024 revenue across premium automotive and mobile segments.
Note: Market size and forecast figures in this report are generated using Mordor Intelligence’s proprietary estimation framework, updated with the latest available data and insights as of 2026.
Market Trends and Insights
Drivers Impact Analysis of Light Sensors Market*
| DRIVER | (~) % IMPACT ON CAGR FORECAST | GEOGRAPHIC RELEVANCE | IMPACT TIMELINE |
|---|---|---|---|
| Accelerating Integration of Ambient & Proximity Sensors in OLED Smartphones (Asia) | +1.8% | Asia Pacific, Global spillover | Medium term (2-4 years) |
| Mandatory Daylight-Running & Adaptive Headlamp Regulations Boosting Sensor Demand (Europe) | +1.2% | Europe, North America adoption | Long term (≥ 4 years) |
| ADAS-Driven Camera & LiDAR Light Sensor Uptake (North America) | +2.1% | North America, Global expansion | Medium term (2-4 years) |
| Smart Lighting Codes Driving UV/IR Sensors in Commercial Buildings (Middle East) | +0.7% | Middle East, Asia Pacific | Long term (≥ 4 years) |
| Precision Indoor Farming Requiring PAR & UV Sensors (Nordics & East Asia) | +0.5% | Nordic countries, East Asia | Long term (≥ 4 years) |
| Miniaturized Low-Power CMOS Architectures Enabling Wearables & AR Devices (Global) | +1.4% | Global | Short term (≤ 2 years) |
| Source: Mordor Intelligence | |||
Accelerating Integration of Ambient & Proximity Sensors in OLED Smartphones (Asia)
Behind-display sensing allows phone makers to remove front-panel cut-outs without sacrificing auto-brightness or proximity features. ams-OSRAM’s TCS3701 measures ambient light through OLED pixels and entered mass production in 2024, quickly adopted by leading Chinese and Korean OEMs. Volume adoption accelerates supply-chain investments in ultra-thin optical stacks, reinforcing Asia’s leadership in smartphone engineering.
Mandatory Daylight-Running & Adaptive Headlamp Regulations Boosting Sensor Demand (Europe)
European automotive lighting regulations have created sustained demand for sophisticated light sensors as vehicle manufacturers comply with ECE and NHTSA standards for adaptive headlamp systems. The UN ECE Regulation No. 48 mandates specific lighting functions that require continuous ambient light monitoring to optimize beam patterns and intensity levels. This regulatory framework has driven automotive suppliers to integrate multiple sensor types within single modules, creating opportunities for companies that can deliver integrated solutions combining ambient light detection, proximity sensing, and spectral analysis capabilities. The regulations' emphasis on adaptive functionality has particularly benefited suppliers offering CMOS-integrated sensors that can process multiple light conditions simultaneously while meeting automotive reliability standards. European OEMs have responded by standardizing sensor specifications across model lines, creating volume opportunities for suppliers capable of meeting AEC-Q100 Grade 2 qualification requirements.[1]Publications Office of the European Union, “UN ECE Regulation 48 Revision 11,” eur-lex.europa.eu
ADAS-Driven Camera & LiDAR Light Sensor Uptake (North America)
U.S. proposals to mandate automatic emergency braking amplify demand for wide-dynamic-range image sensors. Sony’s ISX038 simultaneously outputs RAW and YUV streams at 106 dB, simplifying ADAS architecture and supporting Mobileye chipsets. Suppliers with LiDAR-compatible SPAD arrays gain early design-wins in Level-3 automation programs.[2]Sony Semiconductor Solutions, “ISX038 Dual-Output CMOS Image Sensor,” sony-semicon.com
Smart Lighting Codes Driving UV/IR Sensors in Commercial Buildings (Middle East)
Middle Eastern building codes have increasingly mandated intelligent lighting systems that optimize energy consumption while maintaining occupant comfort, creating new applications for UV and infrared sensors in commercial environments. Dubai's Building Code 2021 requires minimum illuminance levels of 150 lux in habitable spaces, driving adoption of sensor-based lighting control systems that can automatically adjust artificial lighting based on natural light availability. This regulatory framework has created opportunities for sensor manufacturers offering integrated solutions that combine ambient light detection with occupancy sensing and spectral analysis capabilities. The region's emphasis on energy efficiency, driven by sustainability initiatives and rising electricity costs, has accelerated adoption of sensor-enabled building automation systems that can reduce lighting energy consumption by 30-50% compared to conventional approaches.
Restraints Impact Analysis of Light Sensors Market*
| RESTRAINTS | (~) % IMPACT ON CAGR FORECAST | GEOGRAPHIC RELEVANCE | IMPACT TIMELINE |
|---|---|---|---|
| Photodiode Linearity Limits Under Low-Illuminance Automotive Cabins | -0.8% | Global, particularly premium automotive | Medium term (2-4 years) |
| Severe Price Erosion from White-Label Chinese Vendors | -1.5% | Global, most acute in consumer electronics | Short term (≤ 2 years) |
| Thermal Crosstalk in Multi-Sensor Smartphone Modules | -0.6% | Asia Pacific, Global smartphone market | Short term (≤ 2 years) |
| EU Regulatory Delays on Public-Space IR Gesture Spectrum Allocation | -0.4% | Europe, limited global impact | Long term (≥ 4 years) |
| Source: Mordor Intelligence | |||
Photodiode Linearity Limits Under Low-Illuminance Automotive Cabins
Photodiode performance degradation in low-illuminance automotive environments has emerged as a technical constraint limiting sensor accuracy in premium vehicle applications where precise ambient light measurement is critical for advanced lighting systems. Research demonstrates that conventional silicon photodiodes exhibit non-linear response characteristics below 10 lux, creating measurement errors that compromise adaptive headlamp performance and interior lighting optimization. This limitation has forced automotive suppliers to implement complex calibration algorithms and multi-sensor architectures to maintain accuracy across the full dynamic range required for vehicle applications. The constraint particularly affects luxury vehicle segments where customers expect seamless lighting transitions and precise color temperature control, creating differentiation challenges for sensor manufacturers unable to deliver consistent low-light performance.
Severe Price Erosion from White-Label Chinese Vendors
Aggressive pricing strategies from Chinese sensor manufacturers have created sustained margin pressure across commodity light sensor categories, particularly in consumer electronics applications where performance differentiation is limited. The competitive intensity has intensified as Chinese suppliers leverage domestic manufacturing scale and government subsidies to offer sensors at prices 40-60% below established Western suppliers, forcing market leaders to reassess their positioning strategies. This pricing pressure has been most acute in ambient light sensor applications for smartphones and tablets, where functional requirements have largely commoditized and buyers prioritize cost optimization over premium features. Established suppliers have responded by focusing on higher-value applications requiring automotive qualification or specialized performance characteristics, while simultaneously investing in manufacturing automation to reduce production costs.
*Our forecasts treat driver/restraint impacts as directional, not additive. The impact forecasts reflect baseline growth, mix effects, and variable interactions.
Light Sensors Market Segment Analysis
By Function:
Gesture Recognition Drives InnovationAmbient detectors retained 34.50% revenue in 2025, confirming their ubiquity in back-light dimming and energy management. Gesture sensors, however, are scaling at 13.50% CAGR on the back of touchless control in healthcare and premium consumer devices. The light sensor market size for gesture modules is projected to reach USD 1.18 billion by 2031, underpinned by dual-axis designs such as Analog Devices’ CN0569. Hospitals prefer contact-free interfaces, and carmakers are adding hand-wave controls to dashboards. In parallel, proximity and RGB sensors remain indispensable for ear-in detection and camera white-balance, ensuring diversified demand streams.
Suppliers combine gesture, ambient, and proximity functions into single die to save board area. This combo design reshapes procurement toward multi-function contracts, boosting switching costs and reinforcing brand loyalty. Precision agriculture fuels UV sensors for PAR tracking, while multispectral detectors capture premium industrial and medical niches where defect detection or tissue characterization commands high ASPs. The light sensor market continues to reward firms that balance high-volume ambient products with specialized gesture and spectral devices.


By Output:
Digital Dominance ContinuesDigital-output devices comprised 59.40% sales in 2025 and are on course for 9.10% CAGR through 2031. Smartphone OEMs view direct I²C or SPI connectivity as essential to shrink BOM count. Advanced on-chip ADCs and histogram engines further tilt preference toward digital. Analog devices persist in time-critical or safety-related domains such as brake-light switching, yet the gap narrows as low-latency digital pipelines emerge.
System integrators prize calibrated lux outputs and built-in flicker detection that digital parts deliver. These traits simplify procurement by moving characterization tasks upstream to the silicon vendor. Conversely, analog parts keep a foothold in heavy-duty machinery and legacy PLC environments. Vendor differentiation increasingly centers on embedded intelligence—noise filtering and automatic gain—rather than raw photodiode performance.
By Technology:
MEMS Emergence Challenges CMOSCMOS processes still account for 67.60% light sensor market share in 2025 thanks to cost-effective wafer reuse and effortless scaling below 90 nm. The approach excels where pixel density or on-chip logic dominates value. Yet MEMS is climbing at 11.10% CAGR, leveraging mechanically resonant structures to achieve unbeatable size-to-performance for AR headsets and biosensing patches.
MEMS shipments will gain from monolithic integration with RF antennas or pressure elements, enabling multi-sensor wearables. CCD and Photo-IC occupy narrow scientific and industrial imaging sub-markets needing sub-electron noise floors. Photodiodes linger in low-cost toys or simple light switches, but their share shrinks as CMOS ASPs drop. Market leaders diversify by fabbing both CMOS and MEMS lines, buffering against process-specific downturns.
By Spectrum:
Infrared Applications AccelerateVisible-band sensors held 56.60% revenue in 2025 driven by display auto-brightness and camera exposure control. Infrared devices, however, are accelerating at 12.20% CAGR as driver-monitoring systems, proximity detectors, and face-unlock modules multiply. Aalto University’s germanium photodiode with 35% higher responsivity at 1.55 µm signals deeper R&D focus on IR efficiency. UV detectors gain traction from disinfection equipment and controlled-environment agriculture, although absolute volumes stay modest.
By Integration Level:
Combo Modules Gain TractionDiscrete parts still dominate shipments at 54.80% because automotive and industry users value replaceability. Yet combo modules—ambient + proximity + RGB within a single package—are expanding at 12.40% CAGR. ams-OSRAM’s in-plane μLED sensing integrates fingerprint, proximity, and ambient detection under display pixels, illustrating the packaging frontier. Combo solutions slash PCB area by up to 40%, a decisive advantage in smartphones and earbuds. Reliability concerns are easing as encapsulation advances cut moisture ingress and thermal mismatch.
By End-Use Industry:
Automotive Momentum BuildsConsumer electronics retained 47.60% revenue in 2025, but its growth slows as smartphone penetration matures. Automotive and transportation is the rising star, moving at 11.80% CAGR on the march toward ADAS and autonomous functions. Each Level-2+ vehicle can embed >15 optical sensors for cabin and exterior perception. Industrial automation leans on multispectral QC, while building automation taps ambient and PIR combos to curb lighting bills. Medical devices seek biocompatible spectrometers for pulse-ox and UV therapy monitoring, whereas precision farming relies on PAR and UV-B indices to tune LED recipes.
Geography Analysis
APAC Light Sensors Market
Asia-Pacific commanded 40.10% revenues in 2025 due to intense smartphone assembly in China, semiconductor leadership in Taiwan, and burgeoning EV production in South Korea. Taiwan produces 63.8% of global semiconductors, granting regional vendors proximity to advanced 5 nm and 3 nm nodes taiwanembassy.org. Chinese suppliers leverage government incentives to enter mid-range ambient sensor tiers, placing pricing pressure on established brands.
North America Light Sensors Market
North America’s growth outlook brightens as automakers re-tool plants for electrification and Level-3 autonomy. U.S. CHIPS and Science Act allocates USD 52.7 billion to domestic foundries, potentially shortening sensor lead times commerce.gov. Tier-1 suppliers open satellite design centers near Detroit and Austin to secure local content mandates.
Europe and Middle East Light Sensors Market
Europe remains a regulation-driven market; strict lighting and safety codes ensure steady sensor pull-through, though wafer-fab scarcity limits indigenous supply. The EUR 43 billion European Chips Act aims to double the region’s semiconductor share to 20% by 2030 ec.europa.eu. Meanwhile, Middle Eastern smart-city initiatives create pockets of demand for UV/IR detectors within green-building projects. Nordic vertical farms also boost UV-PAR sensor uptake, proving that niche geographies can punch above their size in specialized categories.

Regulatory Landscape
Regulation in the light sensors market is shaped by building energy codes, lighting-control interoperability standards, and vehicle safety requirements that translate into measurable sensor performance and qualification needs. On the building side, ANSI/ASHRAE/IES Standard 90.1-2025 (released May 2026) tightens lighting-control requirements, increasing the value of accurate ambient sensing and reliable digital interfaces in commercial building automation deployments.
Standards and sustainability policy also influence product design and compliance documentation. IEC published IEC 62386-304:2017+AMD1:2024 (April 2024), which specifies requirements for light sensors used as DALI input devices to support interoperable smart-lighting ecosystems. In the EU, Regulation (EU) 2024/1781 (ESPR) established a framework for ecodesign requirements for sustainable products (June 2024), and the European Commission working plan for 2025-2030 schedules updates to ecodesign requirements for light sources and separate control gears for 2029. These updates keep lifecycle and circularity attributes in focus alongside functional performance.
Value Chain Analysis
The value chain spans raw materials (silicon wafers, compound semiconductors for IR/SWIR, optical filters and epoxies), device fabrication (CMOS and MEMS processing in 200 mm/300 mm fabs), and back-end steps such as wafer-level optics, packaging, and calibration before module assembly. Downstream, light sensors are integrated into camera and ToF modules, automotive cabin monitoring systems, smartphones, wearables, industrial vision, and building automation controllers. Distribution is often routed through module makers and broadline/component distributors to support design-in and inventory buffering.
Recent supply-chain moves point to tighter coupling between optics innovation and high-volume manufacturing, along with more co-development between component suppliers and system integrators. STMicroelectronics signed a license agreement with Metalenz in July 2025 to produce metasurface optics within its 300 mm semiconductor fabrication facilities, reflecting a shift toward integrating advanced optics into mainstream fab flows. Partnerships such as GlobalFoundries and Egis Technology (September 2025) for dToF sensors on a 55 nm platform and TriEye with LITEON (August 2025) for VCSEL-powered SWIR sensing solutions connect foundry capabilities, photonics know-how, and East Asian module manufacturing. This alignment targets automotive, robotics, and industrial requirements.
Competitive Landscape
The industry shows moderate concentration. ams-OSRAM, Sony Semiconductor Solutions, and STMicroelectronics together hold 38% of 2024 revenue. These leaders operate captive 200 mm and 300 mm fabs, partner with tier-one module assemblers, and wield deep patent libraries around spectral filtering and wafer-level optics. ams-OSRAM’s EUR 567 million Austrian fab upgrade, subsidized under the European Chips Act, reinforces its status as a key automotive supplier ams.com. Sony sharpens its edge via stacked SPAD arrays that target long-range LiDAR, while STMicroelectronics pools MCU and connectivity IP with Qualcomm to bundle intelligent sensing for IoT gateways qualcomm.com.
Emerging Chinese firms exploit cost advantages, supplying white-label ambient sensors that undercut incumbents by 40-60%. The light sensor market thus bifurcates: high-spec automotive and industrial segments remain profitable, whereas commodity phone sensors witness margin compression. Strategic alliances gain prominence; ST-Qualcomm links sensors to 5G chips, and Viavi’s acquisition of Inertial Labs diversifies into navigation hardware. Suppliers unable to finance CMOS-MEMS roadmap convergence risk relegation to low-margin tiers or exit.
Light Sensors Industry Leaders
ams-OSRAM AG
STMicroelectronics N.V.
Broadcom Inc.
Vishay Intertechnology Inc.
Sharp Corporation
- *Disclaimer: Major Players sorted in no particular order
Light Sensors Market Companies Covered in this Report
- ams-OSRAM AG
- Sharp Corporation
- STMicroelectronics N.V.
- Broadcom Inc.
- Vishay Intertechnology Inc.
- Analog Devices Inc. (Maxim Integrated)
- Apple Inc.
- Elan Microelectronics Corp.
- Everlight Electronics Co., Ltd.
- Samsung Electronics Co., Ltd.
- Sitronix Technology Corporation
- ROHM Co., Ltd.
- Texas Instruments Incorporated
- onsemi Corporation
- Sony Semiconductor Solutions Corporation
- Omron Corporation
- Panasonic Holdings Corporation
- Alps Alpine Co., Ltd.
- Lite-On Technology Corporation
- Melexis NV
- TE Connectivity Ltd.
- Partron Co., Ltd.
- Himax Technologies, Inc.
- Hella GmbH and Co. KGaA
- Murata Manufacturing Co., Ltd.

Market Opportunities and Future Outlook
Automotive and industrial machine perception is the clearest whitespace for differentiated light sensors, where qualification, low-light accuracy, and system-level integration (depth plus vision) support higher ASPs than commoditized ambient sensors in smartphones. The move toward always-on perception shifts demand toward global-shutter image sensors and ToF/SPAD-based depth sensing that can feed edge intelligence pipelines. Supplier strategies increasingly emphasize pairing sensing with processing-ready outputs, rather than selling standalone photodiodes.
Capacity and ecosystem actions also point to where investment is concentrating. Tower Semiconductor announced plans in March 2026 to take full ownership of its 300 mm Fab 7 facility in Japan, targeting a four-fold increase in photonics capacity contingent on subsidy approval from Japan METI. This reinforces the role of 300 mm manufacturing for photonics-integrated devices. On the product side, STMicroelectronics has disclosed shipments of over 3 billion ToF sensors and is emphasizing integrated sensing systems for industrial automation and edge intelligence, expanding opportunity for module suppliers and OEMs seeking standardized, scalable depth and vision building blocks for robots, factory inspection, and smart infrastructure.
Recent Industry Developments in Light Sensors Market
- July 2026: Infineon Technologies completed the acquisition of ams OSRAM's non-optical analog/mixed-signal sensor portfolio for EUR 570 million in cash. The transaction expands Infineon's sensor breadth for automotive and industrial use cases. Portfolio reshaping at this scale can affect long-term supply alignment and design-in roadmaps for OEMs that dual-source sensing functions.
- August 2025: TriEye signed a collaboration with LITEON to develop VCSEL-powered SWIR sensing solutions for automotive, robotics, and industrial inspection, enabling integrated VCSEL and SWIR functionality at scale. The collaboration strengthens the photonics and module ecosystem and supports faster time-to-market for multi-modal sensing packs. It also increases the addressable market for VCSEL-SWIR combinations in automotive, industrial inspection, and robotics.
- April 2024: IEC published IEC 62386-304:2017+AMD1:2024 updating the DALI standard to specify light sensor input requirements and support interoperable smart-lighting ecosystems. The update improves cross-vendor compatibility and supports wider adoption of sensor-enabled lighting controls in commercial facilities. It provides system designers with a common basis for evaluating sensor performance in lighting applications.


Light Sensors Market Report Scope and Research Methodology
Market Definition and Coverage
For this study, the market is the revenue generated from light sensor devices used to detect light level, color, or proximity signals and convert them into electrical outputs for use in electronics, vehicles, and industrial systems.
Scope exclusions: We exclude lighting fixtures, cameras and full imaging modules, and standalone control software unless it is bundled with the sensor device.
Segments Covered in This Report
- By Function
- Ambient Light Sensors
- Proximity Sensors
- RGB Color Sensors
- Gesture Recognition Sensors
- UV Light Sensors
- Infrared Light Sensors
- Multispectral and Spectral Sensors
- By Output
- Digital Output
- Analog Output
- By Technology
- CMOS Integration
- CCD/Photo-IC
- Photodiodes and Phototransistors
- MEMS-based Technologies
- By Spectrum
- Visible Light (390-700 nm)
- Infrared (Greater than 700 nm)
- Ultraviolet (Less than 390 nm)
- By Integration Level
- Stand-Alone Discrete Sensors
- Integrated Combo Sensors and Modules
- By End-use Industry
- Consumer Electronics
- Automotive and Transportation
- Industrial Automation and Robotics
- Smart Home and Building Automation
- Healthcare and Medical Devices
- Agriculture and Environmental Monitoring
- Aerospace and Defense
- Others
- By Geography
- North America
- United States
- Canada
- Mexico
- South America
- Brazil
- Argentina
- Rest of South America
- Europe
- Germany
- United Kingdom
- France
- Italy
- Spain
- Nordics (Sweden, Norway, Denmark, Finland)
- Benelux (Belgium, Netherlands, Luxembourg)
- Middle East
- Saudi Arabia
- United Arab Emirates
- Israel
- Turkey
- Africa
- South Africa
- Nigeria
- Kenya
- Rest of Africa
- Asia-Pacific
- China
- Japan
- India
- South Korea
- ASEAN (Singapore, Malaysia, Thailand, Indonesia, Philippines, Vietnam)
- North America
Data Sources, Market Sizing, and Validation
Desk Research
Desk research started with building a clean fact base on demand drivers and supply realities for light sensors, before we set any pricing or adoption assumptions. We mainly used public sources such as U.S. International Trade Commission trade data, UN Comtrade, OECD macro indicators, and customs and statistics portals from major electronics manufacturing countries to understand shipment momentum and end-market direction.
To anchor technology context and application pull, we also referred to sources such as IEEE and other peer reviewed journals for sensor performance and design trends, WIPO patent publications for innovation intensity, and regulatory or safety references that affect automotive and industrial sensing. Company annual reports, investor presentations, and reputable press were used to cross-check product mix statements and capacity expansion commentary. Where needed, a paid subscription for company financials and patent intelligence was used selectively to fill gaps. These sources are illustrative, and we consulted many additional public references to validate and clarify assumptions.
Primary Interviews and Surveys
Primary interviews and surveys were used to validate how fast ambient light, proximity, and color sensing are being designed into key devices, and how pricing shifts with integration levels and output type. We spoke with a mix of component suppliers, module integrators, OEM engineers, and distributors across APAC, EMEA, and the Americas, so regional build plans and application mix could be reconciled with the desk-based demand signals.
Distribution of primary research fieldwork respondents
| Company type | Respondent position | Region |
|---|---|---|
| Top tier: 31% | CXOs: 12% | APAC: 49% |
| Mid tier: 48% | Functional/Unit leaders: 40% | EMEA: 33% |
| Smaller Players: 21% | Managers: 48% | Americas: 18% |
Market-Sizing & Forecasting
Sizing used a top-down build that starts from the addressable electronics and automotive demand pool, and then reconstructs sensor value by applying adoption rates, average sensors per device, and an ASP ladder by output type. The totals were then corroborated with selective bottom-up approximations, where sampled supplier revenues, channel checks, and ASP times volume math were used to sanity check direction and adjust outliers.
Key model inputs included smartphone and wearable shipment trends, vehicle production and ADAS penetration, industrial automation investment cycles, the mix shift between analog and digital outputs, and typical ASP erosion as sensors get integrated into multifunction packages. Where direct volume signals were patchy, gaps were handled by using proxy series like end device shipments and applying conservative design win ramp curves that were confirmed during interviews. For forecasting, we used scenario analysis with a light multivariate overlay, stressing variables such as end device unit growth and integration-driven ASP changes, then aligning to expert consensus before finalizing the forward view.
Data Validation & Update Cycle
Outputs were checked through triangulation across at least three angles, including demand-side shipment indicators, supply-side capacity or revenue signals, and interview feedback on pricing and mix. Variances were investigated, and assumptions were revisited when the model implied unrealistic sensor content per device or a price curve that did not match market behavior.
Before sign-off, the work goes through step-by-step analyst reviews, followed by selective re-contact with respondents when new contradictions appear. The report is refreshed annually, and interim updates are made when material events occur, such as sudden end-market slowdowns or major technology shifts. Right before delivery, a final pass is done so clients receive the latest updated view.
Mordor Intelligence's Light Sensors Market Size Compared Against Other Published Estimates
Published market sizes for light sensors can look far apart even when they are describing similar device classes, mainly because scope lines and pricing logic are set differently. The table highlights this spread, which is also influenced by the base year chosen, how currency conversion is timed, and whether integration trends are treated as price dilution or value expansion.
Key gaps usually come from whether proximity and gesture sensing are counted as part of light sensors, how bundled sensor modules are treated, and how fast ASP erosion is applied as digital integration rises. The benchmark table shows a lower 2026 value in some sources, and in Mordor Intelligence's model the count is limited to light-sensing devices and related functions listed in-scope, with bundled camera modules and lighting hardware kept outside, which narrows the revenue pool compared with broader optoelectronics tallies.
Benchmark comparison
| Source | Market Size | Gaps in Research Methodology |
|---|---|---|
| Mordor Intelligence | USD 4.39 B (2026) | |
| Global Consultancy A | USD 5.44 B (2026) | Uses a broader device interpretation that can fold in adjacent proximity and gesture modules with higher blended ASPs, and it applies a faster growth path that assumes integration lifts value more than it compresses prices. |
| Industry Publisher B | USD 5.86 B (2026) | Leans on a wider application and module scope across consumer and automotive bundles, with less explicit separation between sensor-only revenue and multi-component assemblies, which tends to inflate the 2026 total. |
Looking across the three figures, the spread is mostly driven by what gets counted as a sensor versus a larger module, and by how ASP decline is paced as devices scale. By keeping inputs tied to observable shipment indicators and interview-checked pricing steps, the model stays transparent and repeatable even when public data is uneven.


Key Questions Answered in the Report
What is the projected size of the light sensor market by 2031?
The light sensor market is forecast to reach USD 6.08 billion by 2031, expanding at a 6.75% CAGR.
Which region currently leads the light sensor market?
Asia-Pacific holds the lead with 40.10% revenue share, driven by smartphone manufacturing and semiconductor fabrication capacity.
Why are automotive applications growing faster than consumer electronics?
Regulatory mandates for adaptive lighting and ADAS features push automakers to integrate more optical detectors, resulting in a 11.80% CAGR for automotive sensors through 2031.
How does MEMS technology influence future growth?
MEMS sensors, growing at 11.10% CAGR, enable ultra-compact modules for wearables and AR by combining mechanical structures with photodiodes on a single die.
Who are the leading companies in the light sensor market?
Ams-OSRAM, Sony Semiconductor Solutions, and STMicroelectronics are the front-runners due to their vertical integration, proprietary IP, and government-backed expansion projects.
What factors could restrain market expansion?
Price erosion from low-cost Chinese vendors, photodiode non-linearity in dim environments, and regulatory delays for gesture-control spectrum in Europe are key headwinds.
Page last updated on:


 Your data is secure and never sold or shared.


