Life Sciences Analytics Market Size and Share
Market Overview
| Study Period | 2020 - 2031 |
|---|---|
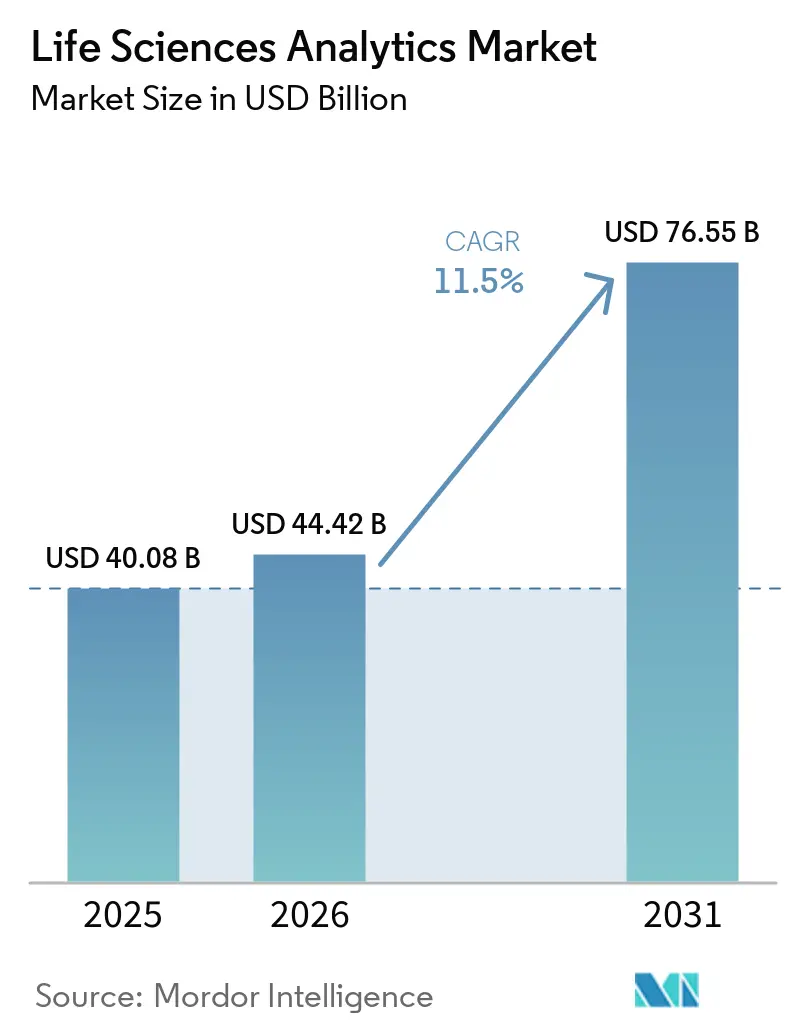
| Market Size (2026) | USD 44.42 Billion |
| Market Size (2031) | USD 76.55 Billion |
| Growth Rate (2026 - 2031) | 11.50% CAGR |
| Fastest Growing Market | Asia Pacific |
| Largest Market | North America |
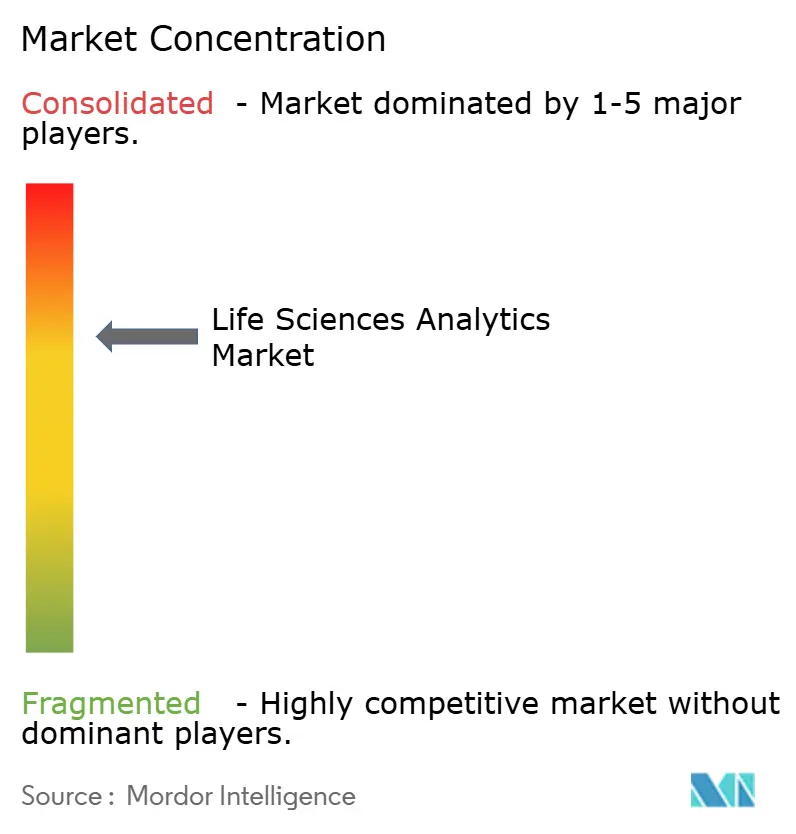
| Market Concentration | Medium |
Major Players*Disclaimer: Major Players sorted in no particular order Image © Mordor Intelligence. Reuse requires attribution under CC BY 4.0. | |
Life Sciences Analytics Market Analysis by Mordor Intelligence
The Life Sciences Analytics Market size is expected to grow from USD 40.08 billion in 2025 to USD 44.42 billion in 2026 and is forecast to reach USD 76.55 billion by 2031 at 11.5% CAGR over 2026-2031.
Current momentum stems from manufacturers replacing retrospective reporting with predictive and prescriptive engines that cut development time and improve post-approval safety monitoring. Regulators are accelerating this shift: the U.S. Food and Drug Administration’s January 2024 real-world-evidence guidance endorses analytics across every development stage. Likewise, the European Medicines Agency’s 2024 adaptive-trial framework favors digital-twin simulations that continuously optimize dose and stratification. Sponsors also respond to payer pressure for value-based reimbursement, sparking investment in the generation of health economics evidence and multichannel commercial insights.
Key Report Takeaways
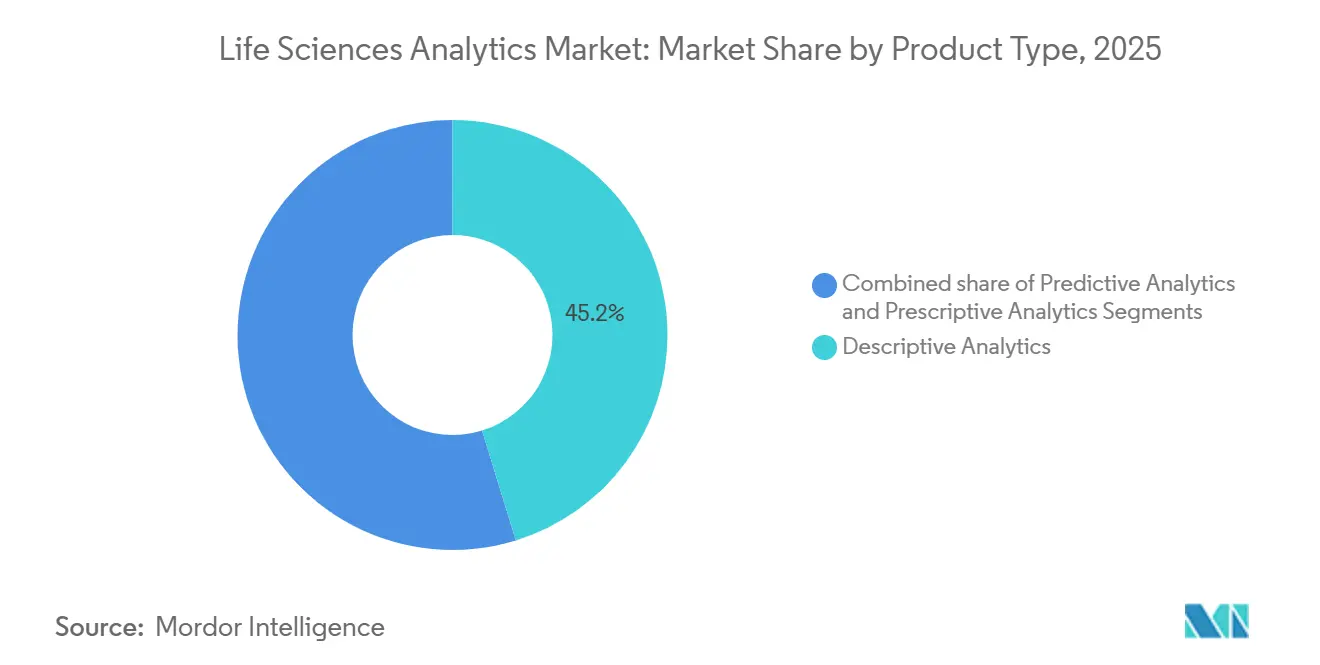
- By product type, descriptive analytics led with 45.23% revenue share in 2025; prescriptive analytics is projected to expand at a 13.56% CAGR through 2031.
- By component, services held 55.32% of the Life science analytics market share in 2025, while software platforms showed the fastest growth at 13.87% from 2026 to 2031.
- By deployment, on-premises systems accounted for 64.80% of the life science analytics market size in 2025; cloud-based models are projected to advance at a 13.65% CAGR through 2031.
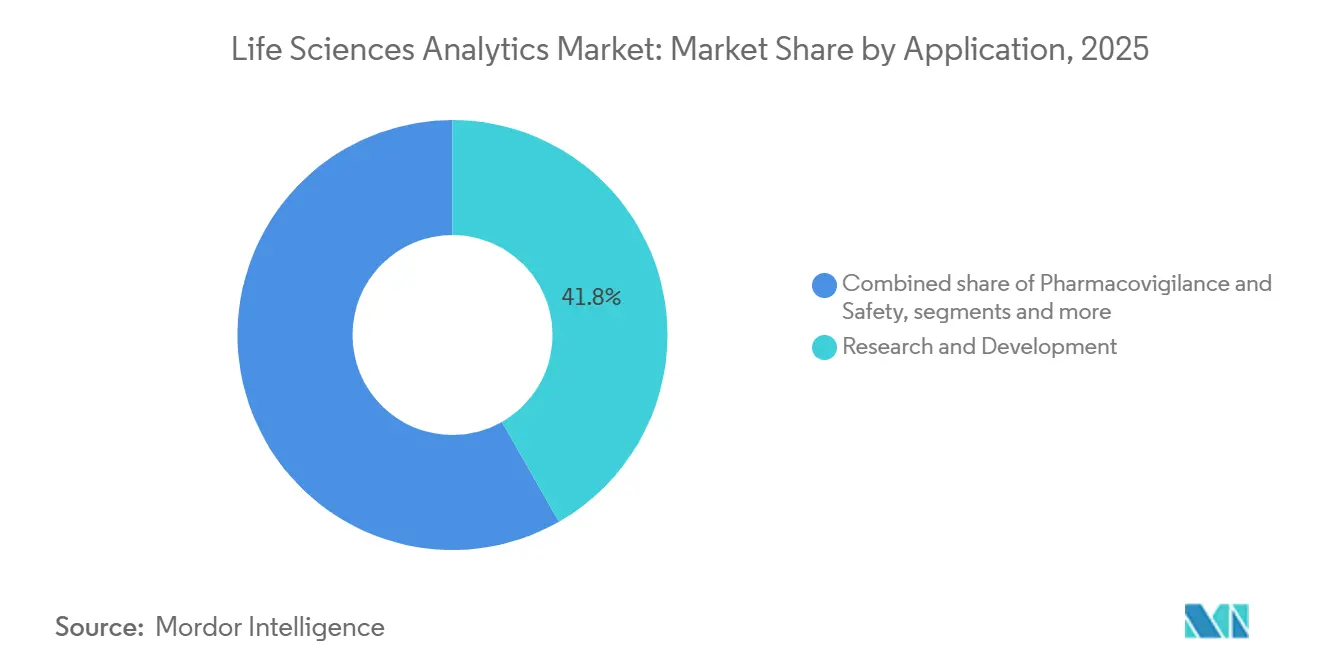
- By application, research & development captured a 41.75% share in 2025, and sales, marketing & market access are growing at a 13.87% CAGR to 2031.
- By end user, pharmaceutical & biotechnology companies controlled 60.20% share in 2025, whereas medical device companies recorded the highest CAGR at 14.54% through 2031.
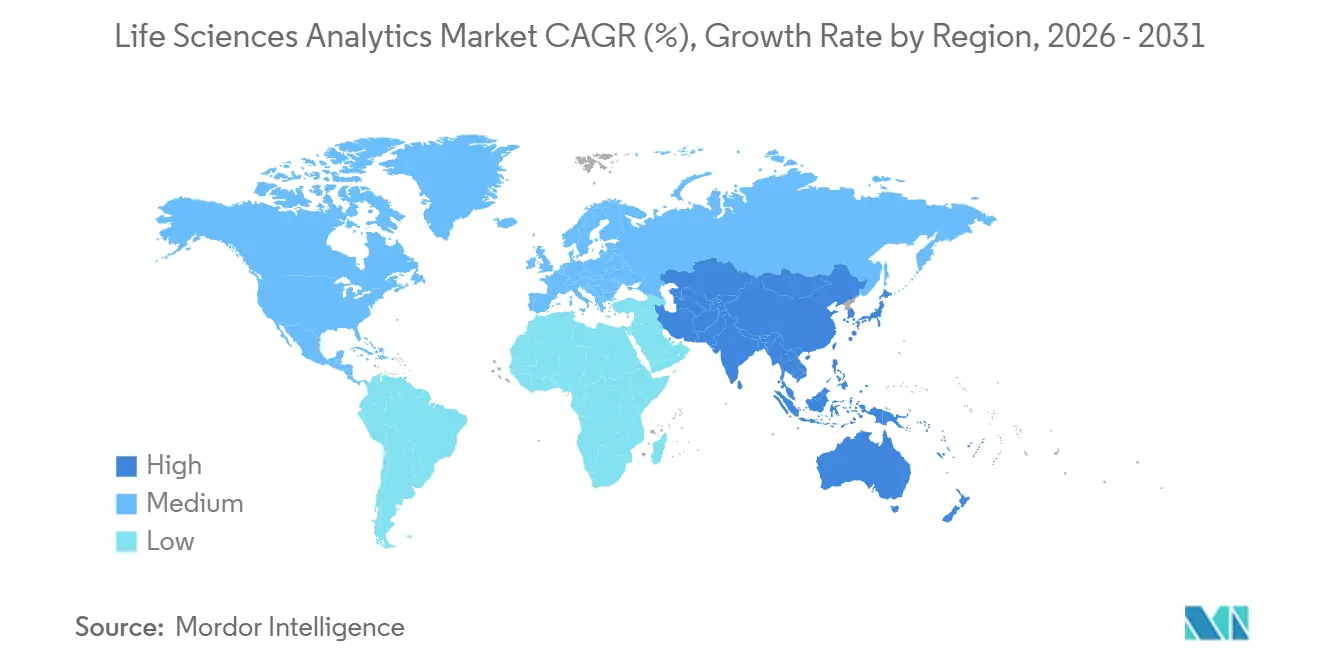
- By geography, North America represented a 41.36% share in 2025, and Asia-Pacific is the fastest-expanding region at a 12.64% CAGR to 2031.
Note: Market size and forecast figures in this report are generated using Mordor Intelligence’s proprietary estimation framework, updated with the latest available data and insights as of January 2026.
Global Life Sciences Analytics Market Trends and Insights
Drivers Impact Analysis*
| Driver | (~) % Impact on CAGR Forecast | Geographic Relevance | Impact Timeline |
|---|---|---|---|
| Exponential Growth of Multimodal Life-Science Data Sets | +2.8% | North America, Europe | Medium term (2-4 years) |
| Strict Regulatory Push for Evidence-Based Drug Lifecycle Management | +2.4% | North America, Europe, Asia-Pacific | Short term (≤ 2 years) |
| Escalating R&D Cost Pressures Encouraging Analytics-Led Efficiency | +2.1% | Global | Medium term (2-4 years) |
| Shift Toward Precision Medicine and Biomarker-Driven Trials | +1.9% | North America, Europe | Long term (≥ 4 years) |
| Rapid Adoption of Federated Learning for Cross-Border Collaboration | +1.5% | Europe, Asia-Pacific | Medium term (2-4 years) |
| Emergence of Real-Time Digital Twins for Adaptive Operations | +1.2% | North America, Europe | Long term (≥ 4 years) |
| Source: Mordor Intelligence | |||


Exponential Growth of Multimodal Life-Science Data Sets
Sequencing, imaging, and wearable-sensor streams now double every 18 months, outpacing on-premise capacity and prompting sponsors to adopt cloud-native analytics that integrate omics and electronic health record feeds. The National Institutes of Health confirmed its All of Us program amassed 10 petabytes of participant data by mid-2025[1]. Single-cell RNA studies, each producing 1 terabyte, are routine in oncology, yet only a minority of firms maintain pipelines to align these files with imaging archives. The velocity challenge is equally daunting because continuous glucose monitors and implantable devices trigger adaptive-dose algorithms that react within minutes. Companies that master multimodal fusion reduce biomarker discovery timelines from years to quarters, whereas laggards face regulatory queries for missing evidence diversity.
Strict Regulatory Push for Evidence-Based Drug Lifecycle Management
The FDA requires ongoing benefit-risk analytics instead of sporadic safety reviews, compelling perpetual ingestion of claims data, EHRs, and patient-reported outcomes. EMA’s adaptive-pathways guidance similarly mandates quarterly effectiveness reports[2]. Large sponsors build in-house observatories, while mid-size firms lean on vendors that compress Sentinel-style surveillance from months to days. Estimand rules in ICH E9(R1) also require statisticians to pre-define analytic scenarios, thereby heightening the demand for prescriptive platforms that automate sensitivity analyses.
Escalating R&D Cost Pressures Encouraging Analytics-Led Efficiency
Bringing a new molecule to market regularly exceeds USD 2 billion, and a single Phase III protocol can surpass USD 50 million. Synthetic control arms, allowed in a 2024 rare-disease approval, trimmed placebo groups by 40%. Vendors embed predictive models into site-selection engines that locate high-prevalence clinics and forecast dropout risk, shortening enrollment cycles. Real-time process-control analytics in manufacturing detect deviations before batch failure, aligning with the FDA’s 2024 update to its process-validation guidance. Integrated analytics across discovery, development, and production yield reported time-to-market cuts of 20%–30% for blockbuster portfolios.
Shift Toward Precision Medicine and Biomarker-Driven Trials
Oncology approvals tied to molecular signatures jumped to 15 in 2024, validating biomarker-selected enrollment. The National Comprehensive Cancer Network guidelines now recommend next-generation sequencing for all advanced non-small cell lung cancer, resulting in over 200,000 annotated profiles. Yet, less than half of community clinics house bioinformatics teams, driving the adoption of cloud-based decision-support systems that match variants to regimens. Rare-disease programs leverage FDA enrichment guidance to exclude non-responders early, halving sample sizes. Data diversity remains critical; programs such as All of Us prioritize underrepresented cohorts to avoid uneven algorithm performance.
Restraints Impact Analysis*
| Restraint | (~) % Impact on CAGR Forecast | Geographic Relevance | Impact Timeline |
|---|---|---|---|
| Persistent Data Silos and Lack of Interoperability Standards | -1.8% | United States, global | Medium term (2-4 years) |
| Heightened Global Data Privacy Regulations Inflating Compliance Burden | -1.5% | Europe, Asia-Pacific | Short term (≤ 2 years) |
| Limited Validation Frameworks for AI Models in Regulated Environments | -1.1% | North America, Europe | Medium term (2-4 years) |
| Rising Cloud-Compute Costs Hindering Large-Scale Omics Analytics | -0.9% | Global | Short term (≤ 2 years) |
| Source: Mordor Intelligence | |||
Persistent Data Silos and Lack of Interoperability Standards
Fewer than 25% of U.S. hospitals achieved full HL7 FHIR interoperability by the end of 2024 despite the Centers for Medicare & Medicaid Services mandates[3]Centers for Medicare & Medicaid Services, “Interoperability and Patient Access Rule,” CMS.GOV. Fragmented lab codes and custom connectors stretch project timelines fourfold and inflate the total cost of ownership. Academic centers holding rich longitudinal data often resist sharing due to competitive concerns, reinforcing the advantage for firms with existing collaborations.
Heightened Global Data Privacy Regulations Inflating Compliance Burden
The GDPR’s 2024 updates impose fines of up to 4% of global revenue, while the EU Health Data Space requires national-authority clearance for all cross-border transfers, potentially delaying real-time analytics. China’s Personal Information Protection Law similarly mandates onshore hosting, demanding separate analytics stacks. U.S. HIPAA enforcement increased in 2024, underscoring a global rise in compliance spending. Differential-privacy tooling offsets re-identification risk but can reduce model accuracy by 5%–10%, a margin pivotal in narrow-therapeutic-window trials.
*Our forecasts treat driver/restraint impacts as directional, not additive. The impact forecasts reflect baseline growth, mix effects, and variable interactions.
Segment Analysis
By Product Type: Prescriptive Tools Reshape Decision Workflows
Descriptive analytics held 45.23% of the Life science analytics market in 2025. Prescriptive Analytics, supported by the FDA's endorsement of model-informed development, is growing at a 13.56% CAGR and is poised to transform trial-design processes. Predictive Analytics bridges the two by delivering risk scores that inform enrollment and dosing. Vendors respond by integrating all three capabilities in unified suites, easing workflow continuity for statisticians.
Prescriptive adoption still faces a scarcity of clinical data scientists, prompting vendors to release low-code interfaces. Predictive growth relies on expanding real-world data, while Descriptive tools plateau as dashboard infrastructure matures. IQVIA’s 2024 Orchestrated Analytics illustrates platform convergence, enabling users to transition from summary visualizations to in-silico dose optimization within a single session.


By Component: Platforms Gain as Pre-Trained Models Reduce Customization
Services controlled 55.32% of spending in 2025 due to the complexity of legacy integration. Software Platforms are advancing at a 13.87% CAGR as vendors pre-train algorithms and embed industry-specific templates, reducing deployment time from half a year to six weeks. Large firms select platforms for flexibility, whereas mid-size sponsors keep services for outsourced expertise in protocol design and regulatory interpretation.
Global consultancies acquire specialist boutiques to deliver strategy-through-operations offerings. Meanwhile, cloud providers roll out natural-language interfaces, broadening user access beyond statisticians. ISO 13485 quality standards prompt platform vendors to invest in change-control rigor, thereby raising barriers to entry for smaller code shops.
By Deployment Mode: Federated Architectures Accelerate Cloud Migration
On-premise installations accounted for 64.80% share in 2025, but Cloud-Based deployments are climbing at a 13.65% CAGR as sponsors embrace federated architectures that keep source data local while sharing encrypted parameters. Azure Confidential Computing safeguards data during processing, addressing lingering security objections. Hybrid topologies persist: latency-sensitive manufacturing analytics remain on-site, while genomics and decentralized trial feeds are routed to cloud elastic compute.
Multi-year reserved instances rival on-premise total cost of ownership, although egress fees remain a surprise line item. Regulatory clarity from the FDA computerized-system validation guidance removes a key adoption hurdle by confirming that cloud controls can satisfy Good Clinical Practice requirements.
By Application: Commercial Analytics Surge as Payers Demand Outcomes Evidence
Research & development represented 41.75% of 2025 revenues; however, Sales, Marketing & Market Access showed the fastest growth at 13.87% CAGR, as value-based contracting demands real-world cost-effectiveness proofs. CMS has expanded outcome-linked reimbursement, and therapeutics backed by rigorous real-world evidence are being added to formularies more quickly, thereby boosting post-launch revenues. Pharmacovigilance continues to grow steadily under Sentinel, but shifts in-house to reduce the 90-day query lag, while supply-chain analytics gain regulatory urgency with continuous process verification mandates.
Commercial analytics now attracts cross-functional teams: market-access strategists simulate budget impact, while sales units apply predictive call planning. Manufacturing analytics remain underexploited despite evidence that they cut batch rejections by nearly one-third, primarily because older plants require substantial sensor retrofits.
By End User: Device Makers Embrace Analytics Under Regulatory Pressure
Pharmaceutical & biotechnology enterprises provided 60.20% of the 2025 demand. Medical Device companies are the fastest-growing group, with a 14.54% CAGR, propelled by the FDA’s Total Product Life Cycle requirements for continuous monitoring of software-as-a-medical-device. Real-time streaming from implantables requires edge analytics with lean power budgets, and AI-enabled imaging tools must demonstrate consistent performance across diverse populations.
Contract research organizations and academic centers—invest to win sponsor projects and monetize longitudinal datasets. CROs embed analytics into site selection and recruitment, positioning as full-service collaborators. Academic hubs package analytics-as-a-service offerings, though patient-consent and ownership debates persist.
Geography Analysis
North America commanded 41.36% of the Life science analytics market in 2025, powered by the FDA’s progressive trial-design guidance and NIH’s 10-petabyte All of Us dataset that fuels algorithm training. The region offers mature EHR penetration and abundant high-performance computing, giving domestic sponsors a head start in deploying multimodal analytics. Federal cloud-security authorizations also accelerate the migration of regulated workloads.
Asia-Pacific records the fastest 12.64% CAGR, reflecting synchronized regulatory moves. China’s National Medical Products Administration aligned its real-world evidence rules with ICH E9(R1) in 2024, allowing sponsors to pool Asian cohorts with Western studies. India’s Digital Health Mission aims for universal EHR coverage by 2027, while Japan’s PMDA introduced submission templates for post-market data, spurring analytics adoption across oncology, metabolic, and rare-disease programs.
Europe posts steady but slower growth due to stricter data-transfer rules. The 2024 EU Health Data Space introduces additional approval steps on top of GDPR, increasing compliance efforts for cloud-based analytics. Nevertheless, strong academic research networks, deep AI talent pools, and access to Horizon Europe funding sustain ongoing investments in the platform. The Middle East and Africa remain nascent; South Africa’s 2024 national repository signals early momentum, but high-performance computing deficits limit omics workloads.

Competitive Landscape
Competition is moderate, with the top five players holding roughly 35% of the combined revenue, leaving ample room for specialist entrants. IQVIA and Veeva leverage proprietary trial networks, embedding themselves in clinical workflows that carry high switching costs. Oracle and SAP extend ERP suites with pharmacovigilance and quality-control modules, courting firms that favor integrated application stacks. Microsoft and IBM promote cloud operating layers open to third-party analytics, attracting data scientists who value composable tooling.
AI-native startups are proliferating, offering narrow but high-value modules - such as adverse-event triage, site selection, or protocol drafting - often at 40% lower prices than incumbents. Patent filings for privacy-preserving analytics, including IBM’s 2024 federated-learning quality-aware aggregation algorithm, have tripled since 2024, signaling that intellectual property around secure collaboration is a growing moat. Hyperscale cloud providers bundle life-science accelerators directly into their infrastructure, intensifying platform warfare and forcing niche vendors to differentiate themselves through domain expertise and regulatory pedigree.
White-space remains in device post-market surveillance, value-based contract analytics, and managed offerings for small biotechs that lack data-science staff. Vendors that combine domain models, secure compute, and turnkey validation frameworks are best positioned to capture these untapped segments.
Life Sciences Analytics Industry Leaders
IQVIA
SAS Institute Inc.
Oracle Corporation
IBM Corporation
Accenture PLC
- *Disclaimer: Major Players sorted in no particular order

Recent Industry Developments
- January 2026: Illumina, Inc. launched Illumina Connected Multiomics, a cloud-based research platform. This new tool enables researchers to analyze and visualize complex multiomic and multimodal biological data efficiently. It aims to streamline data integration, reduce costs, and accelerate discoveries in precision medicine.
- January 2026: Ibex Medical Analytics, one of the leaders in AI-powered pathology, announced a significant expansion of its biopharma division. The company is expanding its platform to include late-stage biomarker development, as well as early translational research, biomarker discovery, and trial efficiency. This move aims to enhance its collaborations and impact across the drug development process.
- November 2025: SAS, a Cary-based analytics company launched SAS Clinical Acceleration, a cloud-based platform for managing and analyzing clinical trial data. Built on SAS Viya, it supports hybrid and decentralized trials, integrating real-world and digital data. The software aims to enhance compliance, traceability, and efficiency in clinical development processes.


Research Methodology Framework and Report Scope
Market Definitions and Key Coverage
Our study defines the life science analytics market as the worldwide revenue generated from software platforms and related professional services that transform clinical, commercial, manufacturing, and real-world data into actionable insights for pharmaceutical, biotechnology, medical-device, and contract research organizations. The universe captures spend linked to descriptive, predictive, and prescriptive analytics that sit on-premise or in the cloud.
Scope Exclusion: Pure-play electronic health record systems, enterprise resource-planning suites, and generic data-warehouse tools not configured for life science workflows remain outside this scope.
Segmentation Overview
- By Product Type
- Descriptive Analytics
- Predictive Analytics
- Prescriptive Analytics
- By Component
- Software Platforms
- Services
- By Deployment Mode
- On-Premise
- Cloud-Based
- By Application
- Research & Development
- Pharmacovigilance & Safety
- Supply-Chain & Manufacturing QA/QC
- Sales, Marketing & Market Access
- Commercial Real-World Evidence / HEOR
- By End User
- Pharmaceutical & Biotechnology Companies
- Medical Device Companies
- Other End Users
- Geography
- North America
- United States
- Canada
- Mexico
- Europe
- Germany
- United Kingdom
- France
- Italy
- Spain
- Rest of Europe
- Asia-Pacific
- China
- Japan
- India
- South Korea
- Australia
- Rest of Asia-Pacific
- Middle-East and Africa
- GCC
- South Africa
- Rest of Middle East and Africa
- South America
- Brazil
- Argentina
- Rest of South America
- North America
Detailed Research Methodology and Data Validation
Primary Research
Mordor analysts interviewed software architects, data-science leads, clinical-operations managers, and procurement heads across North America, Europe, and key Asia-Pacific hubs. These conversations tested secondary-data assumptions on license mix, average selling price shifts, and cloud-migration timelines, ensuring regional nuances and emerging use cases were captured before final triangulation.
Desk Research
We began with publicly available pillars such as US FDA clinical-trial datasets, European Medicines Agency transparency portals, ClinicalTrials.gov enrollment feeds, OECD health-R&D spend tables, and WHO Global Health Expenditure accounts, which together anchor the demand pool. Supplementary indicators were drawn from trade bodies such as PhRMA, EFPIA, and Bio, alongside company 10-Ks, investor decks, patent landscapes via Questel, and shipment insights from Volza to quantify vendor activity and regional adoption patterns. Subscription resources, including D&B Hoovers for firm-level revenues and Dow Jones Factiva for deal news, helped us size vendor clusters and validate growth signals. Numerous additional open-source registries, journals, and conference proceedings were referenced; the sources listed here are illustrative, not exhaustive.
Market-Sizing & Forecasting
A blended top-down and bottom-up approach was applied. We first reconstructed global analytics spend from biopharma R&D outlays, active Phase I-IV trial counts, and estimated analytics penetration by application band. Supplier roll-ups of leading platform providers and sampled service billing rates then cross-checked and calibrated totals. Key variables like the number of new molecular entities filed, average trial data points per patient, cloud-deployment ratios, AI-algorithm adoption rates, and regional currency movements fed a multivariate regression, while scenario analysis captured regulatory or funding shocks. Where granular inputs were sparse (e.g., private vendor revenues), weighted proxy benchmarks filled gaps after expert review.
Data Validation & Update Cycle
Outputs undergo variance screening against historic growth corridors, peer ratios, and macro indicators. Senior reviewers sign off only after anomalies are resolved, and clients receive refreshed numbers annually or sooner when material events trigger a mid-cycle update.
Why Mordor's Life Science Analytics Baseline Commands Reliability
Published figures for this market often diverge because firms select different revenue buckets, normalization currencies, and refresh cadences. Our disciplined scope mapping and annual recalibration narrow such gaps.
Key gap drivers include: some publishers convert end-user spend into constant 2022 dollars, others omit bundled consulting services, and a few project aggressive AI-driven uplifts without cross-checking against actual trial volumes. Mordor's model aligns fiscal-year vendor disclosures with real-world trial and R&D activity, then converts to current-year dollars using IMF exchange tables before forecasting with consensus variable trends.
Benchmark comparison
| Market Size | Anonymized source | Primary gap driver |
|---|---|---|
| USD 39.83 B (2025) | Mordor Intelligence | |
| USD 46.33 B (2025) | Global Consultancy A | Includes adjacent healthcare analytics and counts multi-year framework contracts upfront |
| USD 11.37 B (2025) | Trade Journal B | Excludes services revenue and focuses only on stand-alone software licenses |
In sum, the Mordor baseline balances breadth and precision, linking clearly defined revenue streams to transparent variables that analysts and clients can replicate with publicly verifiable data inputs.


Key Questions Answered in the Report
What is the forecast revenue growth of the life science analytics space through 2031?
The life science analytics market size is projected to rise from USD 44.42 billion in 2026 to USD 76.55 billion by 2031, registering an 11.5% CAGR.
Which segment shows the fastest expansion among product types?
Prescriptive Analytics leads growth with a 13.56% CAGR because regulators favor model-informed designs that optimize trial dosing and enrollment.
Why are cloud-based deployments gaining ground over on-premise systems?
Federated-learning architectures and confidential computing allow cross-border analytics without moving raw data, pushing cloud deployments to a 13.65% CAGR while on-premise share declines.
How are regulatory changes influencing device makers?
FDA's Total Product Life Cycle framework mandates ongoing performance monitoring, driving a 14.54% CAGR for analytics adoption among Medical Device companies.
Which region will grow fastest over the forecast period?
Asia-Pacific is expected to expand at a 12.64% CAGR, supported by China's real-world evidence alignment with ICH E9(R1) and IndiaÕs Digital Health Mission.
What competitive factors shape vendor selection today?
Asia-Pacific is expected to expand at a 12.64% CAGR, supported by China's real-world evidence alignment with ICH E9(R1) and India's Digital Health Mission.
Page last updated on:


