| Study Period | 2017 - 2029 |
| Base Year For Estimation | 2024 |
| Forecast Data Period | 2025 - 2029 |
| Market Size (2025) | USD 52.03 Billion |
| Market Size (2029) | USD 67.39 Billion |
| CAGR (2025 - 2029) | 6.68 % |
| Market Concentration | High |
Major Players*Disclaimer: Major Players sorted in no particular order |

LFP Battery Pack Market Analysis
The LFP Battery Pack Market size is estimated at 52.03 billion USD in 2025, and is expected to reach 67.39 billion USD by 2029, growing at a CAGR of 6.68% during the forecast period (2025-2029).
The LFP battery pack industry is experiencing transformative growth driven by the increasing electrification of transportation globally. Lithium iron phosphate battery technology has emerged as a dominant force, accounting for approximately 60% of battery packs used in vehicles worldwide, highlighting their widespread adoption and industry acceptance. The technology's appeal stems from its unique combination of cost-effectiveness, safety features, and performance characteristics that align with both manufacturer requirements and consumer preferences. Manufacturers are particularly drawn to lithium iron phosphate battery systems due to their lower production costs, extended lifecycle, and superior safety profile compared to alternative chemistries.
The industry landscape is characterized by strategic collaborations and capacity expansions as manufacturers seek to strengthen their market positions. In March 2023, Hyundai formed a significant partnership with CATL to incorporate LFP batteries into their upcoming affordable electric vehicle lineup, demonstrating the growing preference for LFP technology among major automotive manufacturers. Similarly, Ford announced a collaboration with CATL in February 2023, investing $3.5 billion to construct an EV battery plant in Michigan, highlighting the increasing localization of LFP battery production capabilities.
The Asia-Pacific region maintains its position as the epicenter of LFP battery production and innovation, accounting for more than 65% of the world's total battery usage in electric vehicles. This regional dominance is supported by a robust supply chain, advanced manufacturing capabilities, and significant technological expertise. The presence of major manufacturers like CATL, BYD, and LG, combined with supportive government policies and infrastructure development, has created a conducive environment for market growth and technological advancement in the region.
The industry is witnessing a surge in production capacity expansions to meet the escalating demand for lithium iron phosphate batteries. A notable example is the October 2023 announcement by OGO Energy, an Indian battery startup, to expand its LFP battery production capacity to 1 GWh annually. This trend of capacity expansion is not limited to established markets but is increasingly visible in emerging economies, indicating a broader geographical distribution of production capabilities. These developments are accompanied by technological advancements in battery chemistry and manufacturing processes, leading to improved performance metrics and cost efficiencies.
LFP Battery Pack Market Trends
BYD AND TESLA ARE LEADING THE CHARGE IN THE EV MARKET AND SHAPING THE FUTURE
- In 2022, BYD was the market leader in electric vehicle sales and held a share of 13.3%. BYD's leading position can be attributed to several factors. It has been an early and prominent player in the EV industry, with a strong focus on producing electric vehicles and related technologies. The company's early entry into the market allowed it to establish a solid foundation and gain recognition among consumers. BYD has also been actively expanding its operations globally, forging partnerships, and investing in research and development, all of which contribute to its leading position.
- Tesla has been at the forefront of electric vehicle innovation and has played a crucial role in popularizing EVs worldwide. Tesla was a significant player in the EV industry in 2022, with a market share of 12.2%. Tesla's strong brand image, cutting-edge technology, and extensive Supercharger network have contributed to its success.
- Among the other players in the EV market, there are several notable companies that hold significant market shares. BMW's established reputation in the automotive industry, coupled with its commitment to electric mobility through its "BMW i" sub-brand, has contributed to its market presence. Similarly, Volkswagen, which held a market share of 3.9% in 2022, has been actively investing in electric mobility under its "Volkswagen Group" umbrella. These companies, along with others like Mercedes-Benz, Kia, and Hyundai, are recolonizing the EV industry by leveraging their existing brand recognition, introducing compelling electric vehicle models, and investing in technology to enhance the range and performance of their electric offerings.

Understand The Key Trends Shaping This Market
Download PDF
TESLA AND BYD DOMINATED THE BEST-SELLING EV MODELS OF 2022
- The best-selling EV models in 2022 were dominated by two key OEMs: Tesla and BYD. Tesla held a strong market position with two of its models, the Model Y and Model 3, capturing the first and third spots, respectively. The Tesla Model Y was the most popular plug-in electric vehicle, with global unit sales of roughly 771,300 in 2022. That year, deliveries of Tesla's Model 3 and Model Y surpassed 1.2 million, a Y-o-Y increase of 36.77% for Tesla's best-selling models. While two of the five best-selling plug-in electric vehicle (PEV) models were Tesla-branded, the battery electric vehicle manufacturer faced competition from Asian brands in 2022. China-based BYD overtook Tesla as the best-selling PEV brand in 2022, relying on a large offering of plug-in hybrid electric models. Following closely behind the Tesla Model Y, the BYD Song Plus (BEV + PHEV) secured the second spot, with sales reaching 477,090 units. BYD's established presence in the Chinese market, along with its reputation for producing reliable and technologically advanced electric vehicles, likely contributed to the strong sales performance of the Song Plus models.
- The Volkswagen ID.4 stood out among the best-selling EV models as the only European PEV (Plug-in Electric Vehicle) in the top ten. With a sales volume of 174,090 units in 2022, the ID.4 demonstrated Volkswagen's commitment to electric mobility and its growing presence in the EV market.
- Overall, these top-performing EV models from Tesla and BYD, along with other notable contenders like the Wuling Hong Guang MINI EV and Volkswagen ID.4, demonstrate the increasing consumer demand for electric vehicles.

OTHER KEY INDUSTRY TRENDS COVERED IN THE REPORT
- INCREASING GLOBAL DEMAND AND GOVERNMENT SUPPORT PROPELLING ELECTRIC VEHICLE MARKET GROWTH
- EV BATTERY PACK PRICES DECLINED DUE TO ECONOMIES OF SCALE AND TECHNOLOGICAL ADVANCEMENTS, BUT FACED A TEMPORARY INCREASE IN 2022
- THE DECREASING COST OF BATTERIES IS A MAJOR FACTOR IN THE EXPANDING AND MORE ACCESSIBLE GLOBAL EV MARKET
- AUTOMAKERS LAUNCHED NEW ELECTRIC VEHICLE MODELS TO MEET THE INCREASING DEMAND, BOOSTING BATTERY PACK DEMAND WORLDWIDE
- LFP, NMC, NCA, AND NCM BATTERIES ARE LEADING THE WAY, WITH DIFFERENT GEOGRAPHIES SHOWING A PREFERENCE FOR SPECIFIC CHEMISTRIES
- INCREASING GLOBAL DEMAND FOR ELECTRIC VEHICLE BATTERIES AND MATERIALS DRIVEN BY INCREASING ELECTRIFICATION OF VEHICLES, WITH LFP BATTERIES LEADING THE TREND
- INCREASING GLOBAL DEMAND AND TECHNOLOGICAL ADVANCEMENTS DRIVE THE ELECTRIC VEHICLE MARKET AND BATTERY INDUSTRY
Segment Analysis: Body Type
Passenger Car Segment in LFP Battery Pack Market
The passenger car segment dominates the global LFP battery pack market, commanding approximately 89% market share in 2024. This substantial market share is primarily driven by the increasing adoption of electric passenger vehicles across major automotive markets worldwide. The segment's dominance can be attributed to several factors, including the growing consumer preference for electric vehicles, favorable government policies promoting EV adoption, and the inherent advantages of LFP batteries such as lower production costs, enhanced safety features, and longer lifespan. Major automotive manufacturers are increasingly incorporating LFP batteries in their electric passenger vehicle models, particularly in the mid-range and economy segments, where cost-effectiveness plays a crucial role in consumer decision-making.
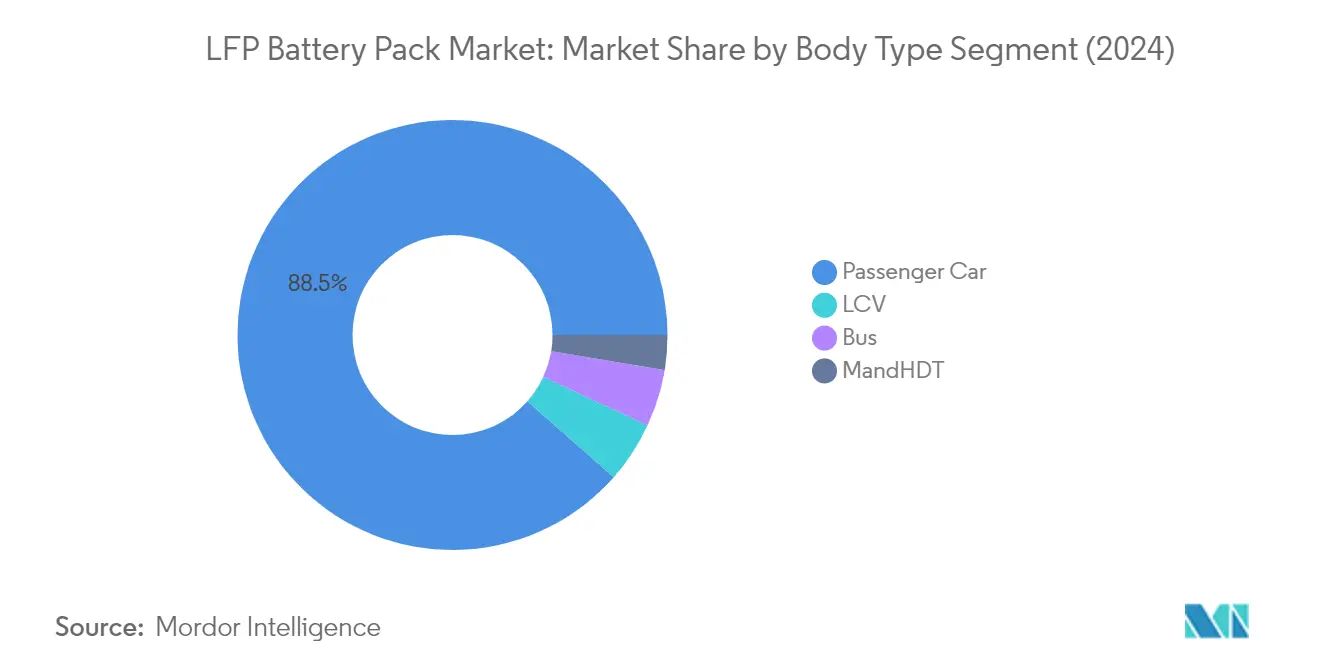
M&HDT Segment in LFP Battery Pack Market
The Medium and Heavy-Duty Truck (M&HDT) segment is emerging as the fastest-growing segment in the LFP battery pack market, with a projected growth rate of approximately 44% during the forecast period 2024-2029. This remarkable growth trajectory is fueled by the increasing emphasis on decarbonizing commercial transportation and logistics operations globally. The segment's rapid expansion is supported by technological advancements in LFP battery technology, making it increasingly suitable for heavy-duty applications. Fleet operators are increasingly recognizing the long-term cost benefits and operational advantages of electric M&HDTs, particularly in terms of lower maintenance costs and reduced environmental impact.
Remaining Segments in Body Type
The Light Commercial Vehicle (LCV) and Bus segments represent significant opportunities in the LFP battery pack market, albeit with smaller market shares. The LCV segment is gaining traction in urban delivery and last-mile logistics applications, where the operational benefits of electric powertrains are particularly advantageous. The Bus segment, while smaller in volume, plays a crucial role in public transportation electrification initiatives, with many cities worldwide transitioning their public transport fleets to electric buses. Both segments benefit from government incentives and environmental regulations promoting commercial vehicle electrification, contributing to the overall market growth.
Segment Analysis: Propulsion Type
BEV Segment in LFP Battery Pack Market
The Battery Electric Vehicles (BEV) segment dominates the global LFP battery pack market, commanding approximately 96% of the total market share in 2024. This substantial market dominance can be attributed to several factors, including the lower cost of LFP battery production, which encourages automakers to use these batteries in BEVs. The segment's growth is further propelled by the long-range capabilities, extended lifespan, and enhanced safety features of LFP batteries in BEVs. Major automotive manufacturers are increasingly adopting LFP batteries for their BEV models, particularly in regions like Asia-Pacific where the demand for affordable BEVs is notably high. The expansion of production facilities by key players like BYD and CATL, coupled with significant investments in research and development, continues to strengthen the BEV segment's position in the global LFP battery pack market.
PHEV Segment in LFP Battery Pack Market
The Plug-in Hybrid Electric Vehicle (PHEV) segment is emerging as the fastest-growing segment in the global LFP battery pack market, with a projected growth rate of approximately 16% from 2024 to 2029. This accelerated growth is driven by the increasing adoption of PHEVs in various regions, particularly in Asian countries like China, Japan, and Thailand. The segment's expansion is supported by the cost-effectiveness of LFP batteries in PHEV applications, making these vehicles more accessible to a broader consumer base. Manufacturers are increasingly incorporating LFP batteries in their PHEV models due to their optimal balance of performance, safety, and cost efficiency. The segment's growth is further bolstered by supportive government policies, rising environmental awareness, and the growing recognition of PHEVs as a practical transition solution towards full electrification.
Segment Analysis: Capacity
40 kWh to 80 kWh Segment in LFP Battery Pack Market
The 40 kWh to 80 kWh segment dominates the global LFP battery pack market, commanding approximately 54% market share in 2024. This significant market position is primarily driven by the increasing adoption of long-range electric vehicles, particularly in Asian markets where consumer preferences strongly favor vehicles with extended driving ranges. The segment's dominance is further reinforced by the optimal balance it offers between performance and cost-effectiveness, making it particularly attractive for passenger vehicles and light commercial vehicles. Major automotive manufacturers are increasingly incorporating batteries within this capacity range into their electric vehicle lineups, recognizing the segment's ability to meet both consumer expectations and regulatory requirements for range and performance.
Above 80 kWh Segment in LFP Battery Pack Market
The above 80 kWh segment is emerging as the fastest-growing segment in the LFP battery pack market, projected to grow at approximately 75% during the forecast period 2024-2029. This remarkable growth is primarily driven by the increasing demand for heavy-duty electric vehicles, particularly electric buses and trucks that require higher battery capacities for extended operational ranges. The segment is benefiting from technological advancements in battery manufacturing processes, which are making high-capacity batteries more cost-effective and efficient. Additionally, government initiatives promoting the electrification of public transportation and commercial vehicle fleets are further accelerating the adoption of high-capacity LFP battery packs in this segment.
Remaining Segments in Capacity Segmentation
The remaining segments in the LFP battery pack market include the less than 15 kWh and 15 kWh to 40 kWh categories, each serving distinct market needs. The less than 15 kWh segment primarily caters to hybrid vehicles, small electric vehicles, and urban mobility solutions, where compact design and cost-effectiveness are prioritized over range. Meanwhile, the 15 kWh to 40 kWh segment serves the mid-range electric vehicle market, particularly popular in urban environments and regions where charging infrastructure is well-developed. These segments continue to play crucial roles in market diversification, offering solutions for different vehicle types and use cases while contributing to the overall growth of the LFP battery pack market.
Segment Analysis: Battery Form
Segment Analysis: Method
Laser Segment in LFP Battery Pack Market
The laser method has emerged as the dominant segment in the global LFP battery pack market, commanding approximately 52% market share in 2024. This method has gained significant traction due to its superior precision and efficiency in battery cell connections, particularly for high-current batteries. The laser technique's popularity stems from its ability to work effectively on both smooth and uneven surfaces, providing good connection quality and extended battery life. The segment is expected to maintain its strong growth trajectory with a projected growth rate of nearly 25% from 2024 to 2029. This remarkable growth is being driven by various factors including the increasing adoption of laser welding in high-power battery pack applications, its ability to provide robust and high-quality connections, and the growing emphasis on battery manufacturing automation. The laser method's advantages in terms of precise control over welding parameters and consistent, reliable connections have made it particularly attractive for large-scale battery production.
Wire Method in LFP Battery Pack Market
The wire method represents a traditional yet reliable approach in the LFP battery pack market, offering manufacturers a cost-effective solution for battery cell connections. This method continues to maintain its significance in the market due to its proven track record in low to medium-power applications and its relatively straightforward implementation process. The wire bonding technique has found particular success in applications where cost considerations are paramount, leveraging its advantages in terms of established manufacturing processes and lower equipment investment requirements. The method's reliability in specific applications, coupled with its adaptability to various wire materials and bonding parameters, ensures its continued relevance in the market. Despite facing competition from newer technologies, the wire method remains an important option for manufacturers, particularly in regions where cost-effectiveness is a primary consideration in battery pack production.
Segment Analysis: Component
Cathode Segment in LFP Battery Pack Market
The cathode segment dominates the global LFP battery pack market, commanding approximately 69% of the total market value in 2024. This significant market share can be attributed to cathodes being the primary determinant of battery performance, range, and thermal safety in LFP batteries. Cathodes comprise around 52% of all LFP battery cell components, making them one of the most expensive and crucial components. The segment's dominance is further strengthened by the increasing demand for high-performance batteries in electric vehicles, particularly in regions like Asia-Pacific where LFP batteries are extensively used. Major manufacturers are focusing on optimizing cathode materials to enhance battery efficiency and reduce production costs, which continues to drive the segment's growth.
Separator Segment in LFP Battery Pack Market
The separator segment is expected to demonstrate the strongest growth in the LFP battery pack market, with a projected growth rate of approximately 6% from 2024 to 2029. This accelerated growth is driven by technological advancements in separator materials and manufacturing processes, which are crucial for enhancing battery safety and performance. The segment's growth is further supported by increasing investments in research and development to improve separator efficiency and durability. Manufacturers are focusing on developing advanced separator technologies that can withstand higher temperatures and provide better thermal stability, which is essential for the safety and longevity of LFP batteries. The growing emphasis on battery safety in electric vehicles and energy storage systems is expected to continue driving innovation and growth in the separator segment.
Remaining Segments in Component Market
The anode and electrolyte segments also play vital roles in the LFP battery pack market, each contributing unique properties to battery performance. The anode segment, typically composed of graphite materials, is crucial for determining the battery's long lifespan and maintaining stability. Meanwhile, the electrolyte segment, which facilitates ion movement between electrodes, is essential for battery functionality and performance. Both segments are experiencing continuous technological improvements and innovations, particularly in materials development and manufacturing processes. These advancements are focused on enhancing battery efficiency, reducing costs, and improving overall performance, making them integral components in the evolving LFP battery ecosystem.
Segment Analysis: Material Type
Natural Graphite Segment in LFP Battery Pack Market
Natural graphite has emerged as the dominant material segment in the global LFP battery pack market, driven by its essential role in anode production and superior electrochemical properties. The material's high conductivity, stability, and cost-effectiveness have made it the preferred choice for battery manufacturers worldwide. Natural graphite's market leadership is further strengthened by its abundant availability and established supply chains across major battery manufacturing regions. The segment's dominance is particularly evident in key markets like China, where major battery manufacturers have scaled up their production capacities significantly. The increasing focus on sustainable and environmentally friendly battery materials has also contributed to natural graphite's market position, as it offers a lower environmental footprint compared to synthetic alternatives.
Manganese Segment in LFP Battery Pack Market
The manganese segment is experiencing remarkable growth in the LFP battery pack market, with projections indicating an impressive growth rate of approximately 20% from 2024 to 2029. This accelerated growth is primarily attributed to manganese's crucial role in enhancing battery performance and stability. The material's ability to improve energy density while maintaining cost-effectiveness has made it increasingly attractive to battery manufacturers. Recent technological advancements in manganese-based battery materials have further accelerated its adoption, particularly in high-performance applications. The segment's growth is also supported by ongoing research and development initiatives focused on optimizing manganese content in battery chemistries to achieve better performance metrics.
Remaining Segments in Material Type
The other significant materials in the LFP battery pack market include lithium, cobalt, and various other supplementary materials, each playing crucial roles in battery performance and functionality. Lithium remains fundamental to the battery chemistry, serving as the primary charge carrier in the electrochemical process. Cobalt, despite environmental and ethical concerns, continues to be valuable for its ability to enhance battery stability and performance. Other materials, including binders, electrolytes, and various additives, contribute to overall battery efficiency and durability. These segments collectively form an integral part of the battery ecosystem, with ongoing innovations in material science driving improvements in battery performance and sustainability.
LFP Battery Pack Market Geography Segment Analysis
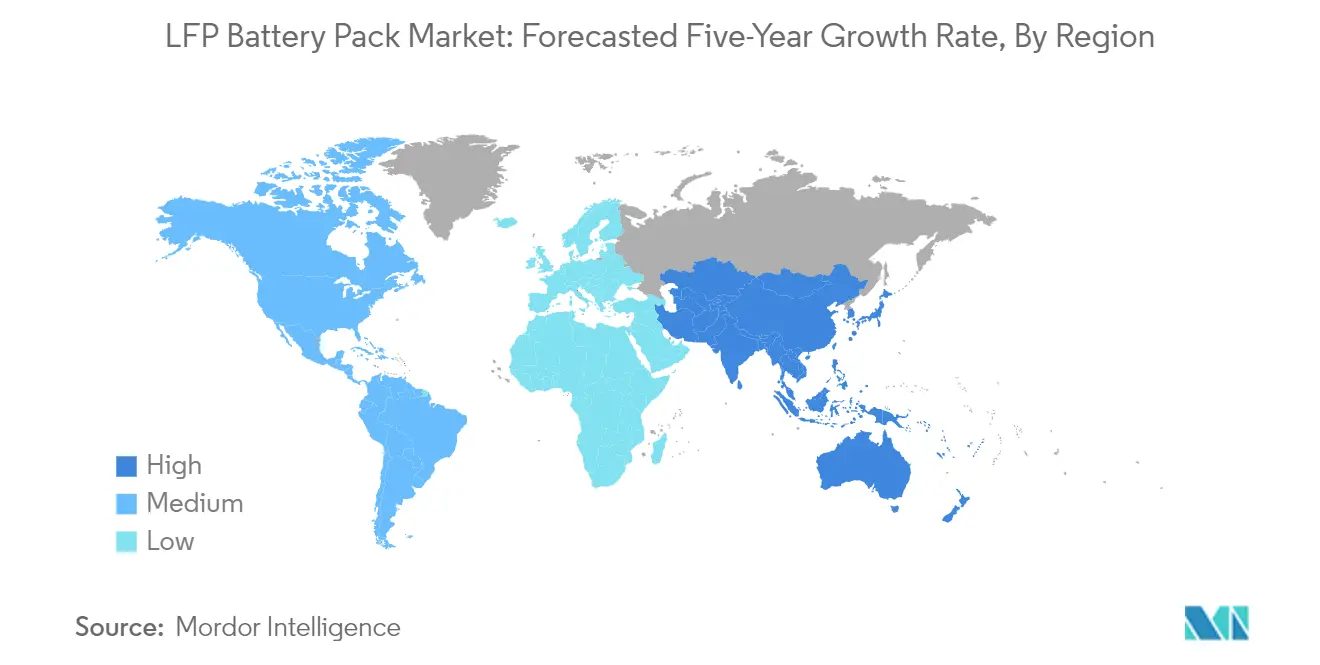
LFP Battery Pack Market in Asia-Pacific
The Asia-Pacific region maintains its position as the dominant force in the global LFP battery pack market, driven by robust electric vehicle adoption rates and significant manufacturing capabilities. Countries like China, Japan, South Korea, India, and Thailand form the backbone of the region's market strength. The region benefits from well-established supply chains, technological expertise, and supportive government policies promoting electric vehicle adoption. Local manufacturers have developed strong capabilities in battery production, while continuous investments in research and development have helped maintain the region's competitive edge.
LFP Battery Pack Market in China
China stands as the undisputed leader in the Asia-Pacific LFP battery pack market, commanding approximately 75% of the regional market share in 2024. The country's dominance is supported by its comprehensive industrial ecosystem, encompassing raw material processing, cell manufacturing, and battery pack assembly. Chinese manufacturers have established themselves as global leaders in lithium iron phosphate battery pack technology, benefiting from economies of scale and extensive research capabilities. The country's robust supply chain infrastructure, coupled with strong government support through subsidies and regulations, has created a favorable environment for market growth. The presence of major battery manufacturers and automotive OEMs has further strengthened China's position in the market.
LFP Battery Pack Market in India
India emerges as the fastest-growing market in the Asia-Pacific region, with a projected growth rate of approximately 89% from 2024 to 2029. The country's rapid market expansion is driven by increasing domestic demand for electric vehicles and growing investments in battery manufacturing capabilities. India's strategic focus on developing its electric vehicle ecosystem, supported by government initiatives and policies, has created a conducive environment for market growth. The country is witnessing significant investments in battery manufacturing facilities, with both domestic and international players establishing production capabilities. The development of charging infrastructure and increasing consumer awareness about electric vehicles are further contributing to market growth, particularly in the electric bus battery pack segment.
LFP Battery Pack Market in Europe
Europe represents a significant market for LFP battery packs, characterized by strong environmental regulations and ambitious electrification targets. The region's market is driven by countries including Germany, France, Hungary, Italy, Poland, Sweden, and the United Kingdom. European automakers are increasingly adopting lithium iron phosphate battery pack technology, particularly for entry-level and mid-range electric vehicles. The region's focus on sustainable transportation and carbon emission reduction has created a favorable environment for market growth, supported by various government initiatives and incentives promoting electric vehicle adoption.
LFP Battery Pack Market in Germany
Germany maintains its position as the largest market for LFP battery packs in Europe, holding approximately 40% of the regional market share in 2024. The country's strong automotive industry, coupled with significant investments in electric vehicle technology and production, has driven market growth. German automakers' increasing focus on electric vehicle production, supported by robust research and development capabilities, has created sustained demand for industrial battery pack solutions. The country's well-developed industrial infrastructure and strong technical expertise have attracted significant investments in battery manufacturing facilities.
LFP Battery Pack Market in Hungary
Hungary emerges as the fastest-growing market in Europe, with a projected growth rate of approximately 40% from 2024 to 2029. The country's strategic location and favorable business environment have attracted significant investments in battery manufacturing facilities. Hungary's growth is driven by increasing domestic production capabilities and its role as a key manufacturing hub for European electric vehicle producers. The country's supportive government policies, including investment incentives and infrastructure development, have created an attractive environment for battery manufacturers and automotive companies, particularly in the renewable energy storage battery sector.
LFP Battery Pack Market in Middle East & Africa
The Middle East & Africa region represents an emerging market for LFP battery packs, characterized by growing awareness of electric mobility and increasing investments in sustainable transportation solutions. The region's market development is driven by government initiatives promoting clean energy adoption and sustainable transportation solutions. While the market is still in its early stages, increasing urbanization and growing environmental consciousness are creating opportunities for market expansion. The region is witnessing gradual development of charging infrastructure and increasing interest from international manufacturers looking to establish a presence in these emerging markets.
LFP Battery Pack Market in North America
The North American market for LFP battery packs demonstrates strong growth potential, driven by increasing electric vehicle adoption and significant investments in domestic battery production capabilities. The United States and Canada are the key markets in this region, with both countries showing commitment to developing robust electric vehicle ecosystems. The region's market is characterized by strong research and development capabilities, technological innovation, and growing consumer acceptance of electric vehicles, particularly in the green energy storage sector.
LFP Battery Pack Market in United States
The United States leads the North American market, accounting for approximately 65% of the regional market share in 2024. The country's market leadership is supported by significant investments in domestic battery manufacturing capabilities and strong government support for electric vehicle adoption. The presence of major automotive manufacturers and technology companies has created a dynamic ecosystem for market growth. The country's focus on reducing dependence on imported batteries has led to increased investments in domestic production facilities, particularly in the green energy storage and renewable energy storage battery sectors.
LFP Battery Pack Market in Canada
Canada emerges as the fastest-growing market in North America, with a projected growth rate of approximately 99% from 2024 to 2029. The country's rapid market expansion is driven by strong government support for electric vehicle adoption and significant investments in battery manufacturing capabilities. Canada's rich natural resources, particularly in battery materials, provide a strong foundation for market growth. The country's focus on developing a comprehensive electric vehicle supply chain, from raw materials to finished products, positions it well for sustained growth.
LFP Battery Pack Market in South America
The South American LFP battery pack market is in its developmental phase, showing increasing potential for growth as countries in the region embrace electric mobility solutions. The market is characterized by growing awareness of environmental sustainability and increasing government initiatives to promote electric vehicle adoption. While the market currently relies significantly on imports, there are emerging opportunities for domestic production capabilities. The region is witnessing gradual development of supporting infrastructure and increasing investments in electric vehicle technology, though market maturity varies significantly across different countries.
Get Analysis on Important Geographic Markets
Download PDF
LFP Battery Pack Industry Overview
Top Companies in LFP Battery Pack Market
The global LFP battery pack market is characterized by intense competition among major players, including CATL, BYD Company, LG Energy Solution, Guoxuan High-tech, and CALB. These companies are actively pursuing product innovation through significant investments in research and development, particularly focusing on improving battery efficiency, energy density, and safety features. Operational agility is demonstrated through rapid capacity expansion projects and the establishment of manufacturing facilities across strategic locations globally. Strategic partnerships with automotive OEMs have become increasingly common, with companies forming joint ventures and collaboration agreements to secure supply chains and enhance market presence. Geographic expansion has been particularly notable in Europe and North America, where companies are establishing new production facilities to meet growing regional demand and comply with local content requirements.
Market Dominated by Asian Manufacturing Giants
The LFP battery pack market exhibits a relatively concentrated structure, with Chinese manufacturers holding dominant positions due to their early market entry and extensive manufacturing capabilities. The market is characterized by a mix of large-scale conglomerates like Samsung SDI and SK Innovation, alongside specialized battery manufacturers such as CATL and BYD. These companies leverage their technological expertise and economies of scale to maintain competitive advantages. The industry has witnessed significant vertical integration, with many players expanding their operations across the value chain, from raw material processing to battery system assembly.
The market has experienced notable consolidation through strategic mergers and acquisitions, particularly as companies seek to strengthen their technological capabilities and expand their geographic footprint. Major players are increasingly forming strategic alliances with automotive manufacturers to secure long-term supply contracts and develop customized battery solutions. The industry also sees collaboration between established players and emerging technology companies, particularly in developing next-generation lithium iron phosphate battery technologies and improving manufacturing processes.
Innovation and Scale Drive Market Success
For incumbent players to maintain and increase their LFP battery market share, continuous investment in research and development remains crucial, particularly in areas such as battery chemistry optimization and manufacturing efficiency. Companies must also focus on securing stable supply chains for critical raw materials through strategic partnerships and vertical integration. Building strong relationships with automotive OEMs through joint development programs and customized solutions has become increasingly important. Additionally, establishing a regional manufacturing presence in key markets helps companies reduce logistics costs and meet local content requirements.
For contenders looking to gain ground in the market, focusing on niche applications and specialized battery system solutions offers a viable entry strategy. Developing innovative manufacturing processes that reduce production costs while maintaining quality standards is essential for competitiveness. Companies must also consider potential regulatory changes, particularly regarding battery recycling and environmental standards, which could impact market dynamics. The risk of substitution from alternative battery technologies necessitates ongoing investment in lithium iron phosphate battery technology advancement and cost reduction. Success in this market increasingly depends on building comprehensive ecosystem partnerships, from raw material suppliers to end-users, while maintaining flexibility to adapt to rapidly evolving market demands.
LFP Battery Pack Market Leaders
-
BYD Company Ltd.
-
China Aviation Battery Co. Ltd. (CALB)
-
Contemporary Amperex Technology Co. Ltd. (CATL)
-
Guoxuan High-tech Co. Ltd.
-
LG Energy Solution Ltd.
- *Disclaimer: Major Players sorted in no particular order

Need More Details on Market Players and Competiters?
Download PDF
Free With This Report
Our comprehensive data set offers over 120 free charts, providing detailed regional and country-level insights into the EV battery pack industry. This includes analyses of distribution and production centers, variations in average selling prices (ASPs) across different regions, and a deep dive into industry trends like demand shifts and technological innovations. We also offer a thorough market segmentation, examining different battery chemistries, capacities, and form factors, alongside an in-depth understanding of market trends such as the adoption of advanced technologies and the impact of environmental regulations. Additionally, we provide an overview of major industry players, a look at the regulatory landscape, and market size analysis in terms of revenue and volume, all culminating in projections and forecasts that consider emerging trends and potential industry shifts.


LFP Battery Pack Market Report - Table of Contents
1. EXECUTIVE SUMMARY & KEY FINDINGS
2. REPORT OFFERS
3. INTRODUCTION
- 3.1 Study Assumptions & Market Definition
- 3.2 Scope of the Study
- 3.3 Research Methodology
4. KEY INDUSTRY TRENDS
- 4.1 Electric Vehicle Sales
- 4.2 Electric Vehicle Sales By OEMs
- 4.3 Best-selling EV Models
- 4.4 OEMs With Preferable Battery Chemistry
- 4.5 Battery Pack Price
- 4.6 Battery Material Cost
- 4.7 Price Chart Of Different Battery Chemistry
- 4.8 Who Supply Whom
- 4.9 EV Battery Capacity And Efficiency
- 4.10 Number Of EV Models Launched
-
4.11 Regulatory Framework
- 4.11.1 Belgium
- 4.11.2 Brazil
- 4.11.3 China
- 4.11.4 Colombia
- 4.11.5 France
- 4.11.6 Germany
- 4.11.7 Hungary
- 4.11.8 India
- 4.11.9 Indonesia
- 4.11.10 Japan
- 4.11.11 Poland
- 4.11.12 Thailand
- 4.11.13 UK
- 4.12 Value Chain & Distribution Channel Analysis
5. MARKET SEGMENTATION (includes market size in Value in USD and Volume, Forecasts up to 2029 and analysis of growth prospects)
-
5.1 Body Type
- 5.1.1 Bus
- 5.1.2 LCV
- 5.1.3 M&HDT
- 5.1.4 Passenger Car
-
5.2 Propulsion Type
- 5.2.1 BEV
- 5.2.2 PHEV
-
5.3 Capacity
- 5.3.1 15 kWh to 40 kWh
- 5.3.2 40 kWh to 80 kWh
- 5.3.3 Above 80 kWh
- 5.3.4 Less than 15 kWh
-
5.4 Battery Form
- 5.4.1 Cylindrical
- 5.4.2 Pouch
- 5.4.3 Prismatic
-
5.5 Method
- 5.5.1 Laser
- 5.5.2 Wire
-
5.6 Component
- 5.6.1 Anode
- 5.6.2 Cathode
- 5.6.3 Electrolyte
- 5.6.4 Separator
-
5.7 Material Type
- 5.7.1 Cobalt
- 5.7.2 Lithium
- 5.7.3 Manganese
- 5.7.4 Natural Graphite
- 5.7.5 Other Materials
-
5.8 Region
- 5.8.1 Asia-Pacific
- 5.8.1.1 By Country
- 5.8.1.1.1 China
- 5.8.1.1.2 India
- 5.8.1.1.3 Japan
- 5.8.1.1.4 South Korea
- 5.8.1.1.5 Thailand
- 5.8.1.1.6 Rest-of-Asia-Pacific
- 5.8.2 Europe
- 5.8.2.1 By Country
- 5.8.2.1.1 France
- 5.8.2.1.2 Germany
- 5.8.2.1.3 Hungary
- 5.8.2.1.4 Italy
- 5.8.2.1.5 Poland
- 5.8.2.1.6 Sweden
- 5.8.2.1.7 UK
- 5.8.2.1.8 Rest-of-Europe
- 5.8.3 Middle East & Africa
- 5.8.4 North America
- 5.8.4.1 By Country
- 5.8.4.1.1 Canada
- 5.8.4.1.2 US
- 5.8.5 South America
6. COMPETITIVE LANDSCAPE
- 6.1 Key Strategic Moves
- 6.2 Market Share Analysis
- 6.3 Company Landscape
-
6.4 Company Profiles
- 6.4.1 BYD Company Ltd.
- 6.4.2 China Aviation Battery Co. Ltd. (CALB)
- 6.4.3 Contemporary Amperex Technology Co. Ltd. (CATL)
- 6.4.4 EVE Energy Co. Ltd.
- 6.4.5 Guoxuan High-tech Co. Ltd.
- 6.4.6 LG Energy Solution Ltd.
- 6.4.7 Panasonic Holdings Corporation
- 6.4.8 Primearth EV Energy Co. Ltd.
- 6.4.9 Samsung SDI Co. Ltd.
- 6.4.10 SK Innovation Co. Ltd.
- 6.4.11 SVOLT Energy Technology Co. Ltd. (SVOLT)
- *List Not Exhaustive
7. KEY STRATEGIC QUESTIONS FOR EV BATTERY PACK CEOS
8. APPENDIX
-
8.1 Global Overview
- 8.1.1 Overview
- 8.1.2 Porter’s Five Forces Framework
- 8.1.3 Global Value Chain Analysis
- 8.1.4 Market Dynamics (DROs)
- 8.2 Sources & References
- 8.3 List of Tables & Figures
- 8.4 Primary Insights
- 8.5 Data Pack
- 8.6 Glossary of Terms
You Can Purchase Parts Of This Report. Check Out Prices For Specific Sections
Get Price Break-up Now
List of Tables & Figures
- Figure 1:
- ELECTRIC VEHICLE SALES, BY BODY TYPE, UNITS, GLOBAL, 2017 - 2029
- Figure 2:
- ELECTRIC VEHICLE SALES, BY MAJOR OEMS, UNITS, GLOBAL, 2023
- Figure 3:
- ELECTRIC VEHICLE SALES, BY MAJOR OEMS, UNITS, GLOBAL, 2023
- Figure 4:
- BEST-SELLING EV MODELS, UNITS, GLOBAL, 2023
- Figure 5:
- OEMS MARKET SHARE BY ELECTRIC VEHICLE BATTERY CHEMISTRY, VOLUME %, GLOBAL, 2023
- Figure 6:
- ELECTRIC VEHICLE BATTERY CELL AND PACK PRICE, USD, GLOBAL, 2017 - 2029
- Figure 7:
- ELECTRIC VEHICLE KEY BATTERY MATERIAL PRICE, BY MATERIAL, USD, GLOBAL, 2017 - 2029
- Figure 8:
- ELECTRIC VEHICLE BATTERY PRICE, BY BATTERY CHEMISTRY, USD, GLOBAL, 2017 - 2029
- Figure 9:
- EV BATTERY PACK CAPACITY AND EFFICIENCY, KM/KWH, GLOBAL, 2023
- Figure 10:
- UPCOMING EV MODELS, BY BODY TYPE, UNITS, GLOBAL, 2023
- Figure 11:
- BREAKDOWN OF LFP BATTERY PACK MARKET, KWH, GLOBAL, 2017 - 2029
- Figure 12:
- BREAKDOWN OF LFP BATTERY PACK MARKET, USD, GLOBAL, 2017 - 2029
- Figure 13:
- BREAKDOWN OF LFP BATTERY PACK MARKET, BY BODY TYPE, KWH, GLOBAL, 2017 - 2029
- Figure 14:
- BREAKDOWN OF LFP BATTERY PACK MARKET, BY BODY TYPE, USD, GLOBAL, 2017 - 2029
- Figure 15:
- BREAKDOWN OF LFP BATTERY PACK MARKET, BODY TYPE, VOLUME SHARE (%), GLOBAL, 2022 & 2029
- Figure 16:
- BREAKDOWN OF LFP BATTERY PACK MARKET, BODY TYPE, VALUE SHARE (%), GLOBAL, 2022 & 2029
- Figure 17:
- BREAKDOWN OF LFP BATTERY PACK MARKET, BY BUS, KWH, GLOBAL, 2017 - 2029
- Figure 18:
- BREAKDOWN OF LFP BATTERY PACK MARKET, BY BUS, USD, GLOBAL, 2017 - 2029
- Figure 19:
- BREAKDOWN OF LFP BATTERY PACK MARKET, PROPULSION TYPE, VALUE SHARE (%), GLOBAL, 2017-2029
- Figure 20:
- BREAKDOWN OF LFP BATTERY PACK MARKET, BY LCV, KWH, GLOBAL, 2017 - 2029
- Figure 21:
- BREAKDOWN OF LFP BATTERY PACK MARKET, BY LCV, USD, GLOBAL, 2017 - 2029
- Figure 22:
- BREAKDOWN OF LFP BATTERY PACK MARKET, PROPULSION TYPE, VALUE SHARE (%), GLOBAL, 2017-2029
- Figure 23:
- BREAKDOWN OF LFP BATTERY PACK MARKET, BY M&HDT, KWH, GLOBAL, 2017 - 2029
- Figure 24:
- BREAKDOWN OF LFP BATTERY PACK MARKET, BY M&HDT, USD, GLOBAL, 2017 - 2029
- Figure 25:
- BREAKDOWN OF LFP BATTERY PACK MARKET, PROPULSION TYPE, VALUE SHARE (%), GLOBAL, 2017-2029
- Figure 26:
- BREAKDOWN OF LFP BATTERY PACK MARKET, BY PASSENGER CAR, KWH, GLOBAL, 2017 - 2029
- Figure 27:
- BREAKDOWN OF LFP BATTERY PACK MARKET, BY PASSENGER CAR, USD, GLOBAL, 2017 - 2029
- Figure 28:
- BREAKDOWN OF LFP BATTERY PACK MARKET, PROPULSION TYPE, VALUE SHARE (%), GLOBAL, 2017-2029
- Figure 29:
- BREAKDOWN OF LFP BATTERY PACK MARKET, BY PROPULSION TYPE, KWH, GLOBAL, 2017 - 2029
- Figure 30:
- BREAKDOWN OF LFP BATTERY PACK MARKET, BY PROPULSION TYPE, USD, GLOBAL, 2017 - 2029
- Figure 31:
- BREAKDOWN OF LFP BATTERY PACK MARKET, PROPULSION TYPE, VOLUME SHARE (%), GLOBAL, 2022 & 2029
- Figure 32:
- BREAKDOWN OF LFP BATTERY PACK MARKET, PROPULSION TYPE, VALUE SHARE (%), GLOBAL, 2022 & 2029
- Figure 33:
- BREAKDOWN OF LFP BATTERY PACK MARKET, BY BEV, KWH, GLOBAL, 2017 - 2029
- Figure 34:
- BREAKDOWN OF LFP BATTERY PACK MARKET, BY BEV, USD, GLOBAL, 2017 - 2029
- Figure 35:
- BREAKDOWN OF LFP BATTERY PACK MARKET, BODY TYPE, VALUE SHARE (%), GLOBAL, 2017-2029
- Figure 36:
- BREAKDOWN OF LFP BATTERY PACK MARKET, BY PHEV, KWH, GLOBAL, 2017 - 2029
- Figure 37:
- BREAKDOWN OF LFP BATTERY PACK MARKET, BY PHEV, USD, GLOBAL, 2017 - 2029
- Figure 38:
- BREAKDOWN OF LFP BATTERY PACK MARKET, BODY TYPE, VALUE SHARE (%), GLOBAL, 2017-2029
- Figure 39:
- BREAKDOWN OF LFP BATTERY PACK MARKET, BY CAPACITY, KWH, GLOBAL, 2017 - 2029
- Figure 40:
- BREAKDOWN OF LFP BATTERY PACK MARKET, BY CAPACITY, USD, GLOBAL, 2017 - 2029
- Figure 41:
- BREAKDOWN OF LFP BATTERY PACK MARKET, CAPACITY, VOLUME SHARE (%), GLOBAL, 2022 & 2029
- Figure 42:
- BREAKDOWN OF LFP BATTERY PACK MARKET, CAPACITY, VALUE SHARE (%), GLOBAL, 2022 & 2029
- Figure 43:
- BREAKDOWN OF LFP BATTERY PACK MARKET, BY 15 KWH TO 40 KWH, KWH, GLOBAL, 2017 - 2029
- Figure 44:
- BREAKDOWN OF LFP BATTERY PACK MARKET, BY 15 KWH TO 40 KWH, USD, GLOBAL, 2017 - 2029
- Figure 45:
- BREAKDOWN OF LFP BATTERY PACK MARKET, BODY TYPE, VALUE SHARE (%), GLOBAL, 2017-2029
- Figure 46:
- BREAKDOWN OF LFP BATTERY PACK MARKET, BY 40 KWH TO 80 KWH, KWH, GLOBAL, 2017 - 2029
- Figure 47:
- BREAKDOWN OF LFP BATTERY PACK MARKET, BY 40 KWH TO 80 KWH, USD, GLOBAL, 2017 - 2029
- Figure 48:
- BREAKDOWN OF LFP BATTERY PACK MARKET, BODY TYPE, VALUE SHARE (%), GLOBAL, 2017-2029
- Figure 49:
- BREAKDOWN OF LFP BATTERY PACK MARKET, BY ABOVE 80 KWH, KWH, GLOBAL, 2017 - 2029
- Figure 50:
- BREAKDOWN OF LFP BATTERY PACK MARKET, BY ABOVE 80 KWH, USD, GLOBAL, 2017 - 2029
- Figure 51:
- BREAKDOWN OF LFP BATTERY PACK MARKET, BODY TYPE, VALUE SHARE (%), GLOBAL, 2017-2029
- Figure 52:
- BREAKDOWN OF LFP BATTERY PACK MARKET, BY LESS THAN 15 KWH, KWH, GLOBAL, 2017 - 2029
- Figure 53:
- BREAKDOWN OF LFP BATTERY PACK MARKET, BY LESS THAN 15 KWH, USD, GLOBAL, 2017 - 2029
- Figure 54:
- BREAKDOWN OF LFP BATTERY PACK MARKET, BODY TYPE, VALUE SHARE (%), GLOBAL, 2017-2029
- Figure 55:
- BREAKDOWN OF LFP BATTERY PACK MARKET, BY BATTERY FORM, KWH, GLOBAL, 2017 - 2029
- Figure 56:
- BREAKDOWN OF LFP BATTERY PACK MARKET, BY BATTERY FORM, USD, GLOBAL, 2017 - 2029
- Figure 57:
- BREAKDOWN OF LFP BATTERY PACK MARKET, BATTERY FORM, VOLUME SHARE (%), GLOBAL, 2022 & 2029
- Figure 58:
- BREAKDOWN OF LFP BATTERY PACK MARKET, BATTERY FORM, VALUE SHARE (%), GLOBAL, 2022 & 2029
- Figure 59:
- BREAKDOWN OF LFP BATTERY PACK MARKET, BY CYLINDRICAL, KWH, GLOBAL, 2017 - 2029
- Figure 60:
- BREAKDOWN OF LFP BATTERY PACK MARKET, BY CYLINDRICAL, USD, GLOBAL, 2017 - 2029
- Figure 61:
- BREAKDOWN OF LFP BATTERY PACK MARKET, BODY TYPE, VALUE SHARE (%), GLOBAL, 2017-2029
- Figure 62:
- BREAKDOWN OF LFP BATTERY PACK MARKET, BY POUCH, KWH, GLOBAL, 2017 - 2029
- Figure 63:
- BREAKDOWN OF LFP BATTERY PACK MARKET, BY POUCH, USD, GLOBAL, 2017 - 2029
- Figure 64:
- BREAKDOWN OF LFP BATTERY PACK MARKET, BODY TYPE, VALUE SHARE (%), GLOBAL, 2017-2029
- Figure 65:
- BREAKDOWN OF LFP BATTERY PACK MARKET, BY PRISMATIC, KWH, GLOBAL, 2017 - 2029
- Figure 66:
- BREAKDOWN OF LFP BATTERY PACK MARKET, BY PRISMATIC, USD, GLOBAL, 2017 - 2029
- Figure 67:
- BREAKDOWN OF LFP BATTERY PACK MARKET, BODY TYPE, VALUE SHARE (%), GLOBAL, 2017-2029
- Figure 68:
- BREAKDOWN OF LFP BATTERY PACK MARKET, BY METHOD, KWH, GLOBAL, 2017 - 2029
- Figure 69:
- BREAKDOWN OF LFP BATTERY PACK MARKET, BY METHOD, USD, GLOBAL, 2017 - 2029
- Figure 70:
- BREAKDOWN OF LFP BATTERY PACK MARKET, METHOD, VOLUME SHARE (%), GLOBAL, 2022 & 2029
- Figure 71:
- BREAKDOWN OF LFP BATTERY PACK MARKET, METHOD, VALUE SHARE (%), GLOBAL, 2022 & 2029
- Figure 72:
- BREAKDOWN OF LFP BATTERY PACK MARKET, BY LASER, KWH, GLOBAL, 2017 - 2029
- Figure 73:
- BREAKDOWN OF LFP BATTERY PACK MARKET, BY LASER, USD, GLOBAL, 2017 - 2029
- Figure 74:
- BREAKDOWN OF LFP BATTERY PACK MARKET, BODY TYPE, VALUE SHARE (%), GLOBAL, 2017-2029
- Figure 75:
- BREAKDOWN OF LFP BATTERY PACK MARKET, BY WIRE, KWH, GLOBAL, 2017 - 2029
- Figure 76:
- BREAKDOWN OF LFP BATTERY PACK MARKET, BY WIRE, USD, GLOBAL, 2017 - 2029
- Figure 77:
- BREAKDOWN OF LFP BATTERY PACK MARKET, BODY TYPE, VALUE SHARE (%), GLOBAL, 2017-2029
- Figure 78:
- BREAKDOWN OF LFP BATTERY PACK MARKET, BY COMPONENT, UNITS, GLOBAL, 2017 - 2029
- Figure 79:
- BREAKDOWN OF LFP BATTERY PACK MARKET, BY COMPONENT, USD, GLOBAL, 2017 - 2029
- Figure 80:
- BREAKDOWN OF LFP BATTERY PACK MARKET, COMPONENT, VOLUME SHARE (%), GLOBAL, 2022 & 2029
- Figure 81:
- BREAKDOWN OF LFP BATTERY PACK MARKET, COMPONENT, VALUE SHARE (%), GLOBAL, 2022 & 2029
- Figure 82:
- BREAKDOWN OF LFP BATTERY PACK MARKET, BY ANODE, UNITS, GLOBAL, 2017 - 2029
- Figure 83:
- BREAKDOWN OF LFP BATTERY PACK MARKET, BY ANODE, USD, GLOBAL, 2017 - 2029
- Figure 84:
- BREAKDOWN OF LFP BATTERY PACK MARKET, BODY TYPE, VALUE SHARE (%), GLOBAL, 2017-2029
- Figure 85:
- BREAKDOWN OF LFP BATTERY PACK MARKET, BY CATHODE, UNITS, GLOBAL, 2017 - 2029
- Figure 86:
- BREAKDOWN OF LFP BATTERY PACK MARKET, BY CATHODE, USD, GLOBAL, 2017 - 2029
- Figure 87:
- BREAKDOWN OF LFP BATTERY PACK MARKET, BODY TYPE, VALUE SHARE (%), GLOBAL, 2017-2029
- Figure 88:
- BREAKDOWN OF LFP BATTERY PACK MARKET, BY ELECTROLYTE, UNITS, GLOBAL, 2017 - 2029
- Figure 89:
- BREAKDOWN OF LFP BATTERY PACK MARKET, BY ELECTROLYTE, USD, GLOBAL, 2017 - 2029
- Figure 90:
- BREAKDOWN OF LFP BATTERY PACK MARKET, BODY TYPE, VALUE SHARE (%), GLOBAL, 2017-2029
- Figure 91:
- BREAKDOWN OF LFP BATTERY PACK MARKET, BY SEPARATOR, UNITS, GLOBAL, 2017 - 2029
- Figure 92:
- BREAKDOWN OF LFP BATTERY PACK MARKET, BY SEPARATOR, USD, GLOBAL, 2017 - 2029
- Figure 93:
- BREAKDOWN OF LFP BATTERY PACK MARKET, BODY TYPE, VALUE SHARE (%), GLOBAL, 2017-2029
- Figure 94:
- BREAKDOWN OF LFP BATTERY PACK MARKET, BY MATERIAL TYPE, KG, GLOBAL, 2017 - 2029
- Figure 95:
- BREAKDOWN OF LFP BATTERY PACK MARKET, BY MATERIAL TYPE, USD, GLOBAL, 2017 - 2029
- Figure 96:
- BREAKDOWN OF LFP BATTERY PACK MARKET, MATERIAL TYPE, VOLUME SHARE (%), GLOBAL, 2022 & 2029
- Figure 97:
- BREAKDOWN OF LFP BATTERY PACK MARKET, MATERIAL TYPE, VALUE SHARE (%), GLOBAL, 2022 & 2029
- Figure 98:
- BREAKDOWN OF LFP BATTERY PACK MARKET, BY COBALT, KG, GLOBAL, 2017 - 2029
- Figure 99:
- BREAKDOWN OF LFP BATTERY PACK MARKET, BY COBALT, USD, GLOBAL, 2017 - 2029
- Figure 100:
- BREAKDOWN OF LFP BATTERY PACK MARKET, BODY TYPE, VALUE SHARE (%), GLOBAL, 2017-2029
- Figure 101:
- BREAKDOWN OF LFP BATTERY PACK MARKET, BY LITHIUM, KG, GLOBAL, 2017 - 2029
- Figure 102:
- BREAKDOWN OF LFP BATTERY PACK MARKET, BY LITHIUM, USD, GLOBAL, 2017 - 2029
- Figure 103:
- BREAKDOWN OF LFP BATTERY PACK MARKET, BODY TYPE, VALUE SHARE (%), GLOBAL, 2017-2029
- Figure 104:
- BREAKDOWN OF LFP BATTERY PACK MARKET, BY MANGANESE, KG, GLOBAL, 2017 - 2029
- Figure 105:
- BREAKDOWN OF LFP BATTERY PACK MARKET, BY MANGANESE, USD, GLOBAL, 2017 - 2029
- Figure 106:
- BREAKDOWN OF LFP BATTERY PACK MARKET, BODY TYPE, VALUE SHARE (%), GLOBAL, 2017-2029
- Figure 107:
- BREAKDOWN OF LFP BATTERY PACK MARKET, BY NATURAL GRAPHITE, KG, GLOBAL, 2017 - 2029
- Figure 108:
- BREAKDOWN OF LFP BATTERY PACK MARKET, BY NATURAL GRAPHITE, USD, GLOBAL, 2017 - 2029
- Figure 109:
- BREAKDOWN OF LFP BATTERY PACK MARKET, BODY TYPE, VALUE SHARE (%), GLOBAL, 2017-2029
- Figure 110:
- BREAKDOWN OF LFP BATTERY PACK MARKET, BY OTHER MATERIALS, KG, GLOBAL, 2017 - 2029
- Figure 111:
- BREAKDOWN OF LFP BATTERY PACK MARKET, BY OTHER MATERIALS, USD, GLOBAL, 2017 - 2029
- Figure 112:
- BREAKDOWN OF LFP BATTERY PACK MARKET, BODY TYPE, VALUE SHARE (%), GLOBAL, 2017-2029
- Figure 113:
- BREAKDOWN OF LFP BATTERY PACK MARKET, BY REGION, KWH, GLOBAL, 2017 - 2029
- Figure 114:
- BREAKDOWN OF LFP BATTERY PACK MARKET, BY REGION, USD, GLOBAL, 2017 - 2029
- Figure 115:
- BREAKDOWN OF LFP BATTERY PACK MARKET, REGION, VOLUME SHARE (%), GLOBAL, 2022 & 2029
- Figure 116:
- BREAKDOWN OF LFP BATTERY PACK MARKET, REGION, VALUE SHARE (%), GLOBAL, 2022 & 2029
- Figure 117:
- BREAKDOWN OF LFP BATTERY PACK MARKET, BY COUNTRY, KWH, GLOBAL, 2017 - 2029
- Figure 118:
- BREAKDOWN OF LFP BATTERY PACK MARKET, BY COUNTRY, USD, GLOBAL, 2017 - 2029
- Figure 119:
- BREAKDOWN OF LFP BATTERY PACK MARKET, COUNTRY, VOLUME SHARE (%), GLOBAL, 2022 & 2029
- Figure 120:
- BREAKDOWN OF LFP BATTERY PACK MARKET, COUNTRY, VALUE SHARE (%), GLOBAL, 2022 & 2029
- Figure 121:
- BREAKDOWN OF LFP BATTERY PACK MARKET, BY CHINA, KWH, GLOBAL, 2017 - 2029
- Figure 122:
- BREAKDOWN OF LFP BATTERY PACK MARKET, BY CHINA, USD, GLOBAL, 2017 - 2029
- Figure 123:
- BREAKDOWN OF LFP BATTERY PACK MARKET, BODY TYPE, VALUE SHARE (%), GLOBAL, 2017-2029
- Figure 124:
- BREAKDOWN OF LFP BATTERY PACK MARKET, BY INDIA, KWH, GLOBAL, 2017 - 2029
- Figure 125:
- BREAKDOWN OF LFP BATTERY PACK MARKET, BY INDIA, USD, GLOBAL, 2017 - 2029
- Figure 126:
- BREAKDOWN OF LFP BATTERY PACK MARKET, BODY TYPE, VALUE SHARE (%), GLOBAL, 2017-2029
- Figure 127:
- BREAKDOWN OF LFP BATTERY PACK MARKET, BY JAPAN, KWH, GLOBAL, 2017 - 2029
- Figure 128:
- BREAKDOWN OF LFP BATTERY PACK MARKET, BY JAPAN, USD, GLOBAL, 2017 - 2029
- Figure 129:
- BREAKDOWN OF LFP BATTERY PACK MARKET, BODY TYPE, VALUE SHARE (%), GLOBAL, 2017-2029
- Figure 130:
- BREAKDOWN OF LFP BATTERY PACK MARKET, BY SOUTH KOREA, KWH, GLOBAL, 2017 - 2029
- Figure 131:
- BREAKDOWN OF LFP BATTERY PACK MARKET, BY SOUTH KOREA, USD, GLOBAL, 2017 - 2029
- Figure 132:
- BREAKDOWN OF LFP BATTERY PACK MARKET, BODY TYPE, VALUE SHARE (%), GLOBAL, 2017-2029
- Figure 133:
- BREAKDOWN OF LFP BATTERY PACK MARKET, BY THAILAND, KWH, GLOBAL, 2017 - 2029
- Figure 134:
- BREAKDOWN OF LFP BATTERY PACK MARKET, BY THAILAND, USD, GLOBAL, 2017 - 2029
- Figure 135:
- BREAKDOWN OF LFP BATTERY PACK MARKET, BODY TYPE, VALUE SHARE (%), GLOBAL, 2017-2029
- Figure 136:
- BREAKDOWN OF LFP BATTERY PACK MARKET, BY REST-OF-ASIA-PACIFIC, KWH, GLOBAL, 2017 - 2029
- Figure 137:
- BREAKDOWN OF LFP BATTERY PACK MARKET, BY REST-OF-ASIA-PACIFIC, USD, GLOBAL, 2017 - 2029
- Figure 138:
- BREAKDOWN OF LFP BATTERY PACK MARKET, BODY TYPE, VALUE SHARE (%), GLOBAL, 2017-2029
- Figure 139:
- BREAKDOWN OF LFP BATTERY PACK MARKET, BY COUNTRY, KWH, GLOBAL, 2017 - 2029
- Figure 140:
- BREAKDOWN OF LFP BATTERY PACK MARKET, BY COUNTRY, USD, GLOBAL, 2017 - 2029
- Figure 141:
- BREAKDOWN OF LFP BATTERY PACK MARKET, COUNTRY, VOLUME SHARE (%), GLOBAL, 2022 & 2029
- Figure 142:
- BREAKDOWN OF LFP BATTERY PACK MARKET, COUNTRY, VALUE SHARE (%), GLOBAL, 2022 & 2029
- Figure 143:
- BREAKDOWN OF LFP BATTERY PACK MARKET, BY FRANCE, KWH, GLOBAL, 2017 - 2029
- Figure 144:
- BREAKDOWN OF LFP BATTERY PACK MARKET, BY FRANCE, USD, GLOBAL, 2017 - 2029
- Figure 145:
- BREAKDOWN OF LFP BATTERY PACK MARKET, BODY TYPE, VALUE SHARE (%), GLOBAL, 2017-2029
- Figure 146:
- BREAKDOWN OF LFP BATTERY PACK MARKET, BY GERMANY, KWH, GLOBAL, 2017 - 2029
- Figure 147:
- BREAKDOWN OF LFP BATTERY PACK MARKET, BY GERMANY, USD, GLOBAL, 2017 - 2029
- Figure 148:
- BREAKDOWN OF LFP BATTERY PACK MARKET, BODY TYPE, VALUE SHARE (%), GLOBAL, 2017-2029
- Figure 149:
- BREAKDOWN OF LFP BATTERY PACK MARKET, BY HUNGARY, KWH, GLOBAL, 2017 - 2029
- Figure 150:
- BREAKDOWN OF LFP BATTERY PACK MARKET, BY HUNGARY, USD, GLOBAL, 2017 - 2029
- Figure 151:
- BREAKDOWN OF LFP BATTERY PACK MARKET, BODY TYPE, VALUE SHARE (%), GLOBAL, 2017-2029
- Figure 152:
- BREAKDOWN OF LFP BATTERY PACK MARKET, BY ITALY, KWH, GLOBAL, 2017 - 2029
- Figure 153:
- BREAKDOWN OF LFP BATTERY PACK MARKET, BY ITALY, USD, GLOBAL, 2017 - 2029
- Figure 154:
- BREAKDOWN OF LFP BATTERY PACK MARKET, BODY TYPE, VALUE SHARE (%), GLOBAL, 2017-2029
- Figure 155:
- BREAKDOWN OF LFP BATTERY PACK MARKET, BY POLAND, KWH, GLOBAL, 2017 - 2029
- Figure 156:
- BREAKDOWN OF LFP BATTERY PACK MARKET, BY POLAND, USD, GLOBAL, 2017 - 2029
- Figure 157:
- BREAKDOWN OF LFP BATTERY PACK MARKET, BODY TYPE, VALUE SHARE (%), GLOBAL, 2017-2029
- Figure 158:
- BREAKDOWN OF LFP BATTERY PACK MARKET, BY SWEDEN, KWH, GLOBAL, 2017 - 2029
- Figure 159:
- BREAKDOWN OF LFP BATTERY PACK MARKET, BY SWEDEN, USD, GLOBAL, 2017 - 2029
- Figure 160:
- BREAKDOWN OF LFP BATTERY PACK MARKET, BODY TYPE, VALUE SHARE (%), GLOBAL, 2017-2029
- Figure 161:
- BREAKDOWN OF LFP BATTERY PACK MARKET, BY UK, KWH, GLOBAL, 2018 - 2029
- Figure 162:
- BREAKDOWN OF LFP BATTERY PACK MARKET, BY UK, USD, GLOBAL, 2018 - 2029
- Figure 163:
- BREAKDOWN OF LFP BATTERY PACK MARKET, BODY TYPE, VALUE SHARE (%), GLOBAL, 2017-2029
- Figure 164:
- BREAKDOWN OF LFP BATTERY PACK MARKET, BY REST-OF-EUROPE, KWH, GLOBAL, 2017 - 2029
- Figure 165:
- BREAKDOWN OF LFP BATTERY PACK MARKET, BY REST-OF-EUROPE, USD, GLOBAL, 2017 - 2029
- Figure 166:
- BREAKDOWN OF LFP BATTERY PACK MARKET, BODY TYPE, VALUE SHARE (%), GLOBAL, 2017-2029
- Figure 167:
- BREAKDOWN OF LFP BATTERY PACK MARKET, BY MIDDLE EAST & AFRICA, KWH, GLOBAL, 2017 - 2029
- Figure 168:
- BREAKDOWN OF LFP BATTERY PACK MARKET, BY MIDDLE EAST & AFRICA, USD, GLOBAL, 2017 - 2029
- Figure 169:
- BREAKDOWN OF LFP BATTERY PACK MARKET, BODY TYPE, VALUE SHARE (%), GLOBAL, 2017-2029
- Figure 170:
- BREAKDOWN OF LFP BATTERY PACK MARKET, BY COUNTRY, KWH, GLOBAL, 2017 - 2029
- Figure 171:
- BREAKDOWN OF LFP BATTERY PACK MARKET, BY COUNTRY, USD, GLOBAL, 2017 - 2029
- Figure 172:
- BREAKDOWN OF LFP BATTERY PACK MARKET, COUNTRY, VOLUME SHARE (%), GLOBAL, 2022 & 2029
- Figure 173:
- BREAKDOWN OF LFP BATTERY PACK MARKET, COUNTRY, VALUE SHARE (%), GLOBAL, 2022 & 2029
- Figure 174:
- BREAKDOWN OF LFP BATTERY PACK MARKET, BY CANADA, KWH, GLOBAL, 2017 - 2029
- Figure 175:
- BREAKDOWN OF LFP BATTERY PACK MARKET, BY CANADA, USD, GLOBAL, 2017 - 2029
- Figure 176:
- BREAKDOWN OF LFP BATTERY PACK MARKET, BODY TYPE, VALUE SHARE (%), GLOBAL, 2017-2029
- Figure 177:
- BREAKDOWN OF LFP BATTERY PACK MARKET, BY US, KWH, GLOBAL, 2017 - 2029
- Figure 178:
- BREAKDOWN OF LFP BATTERY PACK MARKET, BY US, USD, GLOBAL, 2017 - 2029
- Figure 179:
- BREAKDOWN OF LFP BATTERY PACK MARKET, BODY TYPE, VALUE SHARE (%), GLOBAL, 2017-2029
- Figure 180:
- BREAKDOWN OF LFP BATTERY PACK MARKET, BY SOUTH AMERICA, KWH, GLOBAL, 2017 - 2029
- Figure 181:
- BREAKDOWN OF LFP BATTERY PACK MARKET, BY SOUTH AMERICA, USD, GLOBAL, 2017 - 2029
- Figure 182:
- BREAKDOWN OF LFP BATTERY PACK MARKET, BODY TYPE, VALUE SHARE (%), GLOBAL, 2017-2029
- Figure 183:
- LFP BATTERY PACK MARKET, MOST ACTIVE COMPANIES, BY NUMBER OF STRATEGIC MOVES, 2020 - 2022
- Figure 184:
- LFP BATTERY PACK MARKET, MOST ADOPTED STRATEGIES, 2020 - 2022
- Figure 185:
- LFP BATTERY PACK MARKET SHARE(%), BY MAJOR PLAYER REVENUE, 2022
LFP Battery Pack Industry Segmentation
Bus, LCV, M&HDT, Passenger Car are covered as segments by Body Type. BEV, PHEV are covered as segments by Propulsion Type. 15 kWh to 40 kWh, 40 kWh to 80 kWh, Above 80 kWh, Less than 15 kWh are covered as segments by Capacity. Cylindrical, Pouch, Prismatic are covered as segments by Battery Form. Laser, Wire are covered as segments by Method. Anode, Cathode, Electrolyte, Separator are covered as segments by Component. Cobalt, Lithium, Manganese, Natural Graphite are covered as segments by Material Type. Asia-Pacific, Europe, Middle East & Africa, North America, South America are covered as segments by Region.| Body Type | Bus | |||
| LCV | ||||
| M&HDT | ||||
| Passenger Car | ||||
| Propulsion Type | BEV | |||
| PHEV | ||||
| Capacity | 15 kWh to 40 kWh | |||
| 40 kWh to 80 kWh | ||||
| Above 80 kWh | ||||
| Less than 15 kWh | ||||
| Battery Form | Cylindrical | |||
| Pouch | ||||
| Prismatic | ||||
| Method | Laser | |||
| Wire | ||||
| Component | Anode | |||
| Cathode | ||||
| Electrolyte | ||||
| Separator | ||||
| Material Type | Cobalt | |||
| Lithium | ||||
| Manganese | ||||
| Natural Graphite | ||||
| Other Materials | ||||
| Region | Asia-Pacific | By Country | China | |
| India | ||||
| Japan | ||||
| South Korea | ||||
| Thailand | ||||
| Rest-of-Asia-Pacific | ||||
| Europe | By Country | France | ||
| Germany | ||||
| Hungary | ||||
| Italy | ||||
| Poland | ||||
| Sweden | ||||
| UK | ||||
| Rest-of-Europe | ||||
| Middle East & Africa | ||||
| North America | By Country | Canada | ||
| US | ||||
| South America | ||||
Need A Different Region or Segment?
Customize Now
Market Definition
- Battery Chemistry - LFP battery type is considred under the scope of battery chemistry.
- Battery Form - The types of battery forms offered under this segment include Cylindrical, Pouch and Prismatic.
- Body Type - Body types considered under this segment include, passenger cars, LCV (light commercial vehicle), M&HDT (medium & heavy duty trucks)and buses.
- Capacity - Various types of battery capacities inldude under theis segment are 15 kWH to 40 kWH, 40 kWh to 80 kWh, Above 80 kWh and Less than 15 kWh.
- Component - Various components covered under this segment include anode, cathode, electrolyte, separator.
- Material Type - Various material covered under this segment include cobalt, lithium, manganese, natural graphite, other material.
- Method - The types of method covered under this segment include laser and wire.
- Propulsion Type - Propulsion types considered under this segment include BEV (Battery electric vehicles), PHEV (plug-in hybrid electric vehicle).
- ToC Type - ToC 4
- Vehicle Type - Vehicle type considered under this segment include passenger vehicles, and commercial vehicles with various EV powertrains.
| Keyword | Definition |
|---|---|
| Electric vehicle (EV) | A vehicle which uses one or more electric motors for propulsion. Includes cars, buses, and trucks. This term includes all-electric vehicles or battery electric vehicles and plug-in hybrid electric vehicles. |
| PEV | A plug-in electric vehicle is an electric vehicle that can be externally charged and generally includes all electric vehicles as well as plug-electric vehicles as well as plug-in hybrids. |
| Battery-as-a-Service | A business model in which the battery of an EV can be rented from a service provider or swapped with another battery when it runs out of charge |
| Battery Cell | The basic unit of an electric vehicle's battery pack, typically a lithium-ion cell, that stores electrical energy. |
| Module | A subsection of an EV battery pack, consisting of several cells grouped together, often used to facilitate manufacturing and maintenance. |
| Battery Management System (BMS) | An electronic system that manages a rechargeable battery by protecting the battery from operating outside its safe operating area, monitoring its state, calculating secondary data, reporting data, controlling its environment, and balancing it. |
| Energy Density | A measure of how much energy a battery cell can store in a given volume, usually expressed in watt-hours per liter (Wh/L). |
| Power Density | The rate at which energy can be delivered by the battery, often measured in watts per kilogram (W/kg). |
| Cycle Life | The number of complete charge-discharge cycles a battery can perform before its capacity falls under a specified percentage of its original capacity. |
| State of Charge (SOC) | A measurement, expressed as a percentage, that represents the current level of charge in a battery compared to its capacity. |
| State of Health (SOH) | An indicator of the overall condition of a battery, reflecting its current performance compared to when it was new. |
| Thermal Management System | A system designed to maintain optimal operating temperatures for an EV's battery pack, often using cooling or heating methods. |
| Fast Charging | A method of charging an EV battery at a much faster rate than standard charging, typically requiring specialized charging equipment. |
| Regenerative Braking | A system in electric and hybrid vehicles that recovers energy normally lost during braking and stores it in the battery. |
Need More Details on Market Definition?
Ask a Question
Research Methodology
Mordor Intelligence follows a four-step methodology in all its reports.
- Step-1: Identify Key Variables: To build a robust forecasting methodology, the variables and factors identified in Step-1 are tested against available historical market numbers. Through an iterative process, the variables required for market forecast are set and the model is built based on these variables.
- Step-2: Build a Market Model: Market-size estimations for the historical and forecast years have been provided in revenue and volume terms. Market revenue is calculated by multiplying the volume demand with volume-weighted average battery pack price (per kWh). Battery pack price estimation and forecast takes into account various factors affecting ASP, such as inflation rates, market demand shifts, production costs, technological developments, and consumer preferences, providing estimations for both historical data and future trends.
- Step-3: Validate and Finalize: In this important step, all market numbers, variables, and analyst calls are validated through an extensive network of primary research experts from the market studied. The respondents are selected across levels and functions to generate a holistic picture of the market studied.
- Step-4: Research Outputs: Syndicated Reports, Custom Consulting Assignments, Databases & Subscription Platforms

Get More Details On Research Methodology
Download PDF


