
Lentil Market Size and Share
Lentil Market Analysis by Mordor Intelligence
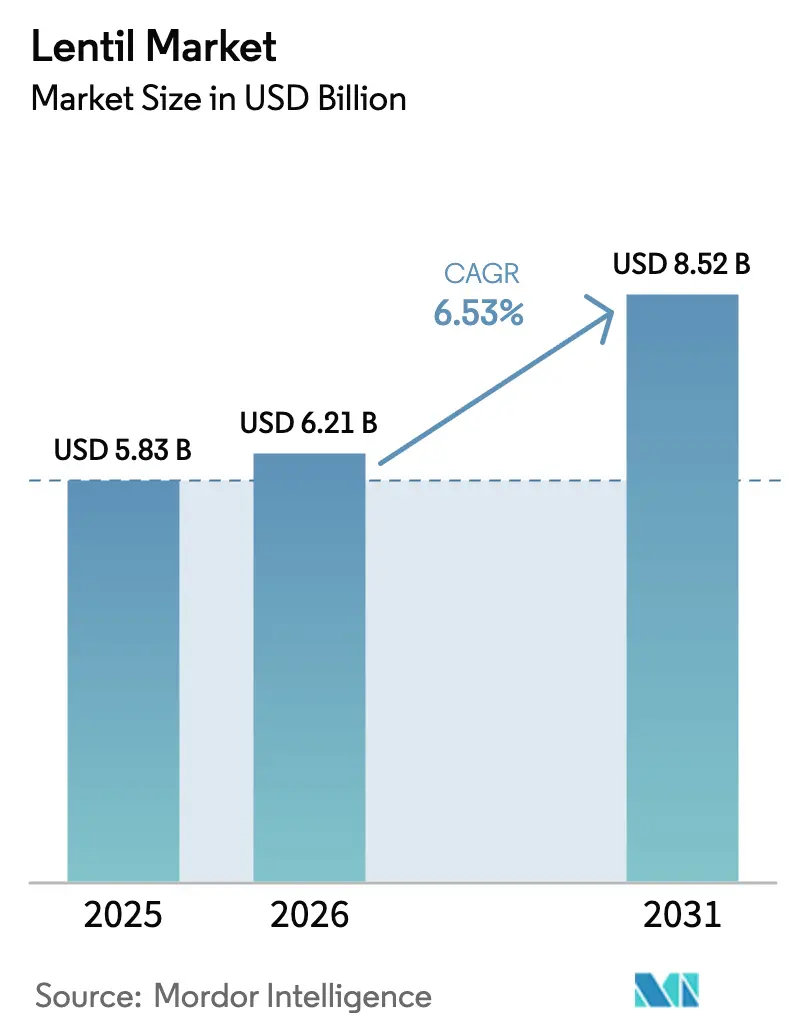
The lentil market size was valued at USD 5.83 billion in 2025 and estimated to grow from USD 6.21 billion in 2026 to reach USD 8.52 billion by 2031, at a CAGR of 6.53% during the forecast period (2026-2031). Flexitarian diets, school feeding mandates, and carbon credit schemes are expanding the customer base across Asia, Africa, and the Middle East, while exporters in Canada and Australia continue to dominate long-haul trade lanes. Government procurement programs in India and Bangladesh are locking in minimum support prices that underpin farmers' margins and stabilize import demand cycles. Optical sorters priced below USD 150,000 are equalizing quality access between large integrators and mid-tier processors, raising the global average No. 1 grade recovery rate to nearly 74%. Concurrently, carbon-credit payments for pulse nitrogen fixation are increasing per-acre returns for rotation-intensive producers in Saskatchewan and South Australia, encouraging the planting of small-seed classes that mature quickly and fit tightly into crop calendars.
Key Report Takeaways
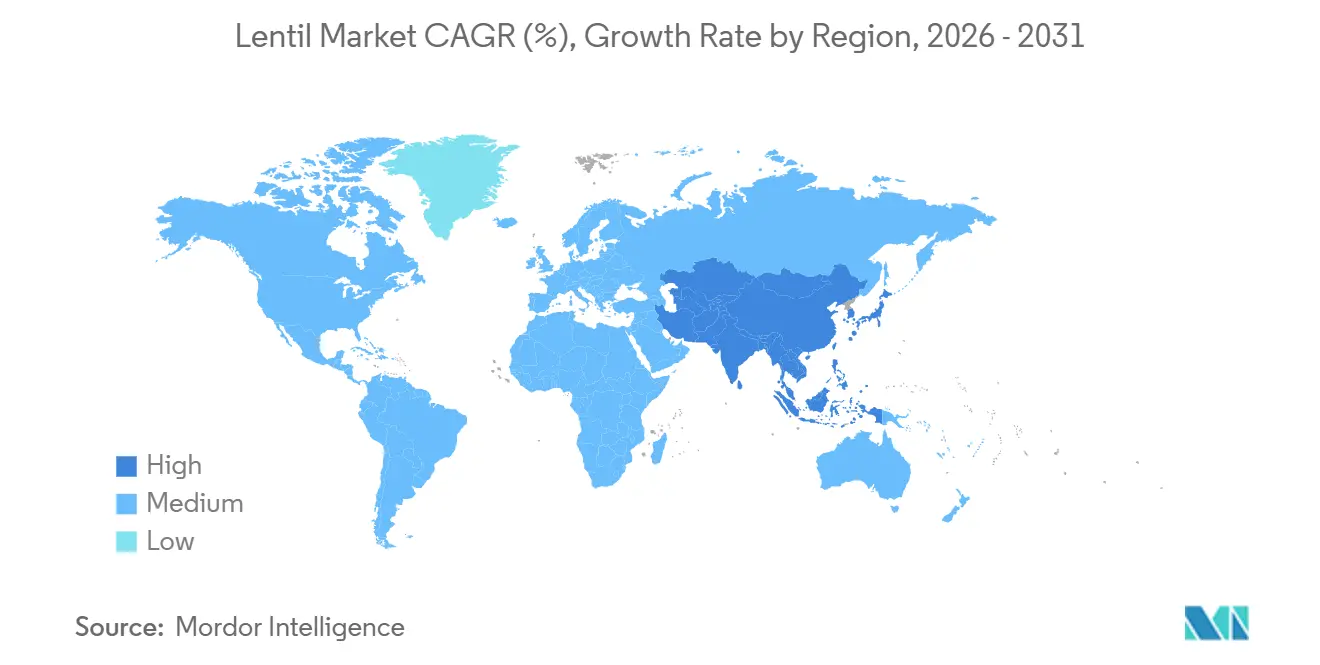
- By geography, Asia-Pacific accounted for 46% of the lentil market size in 2025, while Africa is positioned for the fastest growth at 6.4% CAGR through 2031.
Note: Market size and forecast figures in this report are generated using Mordor Intelligence’s proprietary estimation framework, updated with the latest available data and insights as of January 2026.
Market Trends and Insights
Drivers Impact Analysis of Lentil Market*
| Driver | (~) % Impact on CAGR Forecast | Geographic Relevance | Impact Timeline |
|---|---|---|---|
| Rising demand for plant-based proteins | +1.8% | North America, Europe, and urban Asia-Pacific | Medium term (2-4 years) |
| Government nutrition and food-security programs | +1.5% | Asia, the Middle East, and Sub-Saharan Africa | Long term (≥4 years) |
| Expansion of climate-smart crop-rotation incentives | +1.0% | Canada, United States, Australia, and Europe | Long term (≥4 years) |
| Optical-sorting upgrades boosting premium grade recovery | +0.7% | Canada, Turkey, and India | Short term (≤2 years) |
| Zero-tannin lentils adopted by Asia-Pacific soup makers | +0.5% | China, Japan, and South Korea | Medium term (2-4 years) |
| Carbon-credit payments for pulse nitrogen fixation | +0.6% | Canada, United States, and Australia | Medium term (2-4 years) |
| Source: Mordor Intelligence | |||
Rising Demand for Plant-Based Proteins
Flexitarian diets and meat-reduction campaigns are reshaping protein sourcing across developed and emerging markets, with lentils capturing a share of the market from animal proteins and soy-based alternatives due to their clean-label appeal and culinary versatility. A 2024 survey by the International Food Information Council found that 54% of United States consumers actively reduced meat consumption, citing health, environmental, and cost considerations [1]Source: International Food Information Council, “2024 Food and Health Survey,” ific.org. Lentils deliver 25 to 28% protein by dry weight, comparable to many legumes, yet their faster cooking time and neutral flavor profile make them easier to incorporate into ready-to-eat meals, plant-based burgers, and extruded snacks. Ingredient suppliers are responding with lentil protein isolates and concentrates that offer functional properties (emulsification, water-binding) competitive with pea and faba-bean fractions, opening channels in sports nutrition and dairy-alternative categories. The European Union's 2024 Protein Plan allocated funding to pulse-breeding consortia and processing infrastructure, aiming to reduce reliance on imported soy and align with Farm to Fork sustainability targets.
Government Nutrition and Food-Security Programs
Public procurement schemes and school-feeding initiatives are lifting baseline lentil demand in South Asia, the Middle East, and Sub-Saharan Africa, where governments view pulses as cost-effective protein sources that can be sourced domestically or through preferential trade agreements. India's Mission for Aatmanirbharta in Pulses, launched in October 2025 with a USD 1.37 billion budget, guarantees 100% minimum-support-price procurement for masoor, tur, and urad for four years. The mission targets higher pulse production by 2030-31, aiming to reduce import dependence and stabilize farmer incomes. The United States Department of Agriculture expanded lentil purchases for school meal programs in 2024, citing their nutritional density and alignment with dietary guidelines that recommend increased legume consumption. Bangladesh, Egypt, and Ethiopia have similarly increased pulse allocations in social safety-net programs, often sourcing from Australia and Canada under concessional financing arrangements.
Expansion of Climate-Smart Crop-Rotation Incentives
The agronomic and environmental benefits of pulse crops are driving policy support for lentil integration into cereal-dominant rotations, with carbon-credit schemes and nitrogen-fixation payments providing ancillary revenue streams that enhance farm-gate economics. Lentils fix 72 to 350 kilograms of nitrogen per hectare through symbiotic Rhizobium bacteria, reducing synthetic fertilizer requirements for subsequent wheat or canola crops and lowering greenhouse gas emissions associated with nitrogen production. Saskatchewan Pulse Growers reported that 18% of member farms enrolled in carbon-credit programs during the 2024-25 crop year, up from 9% the prior year, reflecting improved verification protocols and buyer interest from food companies seeking Scope 3 emission reductions. This trend is most pronounced in North America and Australia, where large-scale mechanized farms can absorb the administrative overhead of credit certification, yet adoption remains limited in smallholder systems where fragmented land tenure and weak extension services constrain participation.
Optical-Sorting Upgrades Boosting Premium Grade Recovery
Affordable optical sorters are increasing access to premium-grade recovery, allowing mid-tier processors to compete with larger integrators by efficiently removing discolored seeds, foreign materials, and insect-damaged kernels. Previously, these tasks required manual labor or led to product downgrading. Companies such as Bühler Group, TOMRA, and Key Technology introduced compact optical sorters in 2024 and 2025 priced below USD 150,000, significantly lower than earlier models priced at USD 250,000. This reduction makes the technology accessible for processors managing 5,000 to 10,000 metric tons annually. Indian processors are increasingly adopting this technology, with installations concentrated in Madhya Pradesh and Uttar Pradesh, which together contribute 98% of the country's lentil production. The use of optical sorters diminishes the quality advantage previously held by vertically integrated exporters, shifting the competitive focus to logistics efficiency and financial resource management.
Restraints Impact Analysis of Lentil Market*
| Restraint | (~) % Impact on CAGR Forecast | Geographic Relevance | Impact Timeline |
|---|---|---|---|
| Intensifying pest and disease outbreaks | -0.9% | Canada, United States, India, Australia | Short term (≤2 years) |
| Tariff-driven price volatility in key import hubs | -0.7% | India, Bangladesh, Turkey, United Arab Emirates | Short term (≤2 years) |
| Container shortages at Canadian Pacific ports | -0.4% | Canada with spill-over to Asia-Pacific | Short term (≤2 years) |
| Under-funded varietal R&D for heat tolerance | -0.5% | Sub-Saharan Africa, South Asia, the Middle East | Long term (≥4 years) |
| Source: Mordor Intelligence | |||
Intensifying Pest and Disease Outbreaks
Ascochyta blight and Aphanomyces root rot are increasing production risks and input costs across major lentil-growing regions. Notably, Saskatchewan reported widespread Ascochyta infections during the 2024 growing season, which reduced average yields by 12 to 18% in affected fields. Ascochyta fabae f. sp. lentis thrives in warm, humid conditions and spreads rapidly through wind-borne spores, requiring multiple fungicide applications that add USD 29 to USD 44 (CAD 40 to CAD 60) per acre to production costs. Aphanomyces euteiches persists in soil for over a decade, limiting rotation flexibility and forcing growers to extend intervals between lentil crops from three to five years, which reduces land utilization and complicates crop planning. The United States Department of Agriculture's Animal and Plant Health Inspection Service issued updated monitoring protocols in 2024, emphasizing the importance of early detection and the deployment of resistant varieties. Commercial cultivars with durable resistance remain scarce due to the pathogen's genetic diversity and ability to overcome single-gene resistance [2]Source: United States Department of Agriculture Animal and Plant Health Inspection Service, “Plant Disease Monitoring Protocols,” aphis.usda.gov.
Tariff-Driven Price Volatility in Key Import Hubs
Sudden import-duty adjustments in India and Turkey destabilize grower prices and inventory planning, creating unpredictable demand windows that force Canadian and Australian exporters to carry higher working capital buffers and hedge currency and commodity risks more aggressively. India adjusted pulse import duties multiple times in 2024 and 2025, oscillating between zero and 50%, depending on domestic harvest outcomes and inflation pressures. Masoor (lentil) duties reached 40% in mid-2024 before being reversed to 10% in early 2025. These swings compress import volumes into narrow windows, overwhelming port and inland logistics capacity and creating quality-control bottlenecks that increase rejection rates and demurrage claims. Turkey similarly revised lentil import quotas in 2024, prioritizing bilateral agreements with Russia and Kazakhstan over open-market purchases, which reduced Australian market access and redirected shipments to the United Arab Emirates for re-export at lower netbacks.
*Our forecasts treat driver/restraint impacts as directional, not additive. The impact forecasts reflect baseline growth, mix effects, and variable interactions.
Geography Analysis
APAC Lentil Market
The Asia-Pacific region accounted for 46% of the lentil market size in 2025, with India holding the largest single-country share due to its population of 1.4 billion and dietary traditions centered on dal preparations. India imported 6.6 million metric tons of pulses in 2024, more than double the volume in the prior year, with masoor (lentil) imports exceeding 1.2 million metric tons, as domestic production of 1.6 million metric tons fell short of consumption needs [3]Source: United States Department of Agriculture Foreign Agricultural Service, “Grain and Feed Annual – India,” fas.usda.gov . China and Japan are emerging markets for zero-tannin lentil varieties, with the International Centre for Agricultural Research in the Dry Areas (ICARDA) conducting multi-location trials in both countries to support ready-to-eat soup and noodle applications that require neutral flavor profiles compatible with umami seasoning systems.
Africa Lentil Market
Africa is poised for the fastest growth at a 6.4% CAGR through 2031, led by Ethiopia, Egypt, and Sub-Saharan countries, where population expansion and school-feeding programs are increasing baseline pulse demand. Ethiopia produced an estimated 450,000 metric tons of lentils in 2024, making it the largest producer in Africa; however, domestic consumption absorbed nearly all the output, leaving a minimal surplus for export. Egypt imported lentils primarily from Turkey and Canada, with volumes reaching 120,000 metric tons in 2024, up from 95,000 metric tons in 2023, as government subsidies for bread and legumes kept retail prices affordable for low-income households.
The Americas Lentil Market
North America, led by Canada and the United States, is forecast to grow at a significant rate annually, reflecting mature per-capita consumption and slower population growth, yet the region remains the dominant exporter, with Canada shipping 2.1 million metric tons of lentils in 2024, representing approximately 35% of global trade. The United States produced 320,000 metric tons in 2024, primarily in Montana, North Dakota, and Idaho, with most of the output destined for domestic food service and export to Mexico and Central America. South America is growing with Argentina and Brazil expanding lentil acreage to meet domestic demand and reduce reliance on imports from Canada, yet production remains constrained by limited varietal adaptation to subtropical climates and competition from soybeans and wheat for prime farmland.


Regulatory Landscape
Cross-border lentil trade is shaped by destination-country import controls and origin-country grading and export compliance. In July 2026, Canada updated the Canada Grain Regulations (Table 36) for Red Lentils, a technical change intended to improve grading consistency, which feeds into contract specifications and claim resolution in long-haul export channels governed by Canadian Grain Commission standards.
Market access into South Asia continues to depend on tariff settings and import licensing. Under the Australia-India Economic Cooperation and Trade Agreement (AI-ECTA), lentils are covered by a 150,000-tonne annual tariff rate quota, and Australia updated quota administration arrangements in March 2025 under DAFF to align quota shipments with a reduced MFN-linked tariff. For Bangladesh, importers typically need an Import Registration Certificate (CCI&E) and a Plant Quarantine Permit from the Department of Agricultural Extension, while in the United States, pulse producers can use Farm Service Agency programs such as marketing assistance loans and loan deficiency payments that influence producer marketing behavior.
Value Chain Analysis
The lentil value chain starts with seed selection and agronomy, then moves through primary handling by country elevators or aggregators, followed by cleaning, dehulling/splitting, and grading before bulk export or domestic distribution. Export-oriented origins such as Canada and Australia rely on large-scale processing tied to rail and port logistics, while South Asian markets (notably India) combine high-volume import handling with domestic milling into splits and flours for retail and foodservice. Quality management is increasingly processor-led, with optical sorting and standardized grade tables supporting tighter No. 1 grade specifications and identity-preserved programs.
Downstream, the chain splits between commodity channels (bulk whole and split lentils) and ingredient channels (flours, concentrates, and protein fractions) used in prepared foods. Policy-driven demand windows in India and Turkey, alongside recurring logistics constraints at Canadian Pacific ports, increase working-capital needs for exporters and raise the value of reliable consolidation and shipment scheduling. Company-led infrastructure upgrades, such as CHS Inc. expanding capabilities at its Othello edible-bean facility for improved rail receiving and consolidation, point to how logistics and throughput investments can lower per-ton handling costs and reduce execution risk for export programs.
Competitive Landscape
The lentil market consists of various participants, including producers, importers, and exporters. This structure highlights the commodity nature of farm-gate lentils and the presence of numerous regional processors, country elevators, and export terminals. These entities primarily compete based on logistics efficiency, working capital management, and identity-preserved contracts rather than product differentiation. AGT Food and Ingredients operates processing facilities in Canada, Turkey, and Australia, offering split, dehulled, and whole-lentil formats, as well as protein isolates and flours for diverse ingredient applications.
Smaller Saskatchewan-based processors, such as Simpson Seeds, capitalize on niche premiums by establishing direct relationships with overseas buyers and offering identity-preserved contracts. These contracts ensure attributes such as origin, variety, and non-GMO status, which European organic retailers and importers in the Middle East particularly value. These buyers are willing to pay premiums ranging from USD 50 to USD 100 per metric ton for traceability. Emerging disruptors in the market include regional pulse traders in Turkey and India, who utilize digital platforms to connect smallholder growers directly with export buyers. This approach bypasses traditional intermediaries, allowing these traders to capture margins that were previously absorbed by country elevators and commission agents.
Emerging opportunities and technological advancements present significant opportunities in the commercialization of zero-tannin lentil varietals, the development of heat-tolerant cultivars for regions such as Sub-Saharan Africa and South Asia, and the creation of vertically integrated supply chains that combine carbon-credit certification with premium food-service channels. The International Centre for Agricultural Research in the Dry Areas (ICARDA) introduced two zero-tannin lines in 2024, designed to eliminate the astringent aftertaste and cater to ready-to-eat soup manufacturers in markets like China and Japan. However, seed multiplication and regulatory approvals are projected to delay commercial availability until 2027. Technological advancements are reshaping competitive dynamics within the market. For instance, the adoption of optical sorters has enabled mid-tier processors to achieve premium-grade recovery rates that were previously attainable only by large integrators. This development has narrowed quality gaps and compelled established players to compete on factors such as logistics, speed, and financing terms.
Market Opportunities and Future Outlook
Value-added ingredient manufacturing and functionality-led product development remain a clear whitespace beyond bulk whole and split shipments. Lentil proteins, flours, and extruded ingredients are being pulled into plant-based formulations where emulsification and water-binding performance are decisive, and Canada has been funding this pathway: in March 2026, Protein Industries Canada announced a CAD 3.9 million project with AGT Food and Ingredients and Sweet Nutrition to improve pulse ingredients, leveraging AGT's Regina extrusion facility and Sweet Nutrition's Saskatoon operations.
Product and channel expansion in Asia is another opportunity track, especially for neutral-flavor and convenience formats. ICARDA has been running multi-location trials in China and Japan for zero-tannin lines intended for ready-to-eat soups and noodles, where commercialization depends on seed multiplication and regulatory progression. In parallel, yield and quality gaps in smallholder systems (including Ethiopia and Nepal) create room for scaling improved varieties and integrated nutrient and disease management, particularly where governments are already using procurement programs and school feeding as demand anchors.
Recent Industry Developments in Lentil Market
- July 2026: Canadian regulations were updated to revise the grading factor in the Canada Grain Regulations (Table 36) for Red Lentils, aiming to improve grading consistency. This change tightens alignment between official grades and commercial specifications, supporting smoother dispute resolution and pricing transparency in export contracts.
- March 2026: Protein Industries Canada partnered with AGT Food and Ingredients and Sweet Nutrition on a CAD 3.9 million project to improve pulse-based food ingredients, including lentils, using AGT's Regina extrusion facility and Sweet Nutrition's Saskatoon operations. The initiative strengthens domestic processing capability and supports higher-value ingredient pathways beyond bulk lentil exports.
- August 2024: Louis Dreyfus Company created a new business unit dedicated to pulses merchandising, covering products such as lentils and chickpeas. The move expands origination and trading focus in a category where execution depends on logistics, quality management, and destination-specific demand windows.


Lentil Market Report Scope and Research Methodology
Market Definition and Coverage
For this report, the lentil market is defined as the value of lentils traded and consumed for food uses, captured at the country level and then summed to regional and global totals, using pricing aligned to wholesale market reality.
Scope exclusions: This sizing does not treat lentil-derived ingredients (such as isolates) or processed foods where lentils are only one minor input as part of the core lentil market value.
Segments Covered in This Report
- By Geography
- North America
- United States
- Production Analysis (Area Harvested, Yield, and Production Volume)
- Consumption Analysis (Consumption Value and Volume)
- Import Market Analysis (Import Value, Volume, and Key Supplying Markets)
- Export Market Analysis (Export Value, Volume, and Key Destination Markets)
- Wholesale Price Trend Analysis and Forecast
- Regulatory Framework
- List of Key Players
- Logistics and Infrastructure
- Seasonality Analysis
- Canada
- Production Analysis (Area Harvested, Yield, and Production Volume)
- Consumption Analysis (Consumption Value and Volume)
- Import Market Analysis (Import Value, Volume, and Key Supplying Markets)
- Export Market Analysis (Export Value, Volume, and Key Destination Markets)
- Wholesale Price Trend Analysis and Forecast
- Regulatory Framework
- List of Key Players
- Logistics and Infrastructure
- Seasonality Analysis
- Mexico
- Production Analysis (Area Harvested, Yield, and Production Volume)
- Consumption Analysis (Consumption Value and Volume)
- Import Market Analysis (Import Value, Volume, and Key Supplying Markets)
- Export Market Analysis (Export Value, Volume, and Key Destination Markets)
- Wholesale Price Trend Analysis and Forecast
- Regulatory Framework
- List of Key Players
- Logistics and Infrastructure
- Seasonality Analysis
- United States
- Europe
- France
- Production Analysis (Area Harvested, Yield, and Production Volume)
- Consumption Analysis (Consumption Value and Volume)
- Import Market Analysis (Import Value, Volume, and Key Supplying Markets)
- Export Market Analysis (Export Value, Volume, and Key Destination Markets)
- Wholesale Price Trend Analysis and Forecast
- Regulatory Framework
- List of Key Players
- Logistics and Infrastructure
- Seasonality Analysis
- Germany
- Production Analysis (Area Harvested, Yield, and Production Volume)
- Consumption Analysis (Consumption Value and Volume)
- Import Market Analysis (Import Value, Volume, and Key Supplying Markets)
- Export Market Analysis (Export Value, Volume, and Key Destination Markets)
- Wholesale Price Trend Analysis and Forecast
- Regulatory Framework
- List of Key Players
- Logistics and Infrastructure
- Seasonality Analysis
- Russia
- Production Analysis (Area Harvested, Yield, and Production Volume)
- Consumption Analysis (Consumption Value and Volume)
- Import Market Analysis (Import Value, Volume, and Key Supplying Markets)
- Export Market Analysis (Export Value, Volume, and Key Destination Markets)
- Wholesale Price Trend Analysis and Forecast
- Regulatory Framework
- List of Key Players
- Logistics and Infrastructure
- Seasonality Analysis
- France
- Asia-Pacific
- China
- Production Analysis (Area Harvested, Yield, and Production Volume)
- Consumption Analysis (Consumption Value and Volume)
- Import Market Analysis (Import Value, Volume, and Key Supplying Markets)
- Export Market Analysis (Export Value, Volume, and Key Destination Markets)
- Wholesale Price Trend Analysis and Forecast
- Regulatory Framework
- List of Key Players
- Logistics and Infrastructure
- Seasonality Analysis
- India
- Production Analysis (Area Harvested, Yield, and Production Volume)
- Consumption Analysis (Consumption Value and Volume)
- Import Market Analysis (Import Value, Volume, and Key Supplying Markets)
- Export Market Analysis (Export Value, Volume, and Key Destination Markets)
- Wholesale Price Trend Analysis and Forecast
- Regulatory Framework
- List of Key Players
- Logistic and Infrastructure
- Seasonality Analysis
- Pakistan
- Production Analysis (Area Harvested, Yield, and Production Volume)
- Consumption Analysis (Consumption Value and Volume)
- Import Market Analysis (Import Value, Volume, and Key Supplying Markets)
- Export Market Analysis (Export Value, Volume, and Key Destination Markets)
- Wholesale Price Trend Analysis and Forecast
- Regulatory Framework
- List of Key Players
- Logistics and Infrastructure
- Seasonality Analysis
- Bangladesh
- Production Analysis (Area Harvested, Yield, and Production Volume)
- Consumption Analysis (Consumption Value and Volume)
- Import Market Analysis (Import Value, Volume, and Key Supplying Markets)
- Export Market Analysis (Export Value, Volume, and Key Destination Markets)
- Wholesale Price Trend Analysis and Forecast
- Regulatory Framework
- List of Key Players
- Logistics and Infrastructure
- Seasonality Analysis
- Australia
- Production Analysis (Area Harvested, Yield, and Production Volume)
- Consumption Analysis (Consumption Value and Volume)
- Import Market Analysis (Import Value, Volume, and Key Supplying Markets)
- Export Market Analysis (Export Value, Volume, and Key Destination Markets)
- Wholesale Price Trend Analysis and Forecast
- Regulatory Framework
- List of Key Players
- Logistics and Infrastructure
- Seasonality Analysis
- China
- South America
- Brazil
- Production Analysis (Area Harvested, Yield, and Production Volume)
- Consumption Analysis (Consumption Value and Volume)
- Import Market Analysis (Import Value, Volume, and Key Supplying Markets)
- Export Market Analysis (Export Value, Volume, and Key Destination Markets)
- Wholesale Price Trend Analysis and Forecast
- Regulatory Framework
- List of Key Players
- Logistics and Infrastructure
- Seasonality Analysis
- Argentina
- Production Analysis (Area Harvested, Yield, and Production Volume)
- Consumption Analysis (Consumption Value and Volume)
- Import Market Analysis (Import Value, Volume, and Key Supplying Markets)
- Export Market Analysis (Export Value, Volume, and Key Destination Markets)
- Wholesale Price Trend Analysis and Forecast
- Regulatory Framework
- List of Key Players
- Logistics and Infrastructure
- Seasonality Analysis
- Brazil
- Middle East
- Egypt
- Production Analysis (Area Harvested, Yield, and Production Volume)
- Consumption Analysis (Consumption Value and Volume)
- Import Market Analysis (Import Value, Volume, and Key Supplying Markets)
- Export Market Analysis (Export Value, Volume, and Key Destination Markets)
- Wholesale Price Trend Analysis and Forecast
- Regulatory Framework
- List of Key Players
- Logistics and Infrastructure
- Seasonality Analysis
- United Arab Emirates
- Production Analysis (Area Harvested, Yield, and Production Volume)
- Consumption Analysis (Consumption Value and Volume)
- Import Market Analysis (Import Value, Volume, and Key Supplying Markets)
- Export Market Analysis (Export Value, Volume, and Key Destination Markets)
- Wholesale Price Trend Analysis and Forecast
- Regulatory Framework
- List of Key Players
- Logistics and Infrastructure
- Seasonality Analysis
- Turkey
- Production Analysis (Area Harvested, Yield, and Production Volume)
- Consumption Analysis (Consumption Value and Volume)
- Import Market Analysis (Import Value, Volume, and Key Supplying Markets)
- Export Market Analysis (Export Value, Volume, and Key Destination Markets)
- Wholesale Price Trend Analysis and Forecast
- Regulatory Framework
- List of Key Players
- Logistics and Infrastructure
- Seasonality Analysis
- Egypt
- Africa
- South Africa
- Production Analysis (Area Harvested, Yield, and Production Volume)
- Consumption Analysis (Consumption Value and Volume)
- Import Market Analysis (Import Value, Volume, and Key Supplying Markets)
- Export Market Analysis (Export Value, Volume, and Key Destination Markets)
- Wholesale Price Trend Analysis and Forecast
- Regulatory Framework
- List of Key Players
- Logistics and Infrastructure
- Seasonality Analysis
- Nigeria
- Production Analysis (Area Harvested, Yield, and Production Volume)
- Consumption Analysis (Consumption Value and Volume)
- Import Market Analysis (Import Value, Volume, and Key Supplying Markets)
- Export Market Analysis (Export Value, Volume, and Key Destination Markets)
- Wholesale Price Trend Analysis and Forecast
- Regulatory Framework
- List of Key Players
- Logistics and Infrastructure
- Seasonality Analysis
- South Africa
- North America
Data Sources, Market Sizing, and Validation
Desk Research
Desk research starts by mapping global lentil flows from farms to domestic markets and export channels, since supply and trade link tightly to pricing. We use public agriculture and trade sources such as FAOSTAT, USDA PSD, UN Comtrade, and national agriculture ministries and statistics offices to understand production, consumption, and import-export direction by country.
Price and value conversion are then anchored using sources such as World Bank commodity and macro indicators, central bank FX references, and published wholesale price bulletins and market committee dashboards where available. We also review company filings, investor presentations, association publications, and reputable press to sense-check shifts in acreage, yields, stock levels, and procurement activity. For select company financial and patent references, we use paid databases for faster screening, then validate key points back to public disclosures. These desk sources are illustrative, and many other documents were reviewed to cross-check data, clarify assumptions, and close gaps.
Primary Interviews and Surveys
Primary work is used to turn production and trade signals into a realistic value model, especially in years when prices or trade routes move quickly. We speak with growers, processors, traders, importers, and large buyers, and we also discuss logistics and quality inspection inputs across APAC, EMEA, and the Americas to confirm price bands, loss factors, and the timing of seasonal availability.
Distribution of primary research fieldwork respondents
| Company type | Respondent position | Region |
|---|---|---|
| Top tier: 33% | CXOs: 15% | APAC: 39% |
| Mid tier: 45% | Functional/Unit leaders: 37% | EMEA: 35% |
| Smaller Players: 22% | Managers: 48% | Americas: 26% |
Market-Sizing & Forecasting
The core model uses a top-down build that reconstructs country demand and trade value from production, import and export volumes, and wholesale price trends, then rolls these results up to regional and global totals. Where the public series is thin, we fill gaps using nearby country proxies and multi-year averages, then re-check the output against what interviewees describe for local seasonality and trade mix.
To keep the numbers tied to real market behavior, inputs include planted area and yield direction, exportable surplus for major origins, import dependency for key consuming markets, wholesale price movement by season, and the share of split versus whole lentils in trade. These indicators help us avoid over-counting stock rotations and separate a price spike from a true volume expansion. Forecasts are built using scenario analysis, where acreage, yield expectations, and price paths are stressed under a base case and alternative cases, then tuned using the consensus ranges heard from the field. Select bottom-up checks are also used, such as sampled price times volume for major trade corridors and cross-checks against exporter shipment patterns, so totals are adjusted when they drift from observable flows.
Data Validation & Update Cycle
Validation is done in several passes so the final market value is not dependent on one data stream. We compare country totals against independent signals such as trade-balance logic, per-capita consumption direction, and price behavior during harvest and lean months, and any large variance triggers a re-check of the country assumptions.
Before sign-off, the model is reviewed by another analyst who looks for anomalies in growth rates, currency conversion timing, and sudden share shifts across regions. The report is refreshed annually, and interim updates are made when material events occur, such as major crop shocks, policy changes impacting imports, or sharp FX moves in key trading countries. Right before delivery, a fresh pass is completed so clients receive the latest updated view.
Mordor Intelligence's Lentil Market Sizing Compared With Other Published Estimates
Published market numbers for lentils can look far apart, even when they refer to a similar time period, because the underlying data and the value point used for pricing are not always consistent. Differences usually come from what is counted as market value, how trade is treated, and how prices are converted into USD.
Import-export value series, wholesale price trend checks, and country production balances are the evidence points that keep Mordor Intelligence's estimate tied to a repeatable country-by-country demand pool, instead of relying on a single trade-only value line. Some published figures lean heavily on customs values for one HS definition, which can understate domestic consumption and swing with reporting gaps, while others bundle adjacent forms like flour and blended ingredient use, which inflates the core lentil total. Currency timing, the choice between farm-gate versus wholesale pricing, and refresh cadence also create visible spreads in the headline market size.
Benchmark comparison
| Source | Market Size | Gaps in Research Methodology |
|---|---|---|
| Mordor Intelligence | USD 6.21 B (2026) | |
| Trade Data Bulletin A | USD 2.94 B (2024) | Built mainly from HS-coded import values for dried shelled lentils, which can miss domestic market value and is sensitive to reporting coverage and re-exports. |
| Industry Research Publisher B | USD 7.20 B (2025) | Uses a broader lens that can fold in additional lentil forms and downstream uses beyond whole and split commodity lentils, and may apply different pricing points and currency timing. |
Taken together, the spread is mostly explained by what gets counted as value and how trade-only views are treated versus a full country balance with price checks. By keeping the variables visible and re-checking them against real supply, trade, and wholesale price signals, the final number stays easier to reproduce and update when the next season changes the story.


Key Questions Answered in the Report
What is the current value of the global lentil market?
The lentil market size totaled USD 6.21 billion in 2026 and is projected to reach USD 8.52 billion by 2031.
What is the projected growth rate of the lentil market?
The market is forecast to expand at a 6.53% CAGR between 2026 and 2031.
Which region consumes the most lentils today?
Asia-Pacific held 46% of global value in 2025, led by India's large appetite for lentil-based dal dishes.
How will carbon credits impact lentil production?
Verified nitrogen-fixation credits worth USD 11 to USD 18 per metric ton of CO2-equivalent are boosting returns, encouraging farmers to expand lentil acreage.
Page last updated on:


 Your data is secure and never sold or shared.


