Market Overview
| Study Period | 2019 - 2030 |
|---|---|
| Market Size (2025) | USD 104.93 Billion |
| Market Size (2030) | USD 137.98 Billion |
| Growth Rate (2025 - 2030) | 5.63% CAGR |
| Fastest Growing Market | Asia Pacific |
| Largest Market | Asia-Pacific |
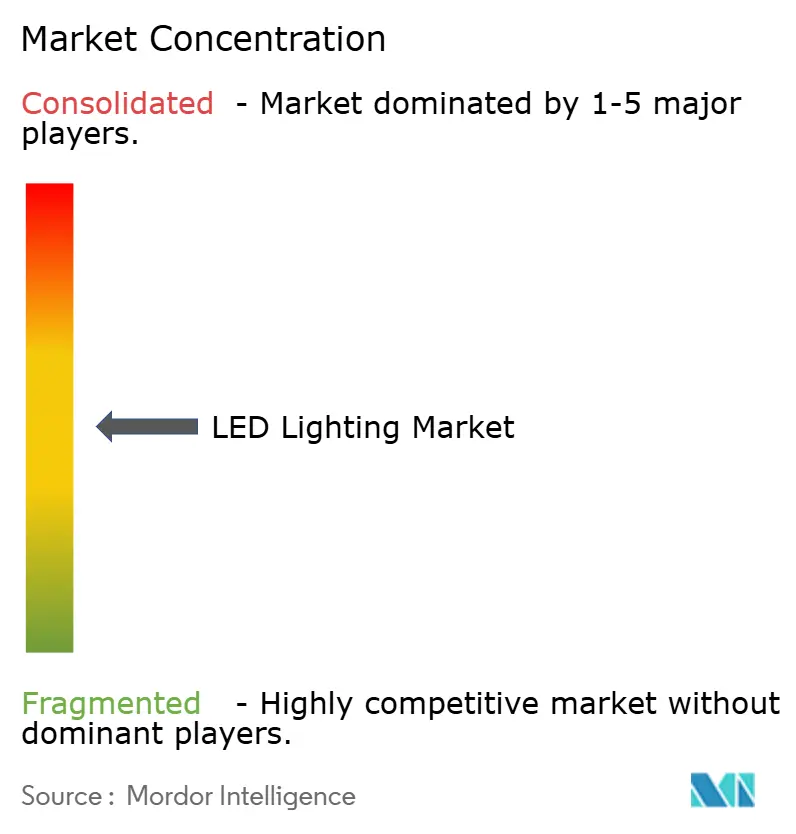
| Market Concentration | Medium |
Major Players
*Disclaimer: Major Players sorted in no particular order Image © Mordor Intelligence. Reuse requires attribution under CC BY 4.0. |
|

LED Lighting Market Analysis by Mordor Intelligence
The LED lighting market size reached USD 104.93 billion in 2025 and is forecast to advance to USD 137.98 billion by 2030, reflecting a 5.63% CAGR. This trajectory illustrates the sector’s transition from rapid early adoption to a stable, replacement-driven phase, where quality differentiation and integrated controls drive competitive success. Government phase-outs of inefficient lamps, a secondary replacement wave for installations completed between 2014 and 2016, and the acceleration of smart-city programs form the primary demand engines. Manufacturers that integrate LED hardware with sensors, network interfaces, and value-added services tend to secure larger contracts and longer customer relationships. Meanwhile, supply-side consolidation, illustrated by Samsung’s planned exit, intensifies rivalry among remaining suppliers as they race to secure channel loyalty and defend margins.[1]David Shiller, “Samsung To Gradually Exit LED Business By 2030,” LightNOW, lightnowblog.com
Key Report Takeaways
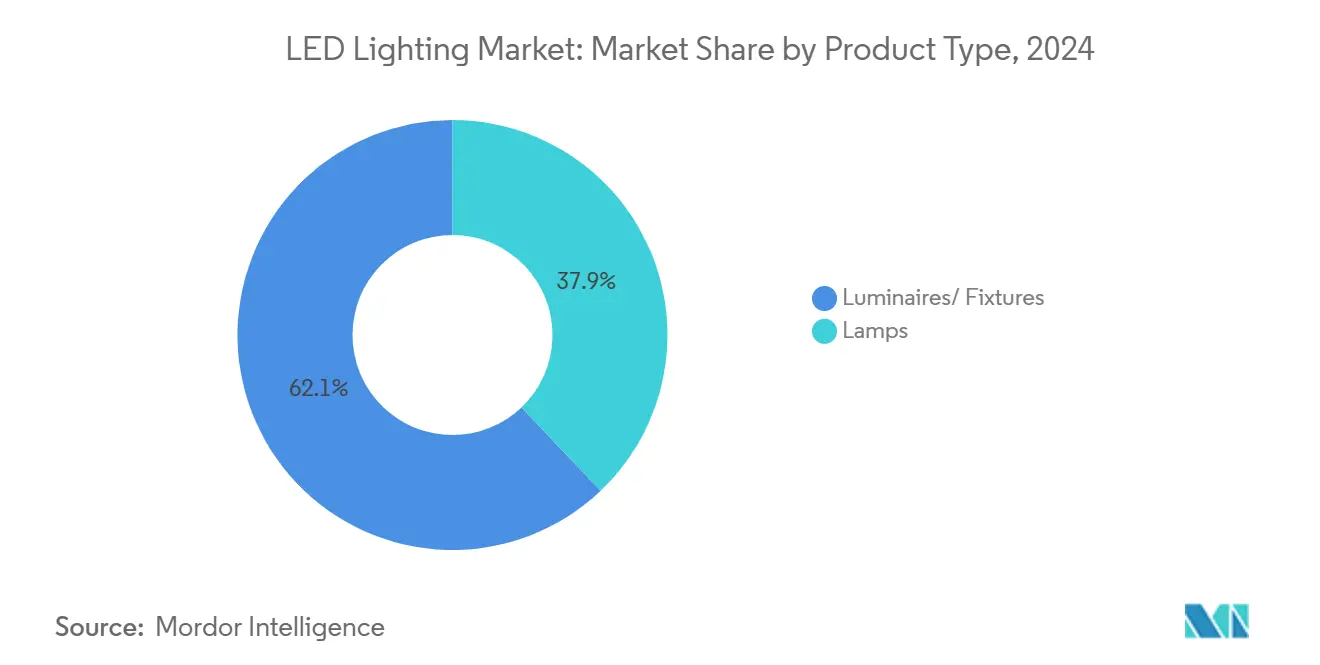
- By product type, luminaires held 62.1% revenue share in 2024, while LED lamps are projected to grow at 8.4% CAGR through 2030.
- By distribution channel, wholesale and retail captured 54.1% of the 2024 revenue; e-commerce is positioned for the fastest growth, with a 6.7% CAGR to 2030.
- By installation type, retrofit projects accounted for a 77.7% share in 2024, whereas new installations are forecast to expand at a 7.2% CAGR through 2030.
- By application, residential lighting accounted for a 19.4% share in 2024; however, highway and roadway projects are expected to advance at a 9.1% CAGR through 2030.
- By end user, indoor spaces accounted for a 62.7% share in 2024, while outdoor deployments are expected to progress at an 8.8% CAGR during the same period.
- By geography, the Asia-Pacific region dominated with a 42.3% share in 2024 and is projected to grow at a 7.7% CAGR through 2030.
Global LED Lighting Market Trends and Insights
Drivers Impact Analysis
| Driver | (~) % Impact on CAGR Forecast | Geographic Relevance | Impact Timeline |
|---|---|---|---|
| Government incentives and phase-outs of incandescent/CFL lighting | +1.8% | Global, with early gains in Australia, the EU, and North America | Medium term (2-4 years) |
| Falling LED prices and efficiency gains | +1.2% | Global | Short term (≤ 2 years) |
| Smart-city infrastructure roll-outs | +0.9% | Asia-Pacific core, spill-over to MEA | Long term (≥ 4 years) |
| Commercial construction and retrofit boom | +1.1% | North America and the EU | Medium term (2-4 years) |
| Secondary replacement cycle for 2014-2016 LED installs | +0.8% | Global | Short term (≤ 2 years) |
| Rise of human-centric (circadian) lighting solutions | +0.6% | North America, the EU, and developed Asia-Pacific markets | Long term (≥ 4 years) |
| Source: Mordor Intelligence | |||
Understand The Key Trends Shaping This Market
Download PDF
Government Incentives and Phase-Outs Drive Market Transformation
Policy intervention remains the strongest accelerator for the LED lighting market. Australia’s Greenhouse and Energy Minimum Standards regulation, effective March 2026, raises minimum efficacy thresholds and extends the incandescent ban through 2030, providing manufacturers with clear compliance schedules and mitigating the risk of stranded inventory. Similar dynamics in the United States, where federal standards guide state and municipal procurement, create predictable bulk-purchase pipelines. Citywide conversions such as Philadelphia’s 131,000-fixture program, which delivered 50% energy savings and USD 2.4 million annual savings, prove the financial logic to other municipalities.[2]City of Philadelphia, “Philadelphia Completes Citywide LED Streetlight Conversion,” phila.gov These policies narrow the viable product spectrum to compliant, higher-quality lamps and luminaires, raising the average selling price and rewarding brands with strong certification portfolios.
Smart City Infrastructure Accelerates LED Adoption
Smart-city investments convert lighting into a data backbone for urban management, raising the strategic value of each luminaire. Milton Keynes’ deployment of 20,000 sensor-enabled LED streetlights cut energy use by 40% while adding traffic and air-quality monitoring functions.[3]Milton Keynes Council, “MK:Smart Project LED Streetlight Deployment,” milton-keynes.gov.uk Parramatta achieved 65% energy savings and integrated lighting nodes into city-wide IoT networks that support revenue-generating services beyond illumination. These examples illustrate how the LED lighting market is shifting from commodity product sales to multidisciplinary infrastructure projects that command long-term service contracts and data platform revenue streams.
Commercial Construction Boom Fuels Retrofit Demand
North American and European retrofit activity remains brisk due to building energy codes and abundant incentive funding. LED retrofit lighting accounts for 12.43% of the global energy retrofit systems segment, which is projected to reach USD 387.23 billion by 2034, growing at a 7.6% CAGR. Commercial buildings represent over half of that value, reinforcing the dominance of professional channels and solution-bundling models. Energy Service Companies now incorporate LED upgrades with HVAC and controls to yield integrated payback profiles, pushing vendors to supply engineering support, financing facilitation, and performance guarantees.
Secondary Replacement Cycle Creates Sustained Demand
An estimated 5.8 billion installed LED lamps, dating back to 2014-2016, are nearing the end of their life, initiating a sizable secondary replacement cycle. Building owners now seek higher efficacy, tunable white, and networked features rather than basic energy savings, which elevates the revenue potential per socket. Manufacturers that can demonstrate superior lumen maintenance, low flicker, and native connectivity command premium pricing, even as commoditized baseline lamps continue to decline in cost.
Restraints Impact Analysis
| Restraint | (~) % Impact on CAGR Forecast | Geographic Relevance | Impact Timeline |
|---|---|---|---|
| High upfront cost of quality LED luminaires | -0.7% | Global, particularly emerging markets | Medium term (2-4 years) |
| Thermal/voltage sensitivity in harsh environments | -0.4% | Industrial applications globally | Short term (≤ 2 years) |
| Influx of sub-standard, low-cost imports | -0.5% | Global, concentrated in price-sensitive segments | Short term (≤ 2 years) |
| Supply-chain volatility after major vendor exits and M&A | -0.6% | Global | Medium term (2-4 years) |
| Source: Mordor Intelligence | |||
High Upfront Costs Limit Premium Segment Penetration
Price differentials between entry-level lamps and premium connected luminaires remain sizeable, deterring adoption in cost-sensitive regions. Although component costs decline annually, advanced features such as tunable spectra, integrated sensors, and robust thermal management add to the bill-of-materials pressure. The result is a bifurcated LED lighting market where basic models compete purely on price, while premium offerings rely on lifecycle savings narratives that some buyers still discount. Emerging markets, small businesses, and municipal budgets with limited capital face the sharpest constraints, resulting in slower penetration of high-margin smart and human-centric products.
Supply Chain Consolidation Creates Market Volatility
Samsung’s staged withdrawal from LED production, Dialight-Sanmina manufacturing disputes, and restructuring at Global Lighting Technologies have tightened component supply and lengthened lead times. Customers dependent on single-source chips or optics risk project delays and price swings, prompting many to dual-source or redesign luminaires around more widely available components. The turbulence benefits vertically integrated firms with broad supplier bases but injects uncertainty into specification cycles, particularly for infrastructure projects with long approval windows.
Segment Analysis
By Product Type: Luminaires Drive Market Value Despite Lamp Growth Acceleration
Luminaires captured 62.1% of 2024 revenue, demonstrating how buyers prefer integrated form factors that combine optics, heat sinks, and controls. This dominance has increased the market share of full-fixture vendors in the LED lighting market, which can tailor products to meet specific architectural and industrial specifications. The luminaire category commands higher average selling prices and longer replacement intervals, stabilizing cash flows for manufacturers. Meanwhile, the lamp segment is expected to expand at an 8.4% CAGR, driven by the secondary replacement wave in residential and light-commercial sockets. Cree LED’s XLamp XFL, delivering up to 20,000 lumens in compact footprints, exemplifies lamp innovation that supplies specific performance gains for portable lighting.
The secondary replacement trend elevates lamps as owners seek quick performance upgrades without the need for rewiring or ceiling work. Nonetheless, the LED lighting market continues to reward luminaire makers that integrate networked controls and support utility rebate paperwork, deepening customer lock-in. Hybrid strategies, in which firms offer retrofit lamps alongside new connected fixtures, help address both budget-driven and feature-seeking buyers.
Get Detailed Market Forecasts at the Most Granular Levels
Download PDF
By Distribution Channel: E-commerce Gains Share While Wholesale Retail Maintains Dominance
Wholesale and retail outlets held a 54.1% share in 2024 because contractors and facility managers rely on immediate product availability, technical guidance, and after-sales support. This channel anchors the LED lighting market by safeguarding project timelines and ensuring compliance with local codes and specifications. E-commerce, however, is on track for the fastest 6.7% CAGR through 2030, as residential consumers and small businesses increasingly adopt direct-to-door fulfillment. Manufacturers such as Havells tapped a dual-channel model by opening a fully stocked warehouse in Anderson, South Carolina, while maintaining relationships with independent lighting agents.
Digital purchase journeys capitalize on catalog standardization and rich media content that demystify the product selection process. Yet complex commercial retrofits still favor wholesalers who provide photometric layouts, rebate coordination, and on-site troubleshooting. Consequently, omni-channel strategies that blend online configurators with local pickup or rapid delivery serve the broadest customer base.
By Installation Type: Retrofit Dominance Reflects Market Maturity
Retrofit projects delivered 77.7% of 2024 installations, underscoring that most current activity involves replacing legacy lamps rather than wiring brand-new circuits. Building owners prefer retrofit kits because they compress downtime and unlock immediate energy savings, bolstering the LED lighting market size for replacement components. New construction is forecast to rise at a 7.2% CAGR, driven by commercial offices and smart-city streetlight schemes that specify connected luminaires from the design stage.
As governments channel stimulus funds into infrastructure, many architects now treat adaptive controls and sensor fusion as baseline requirements. This specification trend supports new-build growth but does not diminish the retrofit opportunity because vast inventories of fluorescent troffers and high-pressure sodium streetlights still await upgrade. Performance-contracting firms leverage utility incentives and ESCO financing to defray capital outlays, preserving retrofit momentum even in climates of rising interest rates.

Get Detailed Market Forecasts at the Most Granular Levels
Download PDF
By Application: Highway and Roadway Leads Growth Despite Residential Market Size
Residential spaces accounted for a 19.4% share in 2024, reflecting the significant number of household sockets worldwide. The segment benefits from standardized form factors and e-commerce ease, sustaining steady unit volumes. Nonetheless, highway and roadway lighting will post the fastest 9.1% CAGR through 2030 as municipalities chase energy and maintenance savings. Philadelphia’s 50% energy cut and USD 2.4 million annual budget relief showcase the economic rationale for large-scale streetlight upgrades.
Growth in roadway lighting stimulates demand for ruggedized drivers, surge protection, and integrated wireless controls that enable adaptive dimming. Vendors that master such specifications capture higher margins and service contracts tied to remote-monitoring software. Meanwhile, indoor commercial offices continue with retrofits at a stable pace, and specialized niches, including horticulture, exploit narrow-band spectra to optimize plant yields.
By End User: Indoor Applications Dominate While Outdoor Segment Accelerates
Indoor environments generated 62.7% of 2024 revenue because offices, warehouses, and homes consume lighting throughout the day and night. Controlled temperatures and low moisture extend product lifespans, reinforcing buyer confidence in extended warranties. Outdoor deployments, however, will grow at an 8.8% CAGR, as smart-city ambitions require resilient fixtures capable of real-time data capture. Milton Keynes’ IoT-ready streetlights illustrate the transition from lighting to multifunction infrastructure.
Advances in thermal management and ingress protection mitigate environmental stresses, thereby expanding the feasibility of outdoor use in regions with harsh climates. Automotive lighting, though smaller in value, experiences rapid design-led innovation in adaptive headlights and signature daytime running strips, confirming that LED technology continues to open high-margin verticals beyond general illumination.
Geography Analysis
The Asia-Pacific region led the LED lighting market, accounting for a 42.3% revenue share in 2024, driven by China’s large-scale manufacturing and India’s infrastructure development. Government schemes such as India’s UJALA bulb distribution and widespread smart-city programs propel continuous demand, while domestic producers leverage cost advantages to supply foreign projects. The region is also expected to exhibit the fastest growth, with a 7.7% CAGR to 2030, underpinned by accelerating urbanization, stimulus-backed construction, and a growing preference for connected lighting ecosystems. Korean and Japanese component firms contribute high-efficacy chips, allowing regional fixture brands to compete globally on both performance and price.
North America maintains a robust position through stringent energy codes, ESCO contracting, and federal infrastructure spending that prioritizes LED conversions. State-level incentives combined with municipal sustainability targets drive high penetration in streetlights and public facilities. Commercial new-build projects integrate networked luminaires to meet occupant-wellness standards, while warehousing and logistics facilities migrate to high-bay LEDs for operational savings. Supply-chain disruptions, however, cause occasional project delays, prompting many buyers to dual-source drivers and chip packages.
Europe benefits from the Energy Performance of Buildings Directive and the Renovation Wave that compel deep retrofits across member states. Utility tariffs and carbon taxes strengthen the economic case for LED upgrades, and local content rules favor European brands for public tenders. Scandinavian cities are spearheading human-centric lighting pilots, advancing the adoption of tunable white fixtures. Conversely, the Middle East and Africa exhibit heterogeneous development; oil-rich Gulf states invest in smart-city showcase projects, while many African nations focus on basic electrification and rely on donor-funded LED rollouts. Latin America is experiencing gradual progress as energy subsidies decline and public lighting concessions encourage the adoption of performance-based contracting.

Get Analysis on Important Geographic Markets
Download PDF
Competitive Landscape
The LED lighting market is moderately concentrated, with a growing divide between scale-driven incumbents and agile niche specialists. Signify, ams OSRAM, and Acuity Brands defend share through global distribution, patent portfolios, and broad product catalogs. Acuity’s fiscal-year 2024 results highlight this strategy: despite a 2.8% decline in sales, operating profit increased by USD 79.9 million through pricing actions and a pivot toward horticulture and intelligent-space solutions.[4]Inside Lighting, “Acuity Brands 2024: Profits Jump USD 79.9 Million Despite Sales Dip,” inside.lighting
Supplier exits reshape the playing field. Samsung’s withdrawal fuels customer migrations to Luminus, Seoul Semiconductor, and Nichia for core chips, while fixture OEMs scramble to validate alternative bill-of-materials. Consolidation among optics and driver vendors encourages larger players to offer end-to-end platforms that simplify the sourcing process. At the same time, regional challengers in China and India undercut pricing but increasingly supplement cost with localized service centers and rapid-custom tooling.
Technology differentiation shifts toward application-specific performance. Sony’s RGB backlight, surpassing 4,000 cd/m² in brightness with over 99% DCI-P3 coverage, exemplifies how suppliers target high-value display and entertainment niches. Human-centric and circadian systems are gaining traction in healthcare and education, where occupant well-being metrics translate into procurement budgets. Acquisitions of controls and software start-ups by fixture majors confirm that future competitive advantage lies in vertically integrated lighting-as-a-service offerings rather than lamp efficacy alone.
LED Lighting Industry Leaders
-
Signify N.V.
-
ams OSRAM AG
-
Acuity Brands Lighting Inc.
-
Cree LED (SMART Global Holdings)
-
LEDVANCE GmbH
- *Disclaimer: Major Players sorted in no particular order
Need More Details on Market Players and Competitors?
Download PDF
Recent Industry Developments
- March 2025: Sony announced a next-generation RGB LED backlight achieving >4,000 cd/m² peak brightness and >99% DCI-P3 gamut, with mass production slated for late 2025 and initial products at CES January 2026, in collaboration with MediaTek and ROHM.
- March 2025: Australia registered new Greenhouse and Energy Minimum Standards (LED Lamps) Determination 2025, effective March 2026, while extending incandescent bans through October 2030.
- March 2025: Havells Lighting LLC began U.S. operations in Anderson, South Carolina, combining warehouse stock and same-day shipping to serve indoor and outdoor projects.
- October 2024: Samsung revealed plans to exit the LED lighting business by 2030, prompting fixture manufacturers to recalibrate sourcing strategies.
Global LED Lighting Market Report Scope
Agricultural Lighting, Commercial, Industrial and Warehouse, Residential are covered as segments by Indoor Lighting. Public Places, Streets and Roadways, Others are covered as segments by Outdoor Lighting. Daytime Running Lights (DRL), Directional Signal Lights, Headlights, Reverse Light, Stop Light, Tail Light, Others are covered as segments by Automotive Utility Lighting. 2 Wheelers, Commercial Vehicles, Passenger Cars are covered as segments by Automotive Vehicle Lighting. Asia-Pacific, Europe, Middle East and Africa, North America, South America are covered as segments by Region.
By Product Type
| Lamps |
| Luminaires / Fixtures |
By Distribution Channel
| Direct Sales |
| Wholesale / Retail |
| E-commerce |
By Installation Type
| New Installation |
| Retrofit Installation |
By Application
| Commercial Offices |
| Retail Stores |
| Hospitality |
| Industrial |
| Highway and Roadway |
| Architectural |
| Public Places |
| Hospitals |
| Horticulture Gardens |
| Residential |
| Automotive |
| Others (Chemicals, Oil and Gas, Agriculture) |
By End User
| Indoor |
| Outdoor |
| Automotive |
By Geography
| North America | United States | |
| Canada | ||
| Mexico | ||
| South America | Brazil | |
| Argentina | ||
| Rest of South America | ||
| Europe | Germany | |
| United Kingdom | ||
| France | ||
| Italy | ||
| Spain | ||
| Russia | ||
| Rest of Europe | ||
| Asia-Pacific | China | |
| Japan | ||
| India | ||
| South Korea | UAE | |
| South-East Asia | ||
| Rest of Asia-Pacific | ||
| Middle East and Africa | Middle East | Saudi Arabia |
| United Arab Emirates | ||
| Turkey | ||
| Rest of Middle East | ||
| Africa | South Africa | |
| Nigeria | ||
| Rest of Africa | ||
| By Product Type | Lamps | ||
| Luminaires / Fixtures | |||
| By Distribution Channel | Direct Sales | ||
| Wholesale / Retail | |||
| E-commerce | |||
| By Installation Type | New Installation | ||
| Retrofit Installation | |||
| By Application | Commercial Offices | ||
| Retail Stores | |||
| Hospitality | |||
| Industrial | |||
| Highway and Roadway | |||
| Architectural | |||
| Public Places | |||
| Hospitals | |||
| Horticulture Gardens | |||
| Residential | |||
| Automotive | |||
| Others (Chemicals, Oil and Gas, Agriculture) | |||
| By End User | Indoor | ||
| Outdoor | |||
| Automotive | |||
| By Geography | North America | United States | |
| Canada | |||
| Mexico | |||
| South America | Brazil | ||
| Argentina | |||
| Rest of South America | |||
| Europe | Germany | ||
| United Kingdom | |||
| France | |||
| Italy | |||
| Spain | |||
| Russia | |||
| Rest of Europe | |||
| Asia-Pacific | China | ||
| Japan | |||
| India | |||
| South Korea | UAE | ||
| South-East Asia | |||
| Rest of Asia-Pacific | |||
| Middle East and Africa | Middle East | Saudi Arabia | |
| United Arab Emirates | |||
| Turkey | |||
| Rest of Middle East | |||
| Africa | South Africa | ||
| Nigeria | |||
| Rest of Africa | |||
Need A Different Region or Segment?
Customize Now
Market Definition
- INDOOR LIGHTING - It incorporates all LED based lamps and fixtures/luminaire that are used to illuminate indoor section of residential, commercial, industrial buildings and agricultural lighting. LED offers efficient brightness with higher durability in comparison to other lighting technology.
- OUTDOOR LIGHTING - It incorporates the LED lighting fixtures that is used for illumination for exterior/outdoor illumination. For instance, LED lighting fixtures used to illuminate streets and highways, transport hubs, stadiums and other public places such as parking spaces.
- AUTOMOTIVE LIGHTING - It refers to the lighting fixtures installed for illumination and signaling purposes. It is used in both exterior and interior lighting of the vehicle. Headlamps, fog lamp, daytime running light (DRLs) are examples of exterior light whereas cabin light are interior lights.
- END USER - It refers to the end use application area where the LED fixture will be installed. For instance, in terms of indoor lighting, we have residential, commercial and industrial as end user category. For automotive lighting, primary end user considered are automotive manufacturers and aftermarket sale
| Keyword | Definition |
|---|---|
| Lumen | Lumen is a unit of luminous flux in the International System of Units that is equal to the amount of light given out through a solid angle by a source of one-candela intensity radiating equally in all directions. |
| Footcandle | A foot-candle (or foot-candle, fc, lm/ft2, or ft-c) is a measurement of light intensity. One foot-candle is defined as enough light to saturate a one-foot square with one lumen of light. |
| Colour Rendering Index (CRI) | Color Rendering Index (CRI) is a measurement of how natural colors render under an artificial white light source when compared with sunlight. The index is measured from 0-100, with a perfect 100 indicating that colors of objects under the light source appear the same as they would under natural sunlight. |
| Luminous flux | Luminous flux is a measure of the power of visible light produced by a light source or light fitting. It is measured in lumens (lm). |
| Annual Energy Cost | Annual Energy Cost means the average daily energy consumption multiplied by 365 (days per year), expressed in kilowatt hour per year (kWh/a). |
| Constant voltage drivers | Constant voltage drivers are designed for a single direct current (DC) output voltage. Most common constant voltage drivers (or Power Supplies) are 12VDC or 24VDC. An LED light that is rated for constant voltage usually specifies the amount of input voltage it needs to operate correctly. |
| Constant Current Driver | Constant current LED drivers are designed for a designated range of output voltages and a fixed output current (mA). LEDs that are rated to operate on a constant current driver require a designated supply of current usually specified in milliamps (mA) or amps (A). These drivers vary the voltage along an electronic circuit which allows current to remain constant throughout the LED system. |
| Minimum Energy Performance Standards (MEPS) | Minimum Energy Performance Standards specify the minimum level of energy performance that appliances and equipment must meet or exceed before they can supply or used for commercial purposes. |
| Luminous Efficacy | Luminous efficacy is a measurement commonly used in the lighting industry that indicates the ability of a light source to emit visible light using a given amount of power. |
| Solid State Lighting | Solid-state lighting (SSL) is a type of lighting that uses semiconductor light-emitting diodes (LEDs), organic light-emitting diodes (OLED), or polymer light-emitting diodes (PLED) as sources of illumination rather than electrical filaments, plasma (used in arc lamps such as fluorescent lamps), or gas. |
| Rated Lamp Life | Lamp life, also referred to as rated life, is the time in hours a lamp will last before a percentage of lamps will burn out. |
| Color Temperature | Colour temperature is a scale that measures how ‘warm’ (yellow) or ‘cool’ (blue) the light from a particular source is. It is measured in degrees of the Kelvin scale (abbreviated to K), and the higher the number, the ‘cooler’ the light. The lower the ‘K’ number, the ‘warmer’ the light. |
| Ingress Protection rating (IP rating) | The IP (Ingress Protection) rating of a bulb or light fixture declares the level of protection it has against dirt and water. |
| Fidelity Index | The general colour fidelity index, Rf, represents how closely the colour appearances of the entire sample set are reproduced (rendered) on average by a test light as compared to those under a reference illuminant. |
| Gamut Index | The gamut area is defined as “the area enclosed by a set of test color samples illuminated by a light source, in a two-dimensional chromaticity diagram or a plane of color space.”1 Within a defined color space, a “gamut” describes the subset of colors that can be perceived under specific lighting conditions. |
| Binning | In the lighting industry, the act of "binning" of LEDs is the process of sorting LEDs by certain characteristics, such as color, voltage, and brightness. |
| Accent lighting | Accent lighting, also called highlighting, emphasizes objects by focusing light directly on them. Accent lighting is used inside and outside the home to feature locations such as an entrance or to create dramatic effects. |
| Dimmable driver | A dimming driver has two functions: As a driver, it converts the 230V AC mains input to a low voltage DC output. As a dimmer, it reduces the amount of electrical energy flowing to the LEDs, thereby causing them to dim. |
| Flicker | Flicker is the repeated and frequent variation in the output of a light source over time. |
| Fluorescent | A property of materials defined as the ability to emit light after absorbing electromagnetic radiation such as visible or UV light. |
| Candela | The candela is the unit of luminous intensity in the International System of Units. It measures the light output per unit solid angle emitted from a light source in a specific direction. |
| LUX | Lux is used to measure the amount of light output in a given area - one lux is equal to one lumen per square meter. It enables us to measure the total "amount" of visible light present and the intensity of the illumination on a surface. |
| Uniformity (U0) | The uniformity of lighting has significant effects on visual performance in both indoor and outdoor areas. Uniformity (represented as U0) value can be found by dividing the minimum brightness (Emin) resulting from calculations according to the current lighting order, to the average brightness value (Eavg). |
| Visible Light Spectrum | The visible light spectrum is the segment of the electromagnetic spectrum that the human eye can view. More simply, this range of wavelengths is called visible light. Typically, the human eye can detect wavelengths from 380 to 700 nanometers. |
| Ambient Temperature | Ambient Temperature is the temperature of the air surrounding an electrical enclosure. |
| Current-controlled dimming control | Current-controlled dimming controls LED brightness by varying the applied current using a 0-10V dimmer. Current-controlled dimming is smooth and HD-video friendly. It can only dim to a minimum of 5% of light output. |
| Design Light Consortium | It is a partnership of energy efficiency stakeholders in the United States and Canada to “promote quality, performance and energy efficient lighting solutions for the commercial sector”. |
| Pulse Width Modulation | Pulse-width modulation, or pulse-duration modulation, is a method of controlling the average power delivered by an electrical signal. |
| Surface Mounted Device | A surface mount device (SMD) is an electronic device whose components are mounted or placed directly on the surface of a printed circuit board. |
| Alternating Current | Alternating current is an electric current which periodically reverses direction and changes its magnitude continuously with time, in contrast to direct current, which flows only in one direction. |
| Direct Current | Direct current (DC) is an electric current that is uni-directional, so the flow of charge is always in the same direction. |
| Beam Angle | Beam angle (also called beam spread) is a measure of how light is distributed. On any plane perpendicular to the centerline of the light, the beam angle is the angle between two rays where the light intensity is 50% of the maximum light intensity. |
| LED Based Solar High Mast Lighting Systems | A Solar LED High Mast Light is a raised source of High illumination lights (6~8 lights) and with high intensity on the middle of major junctions (Ring roads, Outer Ring roads), turned on or lit automatically in the absence of light (at specified timings or at periodic times, every night). |
| Surface Mounted Diode (SMD) LEDs | A surface mount diode is a type that emits light and is flat mounted and soldered onto a circuit board. |
| Chip on Board (COB) LEDs | A COB LED is basically multiple LED chips (usually 9 or more) glued directly onto a substrate by the manufacturer to form a single module. |
| Dual In-Line Package (DIP) LEDs | A dual in-line package (DIP or DIL) is an electronic component package with a rectangular case and two parallel rows of electrical connector pins. |
| Graphene LED Lights | A graphene LED light bulb is simply an LED light bulb where the filament has been coated in graphene. A graphene LED bulb is reported to be 10% more efficient than regular LED light bulbs and they are cheaper to manufacture and buy. |
| LED Corn Bulbs | LED Corn lights are designed as an energy efficient alternative to high intensity discharge (HID) and SON lamps. It uses a large number of LEDs on a metal structure to provide sufficient light. This arrangement of LEDs looks a lot like a corn cob, hence the name "corn light". |
| Per Capita Income | Per capita income or total income measures the average income earned per person in a given area in a specified year. It is calculated by dividing the area's total income by its total population. Per capita income is national income divided by population size. |
| Charging Stations | A charging station, also known as a charging station or electric vehicle utility, is a power supply that provides electrical energy for charging plug-in electric vehicles. |
| Headlight | A headlight is a light that is mounted on the front of a car and illuminates the road in front of it. Low beam and high beam LED headlights are additional categories for these LED headlights. |
| Day Time Running Light (DRLs) | A daytime running lamp is a white, yellow, or amber lighting device mounted on the front of a road-going motor vehicle or bicycle. |
| Directional Signal Light | Directional signal lights are the front and rear lights on an automobile that flash to show the direction of a turn. |
| Stop Light | A red light that is mounted to the back of a car and turns on when the brakes are used to show that the car is stopped. |
| Reverse Light | The reverse light is at the back of the vehicle to indicate its backward motion. |
| Tail Light | A red light that can be seen in the dark is mounted on the rear of a road vehicle. Stop, reverse, and directional signal lights are all part of it. |
| Fog Light | Bright lights in automobiles used to increase visibility on the road in foggy conditions or to warn other drivers of the presence of the vehicle. |
| Passenger Vehicle | A passenger vehicle is a road vehicle, other than a moped or a motorcycle, intended for the transportation of people and designed for up to 8 to 9 seats. |
| Commercial Vehicle | A commercial vehicle (Bus, Truck, Van) is any type of motor vehicle used to transport goods or pay passengers. |
| Two Wheelers (2W) | A two-wheeler is a vehicle that runs on two wheels. |
| Streets & Roadways | Both roads and streets refer to hard, flat surfaces on the ground on which vehicles, people, and animals can travel. Since streetways are usually in cities and towns, they often have houses and buildings on both sides. The roadway is in the countryside and sometimes passes through forests and fields |
| Horticulture Lighting | Horticulture is the science and art of sustainably growing, producing, marketing and using high quality, intensively cultivated food and ornamental plants. |
Need More Details on Market Definition?
Ask a Question
Research Methodology
Mordor Intelligence has followed the following methodology in all our data center reports.
- Step 1: Raw Data Collection: To understand the market, initially, all crtical data points were identified. Critical information about countries and regions of interest including Per-capita Income, Population, Automotive Production, Interest rate on Auto-Loans, Number of Automobiles on Road, Total LED Import, Lighting Electricity Consumption among others were recorded or estimated based on internal calculations.
- Step 2: Identify Key Variables: To build a robust forecasting model, key variables such as Number of Households, Automotive Production, Road Networks among others were identified. Through an iterative process, the variables required for the market forecast were set, and the model was built using these variables.
- Step 3: Build a Market Model: Based on data and critical industry trend data (variables), including LED pricing, LED penetration rate, and project macro and micor economic factors were utilized for building the market forecasting.
- Step 4: Validate and Finalize: In this crucial step, all market numbers and variables derived through an internal mathematical model were validated through an extensive network of primary research experts from all the markets studied. The respondents are selected across levels and functions to generate a holistic picture of the market studied.
- Step 5: Research Outputs: Syndicated Reports, Custom Consulting Assignments, Databases & Subscription Platforms

Get More Details On Research Methodology
Download PDF


