
Learning Analytics Market Size and Share
Market Overview
| Study Period | 2020 - 2031 |
|---|---|
| Market Size (2026) | USD 16.99 Billion |
| Market Size (2031) | USD 43.87 Billion |
| Growth Rate (2026 - 2031) | 20.90 % |
| Fastest Growing Market | Asia Pacific |
| Largest Market | North America |
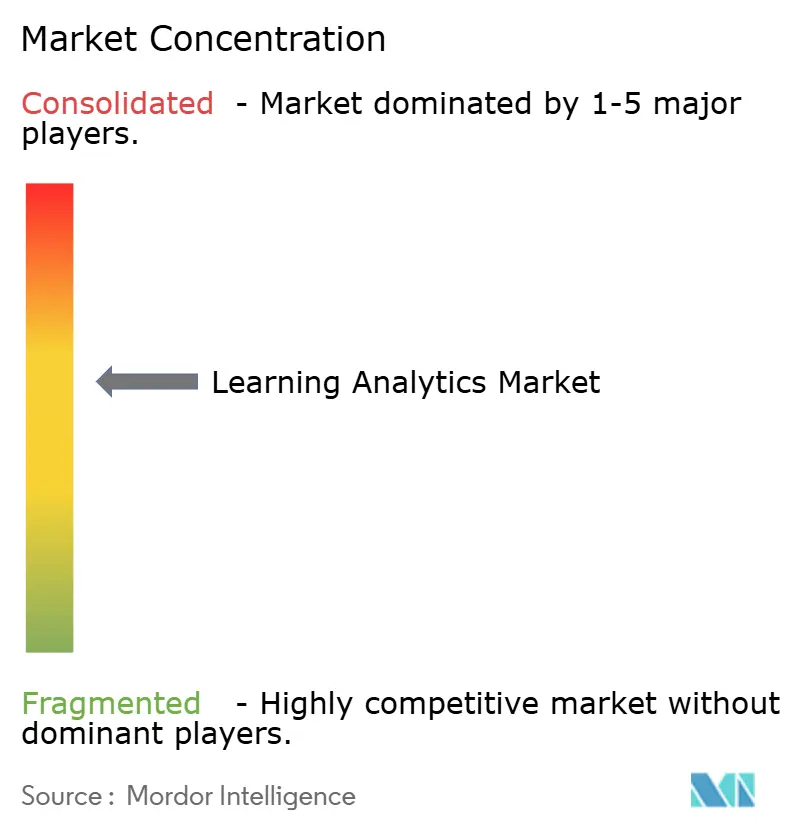
| Market Concentration | Medium |
Major Players *Disclaimer: Major Players sorted in no particular order Image © Mordor Intelligence. Reuse requires attribution under CC BY 4.0. | |
Learning Analytics Market Analysis by Mordor Intelligence
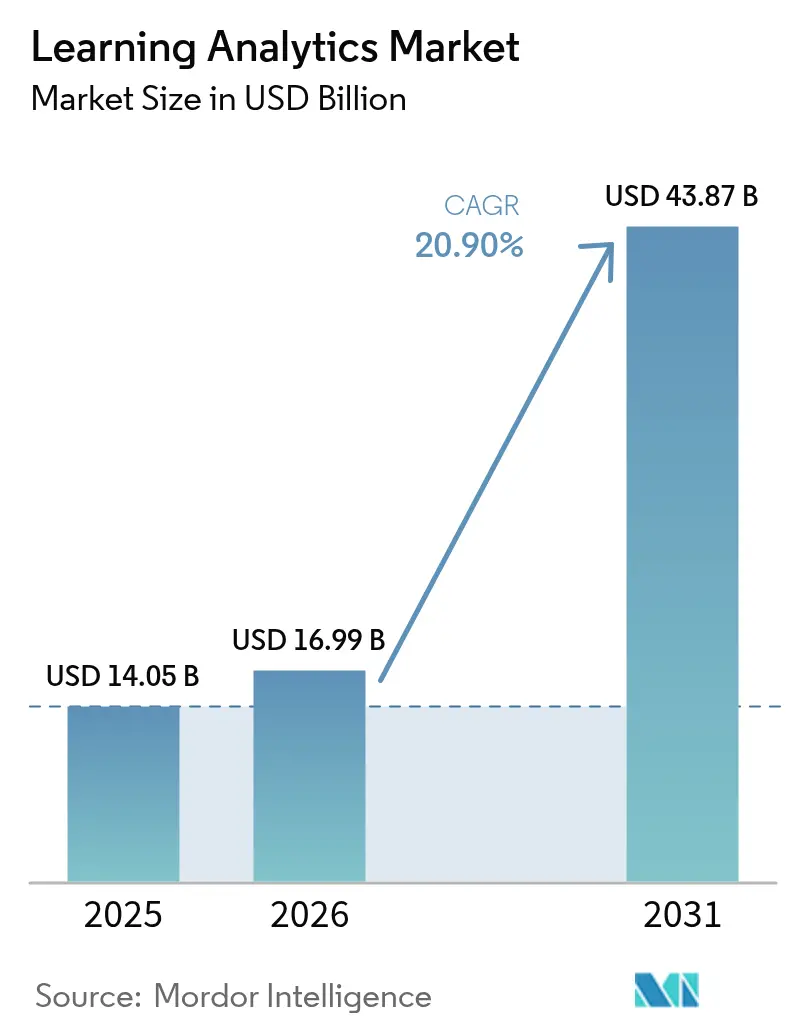
The learning analytics market size is expected to grow from USD 14.05 billion in 2025 to USD 16.99 billion in 2026 and is forecast to reach USD 43.87 billion by 2031 at 20.90% CAGR over 2026-2031. Rapid adoption reflects a clear shift toward data-driven decision making across education and corporate training. Institutions deploy predictive dashboards, AI-powered early-warning systems, and cloud platforms to raise student success while streamlining operations. Government funding programs, outcome-based financing, and expanding cloud capacity underpin demand momentum, while privacy compliance and talent shortages temper the pace of implementation. Competitive intensity stays moderate as platform leaders consolidate capabilities, and AI-native entrants introduce niche solutions that deepen market functionality.
Key Report Takeaways
- By offerings, software solutions led with 67.62% of the learning analytics market share in 2025, whereas services are poised for the fastest 22.52% CAGR to 2031.
- By deployment mode, on-premise installations held 70.35% share of the learning analytics market size in 2025, yet cloud deployments are set to post a 22.96% CAGR through 2031.
- By analytics type, predictive tools captured 57.12% of the learning analytics market share in 2025, while prescriptive analytics shows the highest 21.86% CAGR outlook.
- By application, performance management and student success commanded 48.73% of the learning analytics market size in 2025, whereas curriculum development is projected to expand at 21.23% CAGR.
- By end user, academia accounted for 66.48% share of the learning analytics market in 2025; corporate learning analytics represents the fastest 22.14% CAGR segment.
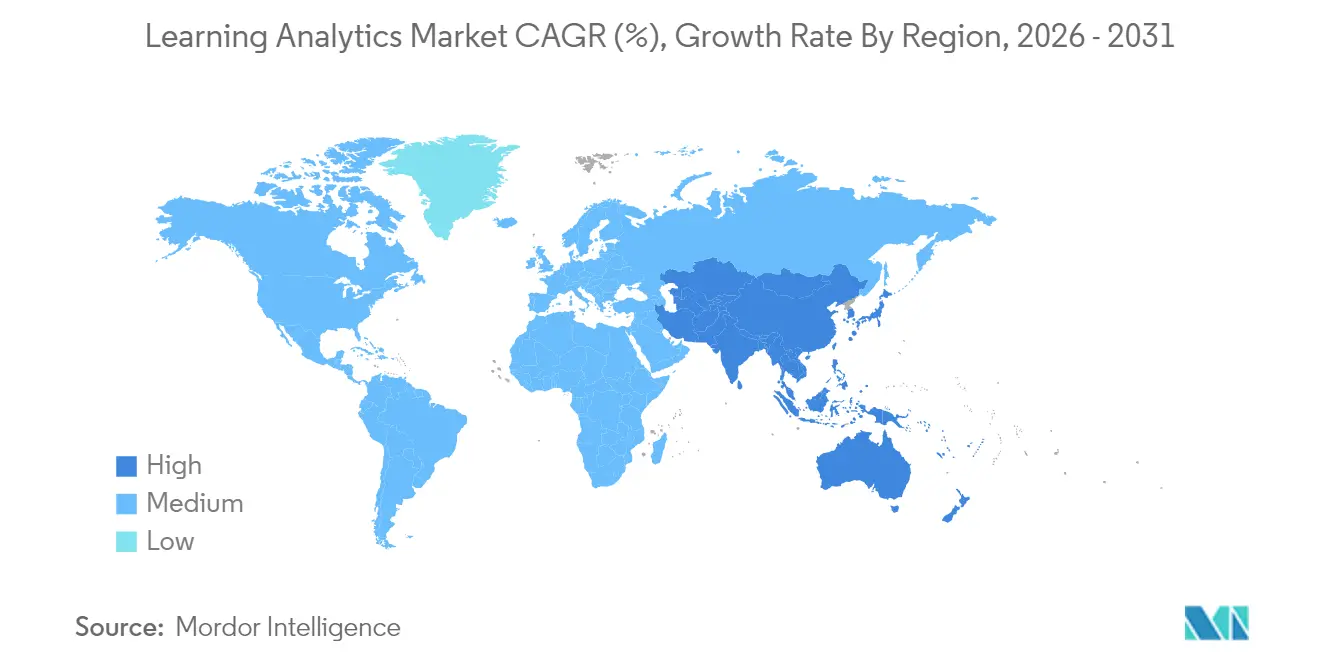
- By geography, North America secured 38.12% of the learning analytics market share in 2025, while Asia-Pacific is forecast to grow at 21.62% CAGR.
Note: Market size and forecast figures in this report are generated using Mordor Intelligence’s proprietary estimation framework, updated with the latest available data and insights as of 2026.
Market Trends and Insights
Drivers Impact Analysis of Learning Analytics Market*
| Driver | (~) % Impact on CAGR Forecast | Geographic Relevance | Impact Timeline |
|---|---|---|---|
| Increasing focus on improving student outcomes and retention | +5.4% | Global, with concentrated adoption in North America and Europe | Medium term (2-4 years) |
| Expansion of cloud-based learning analytics platforms and MOOCs | +4.7% | Global, accelerated in Asia-Pacific and Latin America | Short term (≤ 2 years) |
| Government and institutional EdTech funding surge | +3.9% | North America, Europe, India, China | Medium term (2-4 years) |
| Advances in AI/ML enabling deeper analytics insights | +4.3% | Global, with early adoption in developed markets | Long term (≥ 4 years) |
| Integration of Learning Record Stores with XR content | +2.6% | North America, Europe, select Asia-Pacific markets | Long term (≥ 4 years) |
| Outcome-based funding models driving analytics adoption | +3.2% | United States, United Kingdom, Australia | Medium term (2-4 years) |
| Source: Mordor Intelligence | |||
Increasing Focus on Improving Student Outcomes and Retention
Institutions now tie financial viability to completion metrics, adopting analytics suites that flag at-risk learners and recommend timely interventions. Post-pandemic enrollment pressures heightened the urgency, and universities using comprehensive platforms have recorded 15-20% gains in first-year retention. Performance-based funding in 28 states links public allocations to student success, turning analytics from optional innovation into operational necessity. The shift also answers accountability demands from accreditors and employers who equate graduate performance with institutional reputation.
Expansion of Cloud-Based Learning Analytics Platforms and MOOCs
Cloud delivery removes infrastructure barriers, letting smaller schools obtain enterprise-grade insights via subscription models. Seamless links with learning management systems shorten deployment cycles, while real-time processing supports personalized feedback loops at scale. Massive Open Online Course providers refine content through continuous cloud analytics, and consortia now share anonymized datasets under stringent encryption standards[1]. The resulting democratization broadens the learning analytics market far beyond early adopters.
Government and Institutional EdTech Funding Surge
Policy makers frame data-driven education as a competitiveness lever. The U.S. Institute of Education Sciences funds generative AI pilots, the UK earmarked GBP 4 million (USD 5.43 million) for AI teacher tools, and India’s Budget 2025 assigned around (USD 57.97 million) to an AI Centre of Excellence. These grants cover technology procurement, professional training, and research, anchoring long-term demand for analytics platforms that document measurable learning gains.
Advances in AI/ML Enabling Deeper Analytics Insights
Machine learning elevates analytics from descriptive dashboards to predictive and prescriptive guidance. Algorithms detect subtle engagement patterns, while natural-language processing evaluates discussion posts to gauge comprehension. Generative tools such as PowerSchool’s PowerBuddy turn complex data into conversational insights for non-technical educators, widening user adoption. As models mature, adaptive systems will continuously fine-tune course pathways to individual learner profiles.
Restraints Impact Analysis of Learning Analytics Market*
| Restraint | (~) % Impact on CAGR Forecast | Geographic Relevance | Impact Timeline |
|---|---|---|---|
| Data privacy and security compliance burden | -1.7% | Global, particularly Europe (GDPR), United States (FERPA) | Short term (≤ 2 years) |
| Shortage of analytics talent within education sector | -2.6% | Global, acute in developed markets with high demand | Medium term (2-4 years) |
| Vendor lock-in and NGDLE interoperability gaps | -1.3% | Global, particularly affecting multi-platform institutions | Medium term (2-4 years) |
| Algorithmic bias scrutiny slowing procurements | -1.1% | North America, Europe, Australia with strict AI governance | Short term (≤ 2 years) |
| Source: Mordor Intelligence | |||
Data Privacy and Security Compliance Burden
GDPR and FERPA impose strict consent and data-handling mandates that raise legal and technical costs. Institutions must modernize governance frameworks, encrypt granular learner records, and justify algorithmic decisions to stakeholders, slowing procurement cycles. Vendors, in turn, localize solutions to meet region-specific rules, adding complexity and cost that can delay global rollouts.
Shortage of Analytics Talent Within Education Sector
Only 23% of educators believe graduates hold required data science skills, yet 69% of employers rank analytics proficiency as critical, creating a structural gap[2]. Education faces stiff competition from tech firms for qualified data scientists, which inflates salaries and undermines institutional capacity. Dependence on external consultants raises implementation fees and can limit knowledge transfer, constraining the speed at which the learning analytics market scales.
*Our forecasts treat driver/restraint impacts as directional, not additive. The impact forecasts reflect baseline growth, mix effects, and variable interactions.
Learning Analytics Market Segment Analysis
By Offerings:
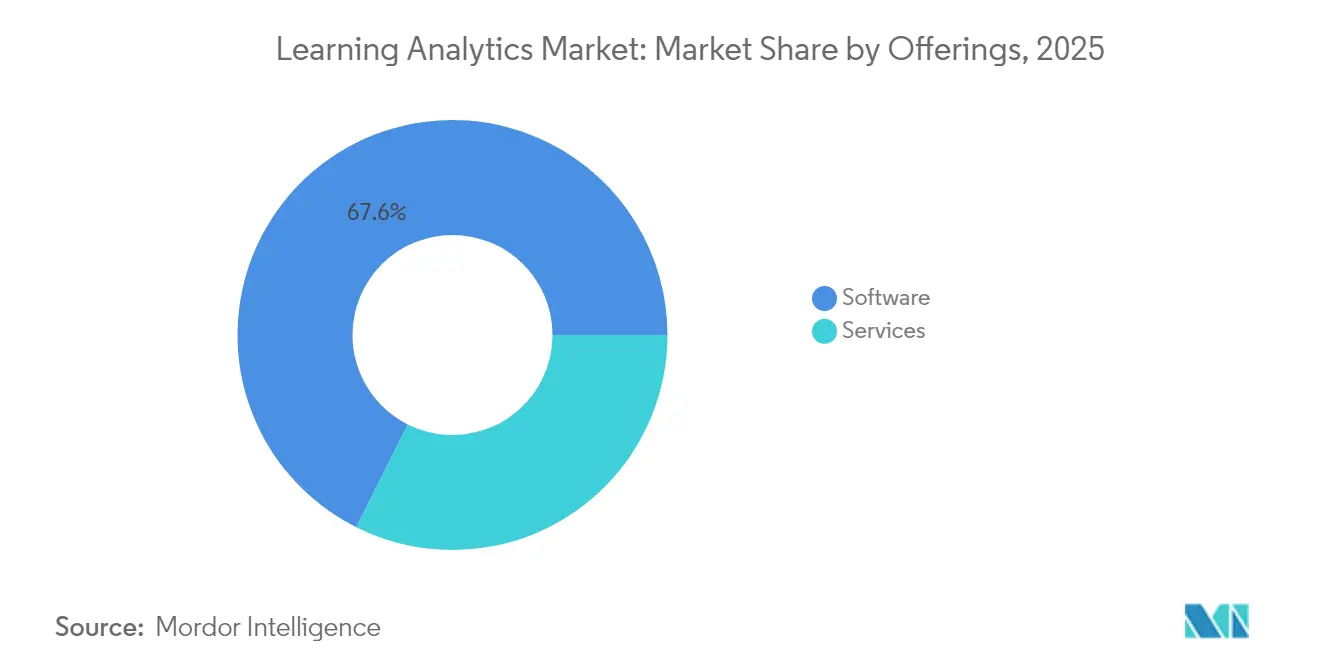
Services Accelerate While Software Sustains LeadershipSoftware solutions generated 67.62% of 2025 revenue, forming the backbone of the learning analytics market. Predictive dashboards surface early-warning indicators, while adaptive engines personalize content. Over the forecast horizon, services will outpace software with a 22.52% CAGR, reflecting demand for integration, training, and managed operations. Institutions increasingly rely on partners to bridge technical and pedagogical gaps, underscoring that human expertise remains essential for delivering full value.
Services growth also mirrors rising complexity: multi-source data ingestion, AI model tuning, and evergreen compliance updates require specialized skills. Consulting and managed services firms therefore secure long-term contracts as schools seek outcome guarantees rather than licenses alone. As a result, the learning analytics market size attributable to services is projected to rise steadily through 2031 alongside deepening platform penetration.

By Deployment Mode:
Cloud Traction Grows Despite On-Premise Legacy BaseOn-premise architectures retained 70.35% share of the learning analytics market size in 2025, supported by data-sovereignty policies and entrenched campus infrastructure. Yet cloud solutions are expanding at 22.96% CAGR, driven by elastic capacity and subscription pricing that lower total cost of ownership. Institutions that moved to the cloud during pandemic disruptions seldom revert, citing seamless remote access and quicker feature updates.
Hybrid frameworks now emerge, letting schools keep sensitive datasets on local servers while harnessing cloud compute for intensive analytics. This layered architecture reconciles privacy mandates with scalability, and it encourages incremental migration paths that further enlarge the learning analytics market. Vendors offering flexible deployment options thus appeal to both risk-averse and forward-leaning customers.
By Analytics Type:
Predictive Dominance Transitions Toward Prescriptive GrowthPredictive engines commanded 57.12% share in 2025 as institutions prioritized early identification of at-risk students. These models digest historical grades, engagement logs, and demographic data to forecast success probabilities. Prescriptive analytics, although smaller today, is rising fastest at 21.86% CAGR because it moves beyond alerts to recommend concrete actions, such as tutoring schedules or adaptive assessments.
Descriptive reporting remains foundational, supplying the baseline metrics that fuel more advanced layers. Over time, continuous improvements in model accuracy and explainability will push prescriptive tools into mainstream workflows, reshaping educator expectations and propelling the learning analytics market forward.
By Application:
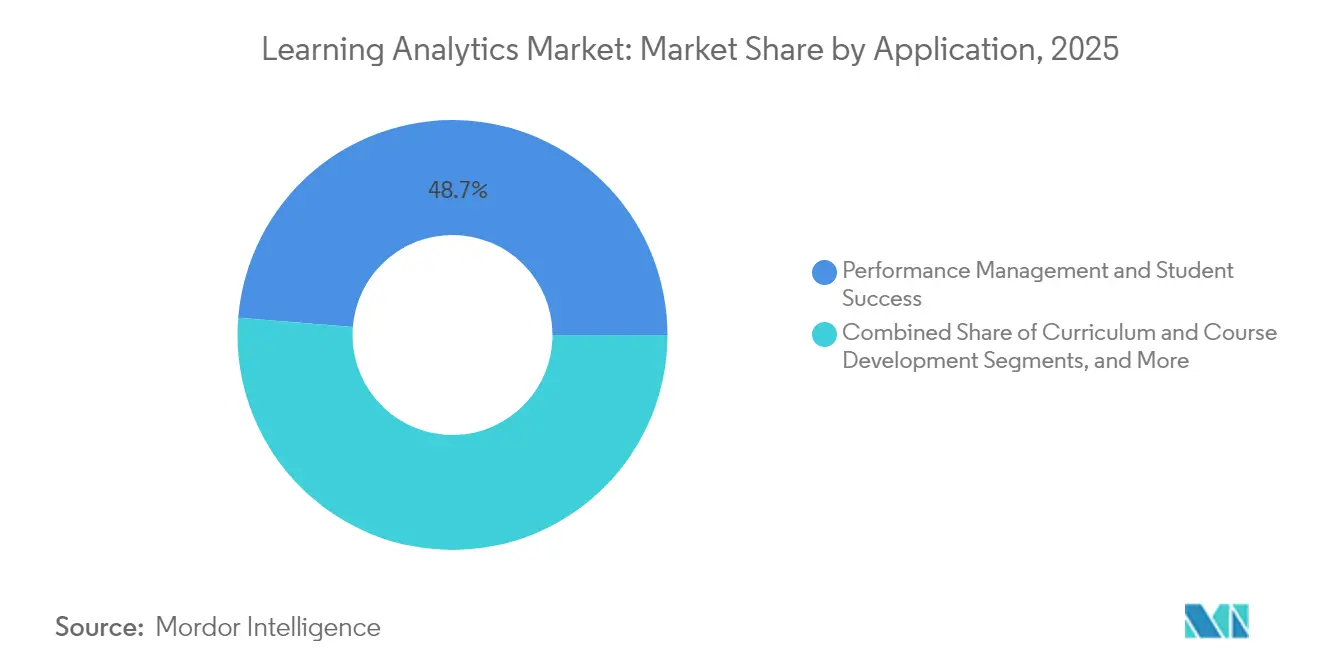
Retention Focus Holds, Curriculum Optimization ClimbsPerformance management applications held 48.73% share of the learning analytics market in 2025, underscoring the primacy of retention and graduation outcomes. Real-time dashboards grant advisors actionable visibility into engagement trends, enabling rapid outreach. Meanwhile, curriculum-development analytics should post a 21.23% CAGR, as administrators harness course-level insights to refine pedagogical design, reduce redundancy, and elevate learning efficiency.
Assessment analytics and adaptive testing complement both pillars, tailoring difficulty to individual competence and feeding rich data back into curriculum loops. Collectively, these use cases demonstrate how the learning analytics market evolves from reactive scorekeeping to proactive instructional design.
By End User:
Academic Core Persists as Enterprises AccelerateAcademic institutions generated 66.48% of 2025 revenue, benefiting from long-standing student information systems that provide dense data streams. Universities integrate learning analytics to meet accreditation requirements and boost brand standing. K-12 districts deploy similar tools to comply with accountability metrics and to personalize instruction.
Corporate learning analytics is gaining ground at 22.14% CAGR as firms link workforce analytics to productivity and retention. Large enterprises lead adoption through sophisticated talent-management suites, while small and midsize businesses tap cloud subscriptions for affordable insights. This expansion diversifies the learning analytics market and highlights its relevance beyond traditional classrooms.
Geography Analysis
North America Learning Analytics Market
North America kept its leadership with 38.12% share in 2025 owing to mature EdTech ecosystems, clear funding channels, and balanced privacy frameworks that foster trust. Federal initiatives such as the U-GAIN program channel resources into scalable solutions, encouraging institutions to embed analytics in daily operations. Canada’s provincial strategies echo this momentum, reinforcing regional dominance.
APAC Learning Analytics Market
Asia-Pacific represents the most dynamic arena with a 21.62% CAGR forecast. India’s ₹500 crore AI Centre of Excellence and China’s modernization policies funnel capital and policy support toward data-driven instruction. Markets such as Japan and South Korea contribute through early 5G adoption and high digital readiness. Despite heterogeneous regulations, the region’s demographic scale and government backing fuel sustained expansion of the learning analytics market.
Europe Learning Analytics Market
Europe keeps steady growth, propelled by GDPR-compliant solutions that reconcile analytics value with strict privacy mandates. The UK’s GBP 4 million (USD 5.43 million) AI teacher-support scheme illustrates policy-level confidence, while Germany and France fund institution-level digital transitions. Vendors able to demonstrate airtight compliance enjoy a clear advantage, reinforcing a specialized yet sizeable subsection of the learning analytics market.
Regulatory Landscape
Learning analytics deployments are governed by overlapping student-data privacy rules and fast-evolving AI governance. In Europe, the EU AI Act (Regulation 2024/1689) creates new transparency duties for AI systems that interact with learners, with obligations taking effect from August 2, 2026, such as informing users when they are engaging with AI and labeling AI-generated content; the Act also classifies certain education uses (for example, admissions, grading, and learner profiling) as high-risk, raising the bar for documentation and controls over the system lifecycle. In the United States, FERPA continues to shape school and vendor handling of education records, while states and districts add operational AI policy requirements, such as Ohio requiring public school districts, community schools, and STEM schools to adopt a formal AI use policy by July 1, 2026.
At the state level, emerging statutes tighten constraints on vendor data use, reflecting heightened sensitivity around generative AI training. California AB 1159 (2025-2026 session) proposes a Higher Education Student Information Protection Act (HESIPA) framework that includes prohibitions for EdTech operators on using student data to train generative AI systems, reinforcing a compliance pattern that extends beyond security to permitted-use limitations. Alongside regulation, technical standardization is becoming a compliance enabler, with ISO/IEC TR 9858:2026 (published January 2026) and ISO/IEC/IEEE 39274-1-1:2025 (xAPI-oriented JSON and REST API data model standardization) supporting more auditable, interoperable learning data practices across vendors and institutions.
Value Chain Analysis
The learning analytics value chain spans data generation, data transport and normalization, analytics and model development, application-layer workflows, and services that operationalize outcomes. Upstream data originates from learning management systems, assessment and proctoring tools, and student information systems, then flows through connectors and Learning Record Store-style repositories where events are standardized, governed, and prepared for analysis. Interoperability bodies play an outsized role at the integration layer: 1EdTech (formerly IMS Global) standards such as Caliper Analytics and EDU-API are used to structure secure data exchange and reduce custom integration effort, which is a frequent RFP requirement for institutions managing multi-vendor digital learning ecosystems.
Midstream value is created by analytics engines (descriptive through prescriptive), dashboarding and alerting layers, and governance features (consent, role-based access, audit trails) that allow use in regulated education settings. Downstream, professional services and managed services deliver implementation, data modeling, change management, and continuous optimization, especially where institutions lack analytics talent or need outcome evidence tied to retention and performance-management objectives. Bottlenecks concentrate around data interoperability gaps, privacy and security constraints, and the difficulty of demonstrating attributable learning impact; vendors that provide standards conformance, packaged integrations, and workflow-embedded measurement reduce friction across the chain and improve time-to-value.
Competitive Landscape
Consolidation defines current dynamics. Bain Capital’s USD 5.6 billion privatization of PowerSchool and KKR’s USD 4.8 billion purchase of Instructure inject capital for generative AI roadmaps and international reach. These moves raise entry barriers, but they also validate market potential, attracting fresh investment into specialized niches.
Platform leaders integrate student information systems, learning management, and analytics into unified suites. AI-powered personalization becomes a key differentiator, with conversational interfaces simplifying data interpretation for frontline educators. Mid-tier players contest white spaces such as XR-enhanced analytics and sector-specific compliance modules, ensuring the learning analytics market remains innovative despite moderate concentration.
Financial overreach can expose vulnerabilities; Anthology’s restructuring illustrates the risks of aggressive roll-up strategies without proportional revenue gains. This environment rewards disciplined execution, robust customer success models, and transparent privacy safeguards, shaping competitive contours through 2030.
Learning Analytics Industry Leaders
-
Domoscio
-
Unicon Inc
-
Blackboard Inc.
-
D2L Corporation
-
Instructure Inc.
- *Disclaimer: Major Players sorted in no particular order
Learning Analytics Market Companies Covered in this Report
- Instructure Inc. (Canvas)
- Blackboard Inc.
- D2L Corporation (Brightspace)
- Civitas Learning Inc.
- Hobsons Inc. (Naviance)
- Domoscio
- Unicon Inc.
- Watershed Systems
- BrightBytes Inc.
- Certica Solutions Inc.
- IBM Corporation
- Oracle Corporation
- Microsoft Corporation
- SAS Institute Inc.
- Google LLC (Education)
- PowerSchool Holdings Inc.
- Turnitin LLC
- Knewton (Wiley)
- Squirrel AI
- Apereo Foundation (OpenLRS, Sakai)
Market Opportunities and Future Outlook
A core whitespace sits in workflow-embedded outcomes measurement that reduces faculty and administrator burden while expanding the depth of analytics. For example, Boston College (May 2026) described implementing a Canvas-based outcome assessment approach that generates Program Learning Outcome analytics as a byproduct of normal grading, pointing to demand for designs that capture evidence without new data-entry steps. Similar institutional architectures that combine LMS activity with student information system records also highlight opportunities for vendors and service providers that can operationalize early-warning and intervention workflows across multiple systems, as illustrated by a University of Cape Town presentation (April 2026) describing an Early Warning System integrating Brightspace datasets with PeopleSoft records to produce predictive dashboards.
On the enterprise side, learning analytics products and services face visible demand for linking learning activity to capability outcomes and business KPIs, rather than participation metrics alone. D2L has publicly emphasized a roadmap approach for enterprise learning data programs (January 2026) that begins with data auditing and alignment, then moves toward AI-enabled personalization, reinforcing commercial opportunity for platforms that unify L&D data with HR and performance systems and provide governance suitable for regulated environments. At the same time, compliance-driven product gaps create near-term build-and-buy opportunity, including EU AI Act-aligned transparency and documentation for education-facing AI and state-level guardrails that restrict the use of student data for training generative models; providers that combine interoperability (for multi-vendor ecosystems) with auditable AI controls are positioned to win procurements where institutions want prescriptive interventions without increasing privacy risk.
Recent Industry Developments in Learning Analytics Market
- March 2026: Blackboard (formerly Anthology) completed a financial restructuring and emerged from Chapter 11, reintroducing itself as a debt-free company. The move refocused product and go-to-market priorities around core teaching and learning workflows and supported continued investment in AI-enabled capabilities relevant to learning analytics.
- July 2025: Anthology unveiled next-generation AI and immersive learning innovations in Blackboard. The announcement signaled deeper embedding of AI-driven experiences inside the LMS layer, increasing the amount and richness of learner interaction data available for analytics use cases such as student success and performance management.
- April 2024: Rise Up acquired Domoscio to integrate adaptive learning and personalized pathway technology into its platform portfolio. The deal accelerated convergence between learning experience delivery and analytics-driven personalization, strengthening vendor ability to package content, delivery, and measurement into a single commercial offer.
Learning Analytics Market Report Scope and Research Methodology
Market Definition and Coverage
For this study, the learning analytics market covers paid software and related services that capture learner activity data, analyze it, and present insights that improve learning outcomes and training decisions in education and workplaces.
Scope exclusions: We exclude stand-alone LMS platforms or content repositories when they do not have native analytics and reporting engines built in.
Segments Covered in This Report
- By Offerings
- Software
- Predictive Analytics Tools
- Descriptive and Diagnostic Dashboards
- Adaptive Learning Platforms
- Services
- Professional Services
- Managed Services
- Software
- By Deployment Mode
- On-Premise
- Cloud
- By Analytics Type
- Descriptive Analytics
- Predictive Analytics
- Prescriptive Analytics
- By Application
- Performance Management and Student Success
- Curriculum and Course Development
- Assessment and Adaptive Learning
- Recruitment, Marketing and Retention
- By End User
- Academia
- K-12 Schools
- Higher Education Institutions
- Corporate
- Large Enterprises
- Small and Medium Enterprises (SMEs)
- Academia
- By Geography
- North America
- United States
- Canada
- Mexico
- Europe
- Germany
- United Kingdom
- France
- Italy
- Spain
- Russia
- Rest of Europe
- Asia-Pacific
- China
- Japan
- India
- South Korea
- Australia and New Zealand
- Rest of Asia-Pacific
- South America
- Brazil
- Argentina
- Rest of South America
- Middle East and Africa
- Middle East
- Saudi Arabia
- United Arab Emirates
- Turkey
- Rest of Middle East
- Africa
- South Africa
- Nigeria
- Rest of Africa
- Middle East
- North America
Data Sources, Market Sizing, and Validation
Desk Research
Desk research starts with mapping the demand pool for digital learning and measurement, and then narrowing it to tools that are sold specifically for analytics. We rely on public statistics and standards to keep definitions consistent, such as UNESCO education indicators, OECD education data, the US National Center for Education Statistics (NCES), Eurostat ICT and education series, and the World Bank education and digital adoption indicators.
We also review company filings, investor presentations, product documentation, and reputable press to understand pricing direction, deployment shifts, and common buyer requirements (such as outcomes tracking, risk scoring, and engagement measurement). Patent databases are used selectively to understand where analytics features are evolving, and a paid subscription for company financials and news helps validate revenue disclosures and timing. This list is not exhaustive, and many other sources were referred to for data collection, validation, and research clarification.
Primary Interviews and Surveys
Primary work focuses on validating what buyers actually pay for, how contracts are structured, and which analytics functions are treated as separate products versus bundled features. We speak with solution providers, channel partners, higher education and K-12 stakeholders, corporate learning teams, and system integrators across major regions so assumptions from desk research can be corrected and then cross-checked before finalizing totals.
Distribution of primary research fieldwork respondents
| Company type | Respondent position | Region |
|---|---|---|
| Top tier: 26% | CXOs: 15% | APAC: 39% |
| Mid tier: 59% | Functional/Unit leaders: 29% | EMEA: 37% |
| Smaller Players: 15% | Managers: 56% | Americas: 24% |
Market-Sizing & Forecasting
Sizing is built using a top-down approach where education and corporate learning tech spending signals are reconstructed into an analytics-ready demand pool, and then filtered by adoption and monetization rates for learning analytics tools. The outputs are subsequently corroborated using selective bottom-up checks, such as sampled average subscription prices by institution or enterprise size, and supplier revenue splits where disclosures are available.
Key inputs used in the model include cloud versus on-premises mix, paid seat counts or learner volumes tied to learning platforms, typical contract length and renewal behavior, the share of analytics that is bundled versus sold as a module, and observed price progression for subscriptions and services. Where bottom-up views are incomplete, gaps are handled through ranges agreed in interviews, followed by conservative midpoint selection unless multiple signals support an aggressive case.
For forecasting, scenario analysis is used because adoption and pricing can move quickly as AI features become standard and procurement cycles tighten. Growth assumptions are carried forward only after they align with interview feedback on budget plans, feature roadmaps, and expected penetration in under-served regions.
Data Validation & Update Cycle
Before results are signed off, totals are checked against independent signals such as education ICT budgets, corporate training spend indicators, and observed subscription price ranges, and then outliers are investigated one by one. If a variance cannot be explained by scope, timing, or currency, we re-check the assumption chain and re-contact sources to confirm what changed.
A multi-step internal review is followed so unit logic, math, and narrative are consistent across regions. Reports are refreshed annually, with interim updates triggered by material events such as major policy shifts, demand shocks, or changes in common pricing models. Before delivery, an analyst performs a fresh pass so clients receive the latest updated view.
Mordor Intelligence's Learning Analytics Market Sizing Compared With Other Published Estimates
Published market sizes for learning analytics can vary a lot because the scope boundary is not always treated the same and pricing assumptions can be handled differently across studies. Timing also matters, since the year used for currency conversion, and whether subscriptions are counted on a recognized revenue basis or a contract value basis, can move the total.
A refresh-led gap shows up when price-per-user and cloud subscription uplift are updated more frequently, and when checks are run against buyer renewal cycles and bundled versus add-on module rates, which is how Mordor Intelligence keeps the model aligned to what is actually billed and recognized during the stated year.
Benchmark comparison
| Source | Market Size | Gaps in Research Methodology |
|---|---|---|
| Mordor Intelligence | USD 16.99 B (2026) | |
| Trade Journal A | USD 29.85 B (2025) | Uses a broader boundary labeled education and learning analytics, which can fold in adjacent education analytics and platform analytics revenues, and the earlier year also shifts currency timing versus later-year baselines. |
| Industry Newswire B | USD 35.50 B (2023) | Starts from a wider education analytics umbrella with a different base year, and the implied pricing and adoption path can include bundled analytics value that is not always priced as a separate learning analytics product. |
The spread in the table is mostly explained by how wide the definition is and how pricing is treated when analytics is bundled inside larger learning platforms. When scope is kept to paid learning analytics offerings and assumptions are refreshed around subscription pricing and renewals, the market total becomes easier to trace back to clear demand drivers and repeatable steps.
Key Questions Answered in the Report
What is the current size of the learning analytics market?
The learning analytics market was valued at USD 16.99 billion in 2026 and is projected to reach USD 43.87 billion by 2031.
Which segment dominates the learning analytics market?
Software platforms lead, holding 67.62% share in 2025, although services are expanding faster at a 22.52% CAGR.
How quickly is cloud adoption growing within the learning analytics industry?
Cloud deployments are forecast to advance at a 22.96% CAGR through 2031, outpacing on-premise growth as institutions favor scalable and cost-efficient models.
Which region offers the highest growth opportunity?
Asia-Pacific presents the fastest expansion with a 21.62% CAGR, supported by large-scale government investments in educational technology.
What are the main restraints facing the learning analytics market?
Strict privacy regulations and a global shortage of analytics talent are the two most significant challenges, collectively reducing forecast CAGR by an estimated 4.3 percentage points.
How is artificial intelligence shaping the future of learning analytics?
AI transforms analytics from descriptive reports into predictive and prescriptive tools, enabling proactive interventions, personalized content, and conversational dashboards that broaden educator adoption.