
Law Enforcement Software Market Size and Share
Market Overview
| Study Period | 2021 - 2031 |
|---|---|
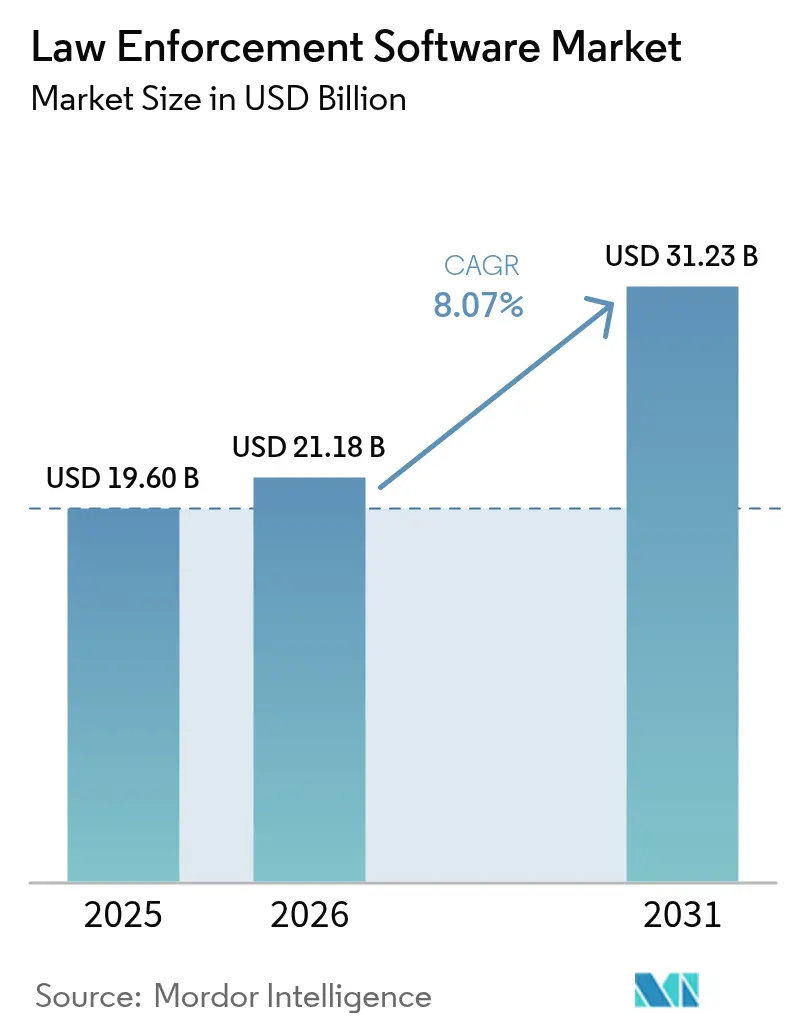
| Market Size (2026) | USD 21.18 Billion |
| Market Size (2031) | USD 31.23 Billion |
| Growth Rate (2026 - 2031) | 8.07 % |
| Fastest Growing Market | Asia Pacific |
| Largest Market | North America |
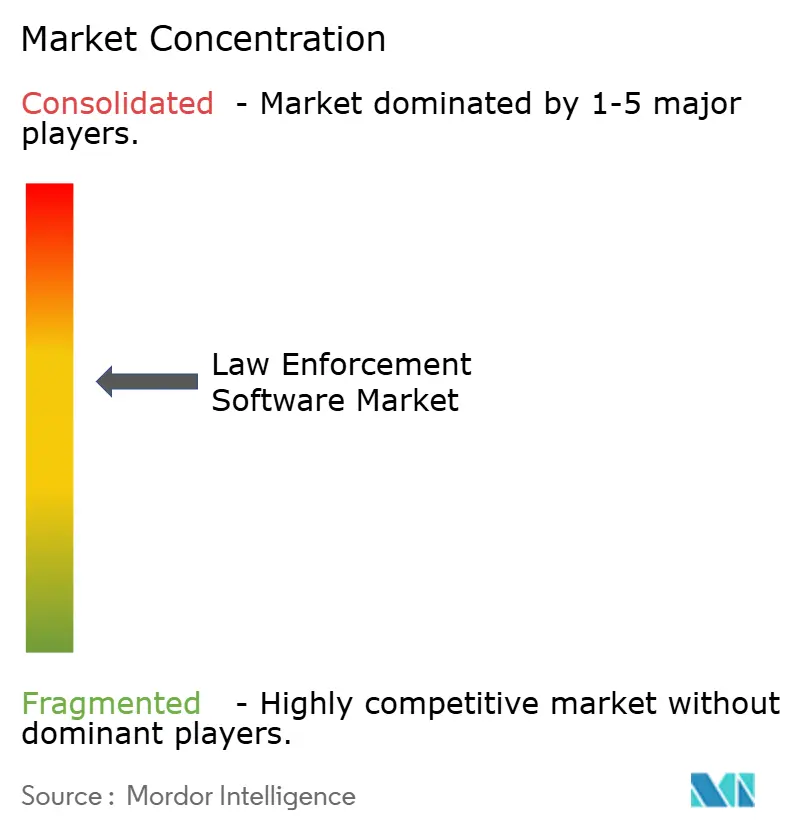
| Market Concentration | Medium |
Major Players *Disclaimer: Major Players sorted in no particular order Image © Mordor Intelligence. Reuse requires attribution under CC BY 4.0. | |
Law Enforcement Software Market Analysis by Mordor Intelligence
The law enforcement software market size is expected to grow from USD 19.60 billion in 2025 to USD 21.18 billion in 2026 and is forecast to reach USD 31.23 billion by 2031 at 8.07% CAGR over 2026-2031. Continued digitization of policing workflows, mounting data volumes and persistent staffing shortages are pushing public-safety agencies to invest in integrated platforms that automate dispatch, records and evidence administration. Federal stimulus such as the Edward Byrne Memorial Justice Assistance Grant, which assigns USD 419 million to technology improvements in 2025, is compressing replacement cycles and widening access for mid-sized departments.[1] At the same time, cloud-first mandates balanced with sovereign-data requirements are forcing suppliers to build region-specific hosting options that satisfy CJIS as well as EU localization rules. Convergence of predictive analytics, real-time crime centers and body-worn-camera ecosystems is expected to reward vendors delivering end-to-end suites rather than point products, thereby reshaping competitive dynamics over the next decade.
Key Report Takeaways
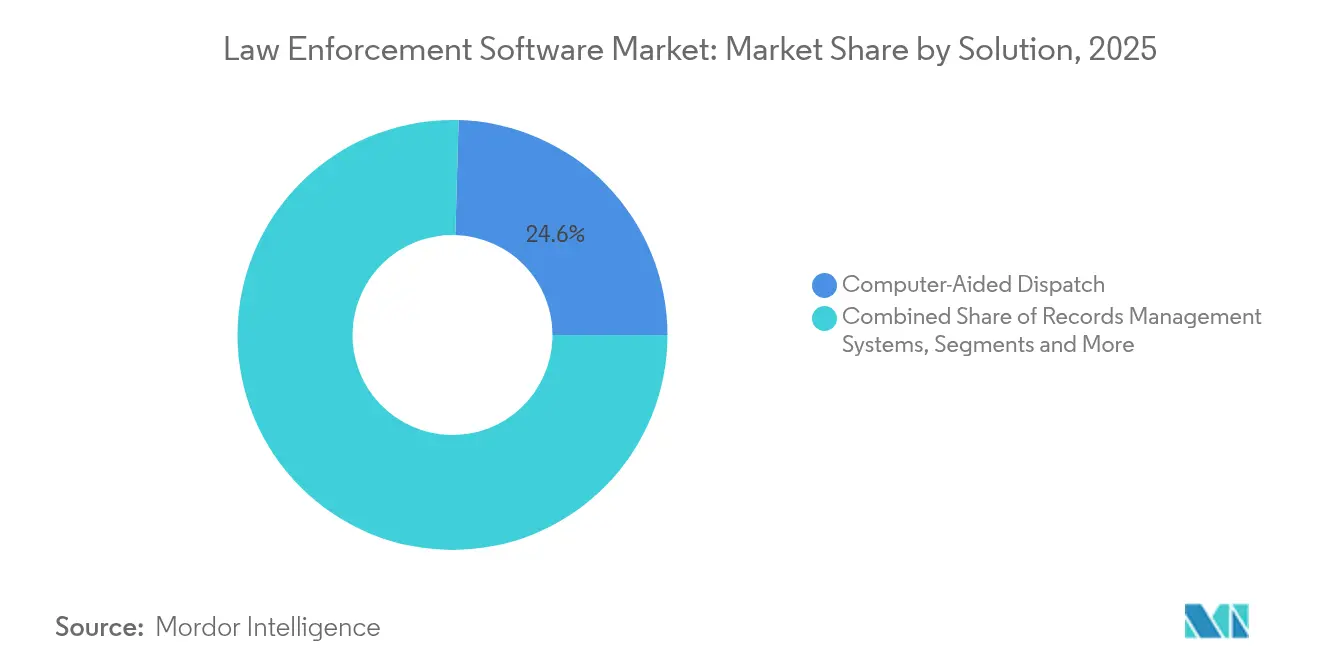
- By solution, computer-aided dispatch platforms led revenue with 24.55% in 2025, while predictive and crime-analytics offerings are projected to expand at a 9.45% CAGR to 2031.
- By deployment, on-premise models held 58.35% of the law enforcement software market share in 2025; cloud deployment is pacing a 10.25% CAGR through 2031.
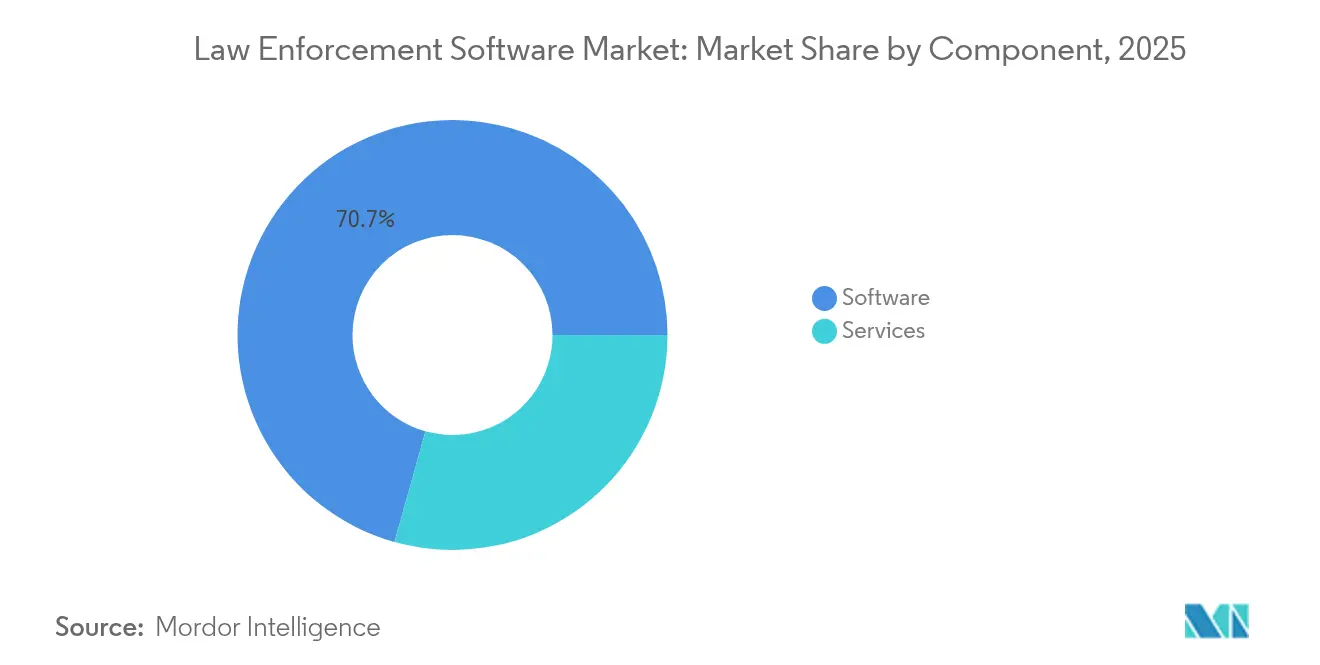
- By component, software captured 70.65% of the law enforcement software market size in 2025, whereas managed services are growing at 9.12% CAGR.
- By end-user, municipal and local agencies accounted for 45.95% of demand in 2025; federal and national police agencies represent the fastest-growing cohort with a 10.02% CAGR to 2031.
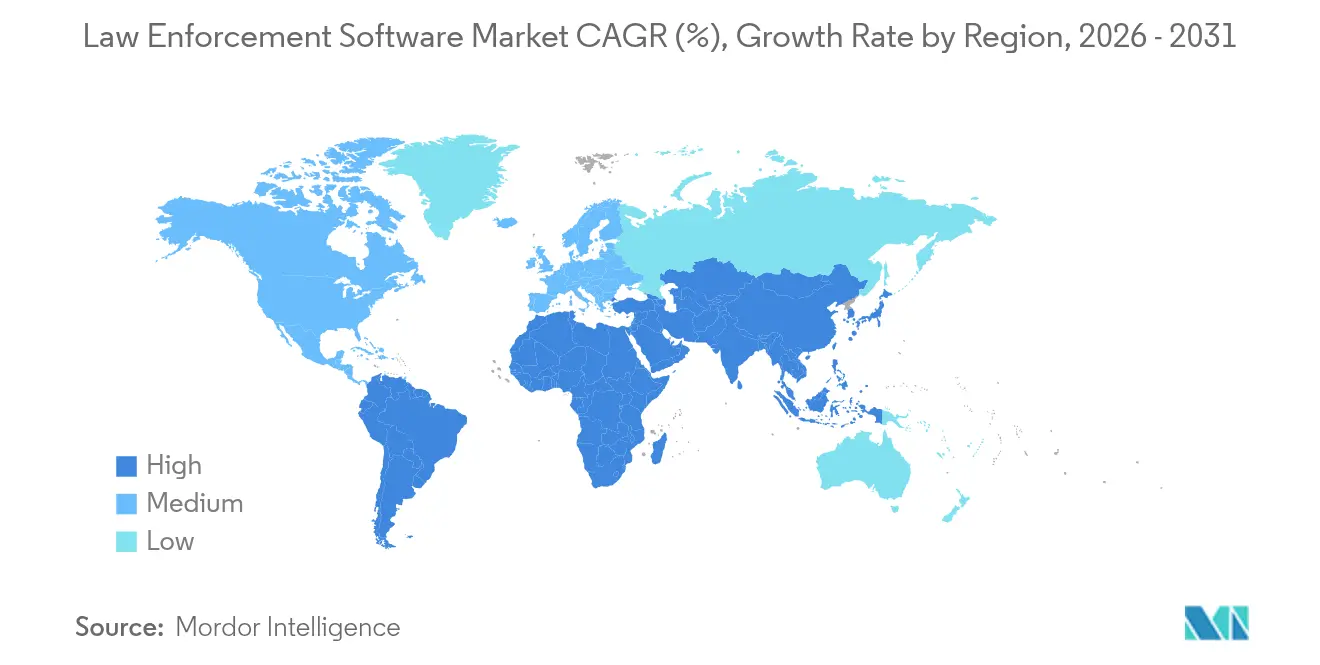
- By geography, North America commanded 36.85% of 2025 revenue, yet Asia-Pacific is on course for a 9.42% CAGR during 2026-2031.
Note: Market size and forecast figures in this report are generated using Mordor Intelligence’s proprietary estimation framework, updated with the latest available data and insights as of 2026.
Market Trends and Insights
Drivers Impact Analysis of Law Enforcement Software Market*
| Driver | (~) % Impact on CAGR Forecast | Geographic Relevance | Impact Timeline |
|---|---|---|---|
| Expansion of National Real-Time Crime Centers in North America | +1.2% | North America, spill-over to EU | Medium term (2-4 years) |
| Mandatory Body-Worn-Camera Evidence-Management Mandates in Europe | +0.9% | Europe core, adoption in APAC | Short term (≤ 2 years) |
| Federal Grant Acceleration for Cloud-First Public-Safety Platforms (U.S.) | +1.5% | North America, influence on global procurement | Short term (≤ 2 years) |
| Asia-Pacific Smart-City Spend Pivoting to Public-Safety Software | +1.1% | APAC core, early adoption in MEA | Medium term (2-4 years) |
| Inter-agency Data-Sharing Frameworks Boosting CAD/RMS Upgrades (U.K.) | +0.8% | Global, with early gains in UK, EU | Long term (≥ 4 years) |
| Digital-Evidence Backlogs Driving AI Video-Analytics Investments | +1.3% | Global | Short term (≤ 2 years) |
| Source: Mordor Intelligence | |||
Expansion of National Real-Time Crime Centers in North America
Real-time crime centers are evolving from reactive monitoring hubs into predictive-intelligence platforms that merge body-worn-camera streams, license-plate recognition and social-media feeds to deliver situational awareness within seconds. The Los Angeles Police Department’s deployment of premier CAD and Command Point mobile systems illustrates how large agencies centralize call-taking and field coordination. [2]Follow-on investments such as Motorola Solutions’ USD 12 million command-center order with the Las Vegas Metropolitan Police Department underscore the momentum behind integrated intelligence hubs. Federal incentives are amplifying uptake; the COPS Technology and Equipment Program allocated USD 247 million in 2024 to extend advanced command-center capabilities to smaller jurisdictions. As more centers embed AI models for pattern detection, agencies report double-digit gains in response precision and officer safety.
Mandatory Body-Worn-Camera Evidence-Management Mandates in Europe
European regulators now require comprehensive video workflows that link officer-worn devices with CJIS-compliant digital-evidence vaults. Puerto Rico’s expansion of Axon Body 4 cameras, featuring live-streaming and geolocation, demonstrates how functionality has shifted beyond accountability toward real-time officer support. New procurement frameworks in the United Kingdom for live facial-recognition modules further widen addressable demand, accelerating vendor innovation in automated redaction, transcription and metadata tagging. Competing suppliers are fast-tracking AI-assisted report-writing tools that can summarise multi-hour footage in minutes, freeing detectives to focus on investigative tasks.
Federal Grant Acceleration for Cloud-First Public-Safety Platforms (U.S.)
Washington’s cloud-first doctrine is reshaping procurement as agencies move mission systems to FedRAMP-authorized SaaS environments. The FBI’s USD 85 million contract for Criminal Justice Information Services operational services validates federal appetite for elastic compute that scales investigative workloads on demand. Complementing agency contracts, the Department of Homeland Security earmarked USD 836.1 million in its 2025 Science & Technology budget for advanced computing and information-security research that directly benefits public-safety software.[3] These allocations lower technical-risk perceptions, encouraging smaller municipalities to adopt cloud records-management platforms that stay online during hurricanes or wildfires.
Asia-Pacific Smart-City Spend Pivoting to Public-Safety Software
Smart-city budgets once dominated by traffic and environmental sensors now prioritise integrated public-safety stacks that unify video analytics, emergency-alerting and predictive policing. Japan’s Crime Nabi AI system achieved a 69% drop in metal-cable theft during international pilots, signalling regional leadership in machine-learning crime deterrence.[4]South Korea’s Incheon Free Economic Zone pairs intelligent CCTV with abnormal-sound detection to deliver always-on urban monitoring at scale.
Restraints Impact Analysis of Law Enforcement Software Market*
| Restraint | (~) % Impact on CAGR Forecast | Geographic Relevance | Impact Timeline |
|---|---|---|---|
| Fragmented Procurement Cycles in Municipal Agencies | -0.7% | Global, particularly acute in North America | Long term (≥ 4 years) |
| Data-Sovereignty Regulations Limiting Cross-Border SaaS Deployments | -1.1% | Europe core, expanding to APAC | Medium term (2-4 years) |
| Resistance to Legacy System Migration Among State Police Forces | -0.6% | North America and Europe | Long term (≥ 4 years) |
| Budget Volatility from Crime-Rate-Linked Allocations (Latin America) | -0.4% | Latin America, spill-over to MEA | Short term (≤ 2 years) |
| Source: Mordor Intelligence | |||
Fragmented Procurement Cycles in Municipal Agencies
City departments often operate discrete budgeting calendars for police, fire and emergency-medical services, forcing multi-year alignments before a comprehensive software upgrade can be approved. Joint-procurement models offer relief: CentralSquare Technologies delivered a consolidated CAD platform to Boulder Regional Emergency Telephone Service Authority that now services police, fire and EMS across five counties. Similarly, El Paso County’s scalable CAD deployment covering 39 public-safety entities allowed smaller districts to access enterprise-grade dispatch while sharing capital expense
Data-Sovereignty Regulations Limiting Cross-Border SaaS Deployments
Tightening localisation rules in the EU oblige vendors to store and process sensitive policing records within national borders, curbing the hyperscaler efficiencies that drive SaaS economics. The upcoming EU Cloud Services Scheme introduces assurance tiers that could bar non-EU-headquartered cloud providers from hosting law-enforcement workloads unless a local subsidiary maintains operational control. While the stipulations raise trust, they also compel suppliers to build region-pruned code repositories and separate support teams, diluting global R&D leverage.
*Our forecasts treat driver/restraint impacts as directional, not additive. The impact forecasts reflect baseline growth, mix effects, and variable interactions.
Law Enforcement Software Market Segment Analysis
By Solution:
CAD Leads While Predictive Analytics AccelerateThe computer-aided dispatch segment captured 24.55% of 2025 revenue, underscoring its centrality to incident routing and resource optimisation within the law enforcement software market size. Successive hardware refresh cycles and Next-Generation 911 mandates are renewing interest in GIS-rich CAD modules that integrate seamlessly with AVL, mobile data terminals and drone feeds. In parallel, predictive-analytics platforms are scaling at a 9.45% CAGR to 2031 as agencies pivot toward data-guided deployment models that anticipate hotspots a shift that is reshaping the broader law enforcement software market. Vendors are embedding machine-learning libraries directly inside CAD dashboards, allowing shift supervisors to see historical crime correlations alongside live call loads, narrowing response lags.
Growing appetite for integrated suites is also blurring traditional product boundaries. Motorola Solutions’ acquisition of RapidDeploy expanded its offering into cloud-native NG911 mapping and analytics, giving the firm cross-sell latitude across its radio and body-camera customer base. Evidence-management, facial-recognition and digital-forensics modules are being folded into single license agreements, reducing stitching costs for buyers while increasing stickiness for providers.

By Deployment Mode:
Cloud Migration Accelerates Despite On-Premise DominanceOn-premise installations retained 58.35% of the law enforcement software market share in 2025, a testament to entrenched concerns over data-control and air-gapped integrations with legacy radio networks. Yet cloud instances are registering a 10.25% CAGR, propelled by shrinking capital budgets and the perception that FedRAMP-high authorisations now meet or exceed many local security benchmarks. This switch is enlarging the addressable law enforcement software market as small agencies adopt subscription models that once seemed out-of-reach. Disaster resiliency is another catalyst: the New Orleans Police Department’s move to a cloud-native RMS maintained continuity throughout the 2024 hurricane season, reinforcing cloud’s operational case among hurricane-prone states.
Hybrid architectures have emerged as an interim waypoint. Sensitive evidence files remain at the edge under agency control, while SaaS dashboards supply analytics, workflow automation and mobile accessibility. Vendors are deploying “sovereign cloud” regions with geo-fenced support teams to appease EU watchdogs, although certification cycles still stretch procurement timelines. Over the forecast horizon, machine-learning inference conducted at the edge combined with heavy-compute model training in the cloud is expected to normalise hybrid topologies across the law enforcement software market.
By Component:
Software Dominance Faces Services Growth ChallengeSoftware licences and subscriptions represented 70.65% of 2025 spend, reflecting historical capital-outlay patterns across the law enforcement software industry. However, managed-services revenue is outpacing licences at a 9.12% CAGR as departments outsource configuration, patching and AI-model tuning to domain specialists. This swing aligns with Tyler Technologies’ strategy to drive recurring revenue above 90% by 2030 through cloud migration and outcome-based support contracts. Professional-services demand is further buoyed by requirements to migrate decades of RMS data into CJIS-compliant cloud stores without disrupting case workflows.
Training and change-management engagements are now bundled into multi-year agreements, reflecting recognition that algorithmic efficacy depends on officer adoption. Cybersecurity advisory services are likewise surging as ransomware attacks increasingly target dispatch centers and evidence vaults. Suppliers offering turnkey security operation centers alongside core applications differentiate themselves in bid processes that score heavily on resilience metrics.
By End-User Agency:
Municipal Leadership Meets Federal GrowthMunicipal departments remain the largest buyer group, contributing 45.95% of 2025 revenue as community policing and emergency-response functions sit closest to citizens, making modernization politically salient. Their focus on body-camera mandates and digital-evidence backlogs keeps steady pressure on budgets, cementing their central role in the law enforcement software market. Conversely, federal and national police agencies are pacing the fastest growth at 10.02% CAGR to 2031, driven by cross-border intelligence sharing and counter-terror operations that favour high-end analytics. Palantir’s USD 650 million award to supply big-data capabilities to a federal client reflects escalating appetite for mission-level platforms.
State and provincial constabularies occupy a middle ground, refreshing highway-patrol and forensic-lab systems while collaborating in regional data-lakes that spread capital costs. Tribal and special-jurisdiction forces are increasingly adopting multi-tenant SaaS to avoid building duplicate infrastructure. As cooperative purchasing agreements mature, vendors capable of multi-agency instance management with granular role-based access controls stand to win larger footprints across the law enforcement software market.
Geography Analysis
North America Law Enforcement Software Market
North America continues to anchor the law enforcement software market with 36.85% revenue share in 2025. Federal funding streams such as the Edward Byrne Memorial Justice Assistance Grant funnel USD 419 million in 2025 into technology upgrades for smaller departments, ensuring that even rural agencies access enterprise-grade solutions. The region’s well-developed integrator ecosystem accelerates complex rollouts, while CJIS cloud-authorisation frameworks give procurement officers confidence to migrate core workloads.
APAC Law Enforcement Software Market
Asia-Pacific is the fastest-growing territory with a 9.42% CAGR projected through 2031. Japan’s Crime Nabi pilot and South Korea’s Incheon Free Economic Zone illustrate how smart-city budgets earmark predictive policing and AI-enhanced surveillance. Regional governments bundle public-safety procurement with broader digital-governance initiatives, unlocking multi-year financing and fostering public-private partnerships. China’s mass-deployment of AI-assisted video analytics creates enormous scale for algorithm refinement, while India’s cloud-first e-governance schemes entice SaaS vendors with multi-state roll-out opportunities. Australia and New Zealand focus on evidence-management modernisation to counter rising cyber-enabled crime, further enlarging regional demand.
Europe Law Enforcement Software Market
Europe records steady albeit more measured growth as data-sovereignty and privacy mandates dictate deployment architectures. The United Kingdom’s GBP 20 million framework for live facial-recognition underscores appetite for advanced analytics, yet stipulates stringent audit and bias-mitigation requirements. Germany’s leadership in shaping the EU Artificial Intelligence Act informs vendor roadmaps, compelling them to embed explainability into predictive models from inception. Sovereign-cloud build-outs by hyperscalers combine local data residency with elastic compute, encouraging agencies previously bound to on-premise servers to experiment with hybrid deployments.
Regulatory Landscape
Regulation in law enforcement software focuses on security controls for criminal justice information, governance for AI use, and cross-border data exchange requirements. In the United States, the FBI CJIS Security Policy (v6.0, dated December 27, 2024) continues to shape technical and procedural safeguards for CAD/RMS and digital-evidence deployments, while DOJ grant-linked programs such as BJA body-worn camera funding reinforce auditable evidence-management workflows through defined program requirements and deadlines (FY 2025). At the state level, California SB-524 (2025-2026) points to a broader shift toward mandated AI audit trails, disclosures, and retention controls for AI-assisted report writing, expanding compliance scope beyond traditional cybersecurity.
In Europe, regulatory pressure is increasingly tied to interoperability and AI controls. The European Commission adopted Implementing Decision (EU) 2026/1065 on May 18, 2026, setting technical rules for automated search and exchange of police records through EPRIS under Regulation (EU) 2024/982, which increases the importance of standardized data models and exchange interfaces in police-record platforms. Separately, EU AI Act implementation guidance issued on May 19, 2026 for high-risk law enforcement AI (Annex III) reiterates requirements such as fundamental rights impact assessments and data-governance obligations, influencing vendor product design for video analytics, facial recognition, and investigative decision-support tools.
Value Chain Analysis
The value chain runs from data capture and edge devices (body-worn cameras, in-vehicle systems, drones and sensors) to mission applications (CAD, RMS, case management, jail management, evidence and analytics), through hosting and platform layers (on-premise stacks, FedRAMP-authorized SaaS, and sovereign-cloud regions). Services then operationalize deployments through integration, migration, managed services, training, and cybersecurity. Integrated platform providers bundle multiple links in this chain to reduce stitching costs for agencies, tying call-taking and dispatch data to evidence vaults and analytics used by real-time crime centers. They also increasingly pair software upgrades with multi-year support to address staffing shortages and sustain ongoing security patching.
Downstream procurement and assurance requirements have become a prominent gate, especially for federal and federally influenced buying. In March 2025, the GSA awarded a USD 919.7 million, 10-year SCRIPTS blanket purchase agreement to nine companies to support supply chain risk monitoring, highlighting the emphasis on supplier vetting and cybersecurity posture in public-sector acquisition. At the program level, large contracts such as the FBI task order awarded to Leidos in July 2025 for Next Generation Identification modernization, and subsequent 2026 awards and agreements cited for Palantir and Tyler Technologies, show how prime contractors, hyperscalers (for example, AWS in county-level corrections deployments), and specialist vendors (recording/logging, SIGINT, analytics) combine to deliver end-to-end outcomes. Software bill of materials and related dependency tracking are also emerging as recurring requirements for secure delivery and sustainment.
Competitive Landscape
Competitive intensity remains moderate as diversified conglomerates, mid-market specialists and AI-native start-ups vie for wallet share across the law enforcement software market. Motorola Solutions leverages an end-to-end portfolio spanning radios, body-cams and software, delivering USD 2.5 billion in Q1 2025 revenue and adding RapidDeploy’s NG911 mapping suite to deepen its cloud stack. Platform consolidation persists as agencies favour integrated environments: Tyler Technologies aims for USD 3.6–3.8 billion annual revenue by 2030 via cloud migration and expanded managed-services penetration.
Advanced-analytics specialists retain a moat in mission-level deployments. Palantir’s USD 650 million federal contract underscores demand for graph analytics and data-fusion at petabyte scale. Rather than building competing stacks, infrastructure providers form alliances: Oracle’s partnership with Palantir places AI accelerators onto Oracle Cloud Infrastructure, packaging compute, storage and analytics into a single procurement line. Emerging disruptors differentiate through mobile-first UX and voice-driven report writing, yet face rising certification costs that favour capital-rich incumbents. Cybersecurity posture is now a bid-critical differentiator; suppliers offering built-in zero-trust frameworks and sovereign-cloud endpoints command premium price points.
Acquisition pipelines remain active as strategic buyers seek best-of-breed point solutions that close functional gaps. Deals concentrate in evidence-management, officer-wellness analytics and automated transcription where innovation cycles move faster than internal R&D budgets. As platformisation advances, the law enforcement software market is expected to tilt toward fewer, broader ecosystems linked by open APIs, while niche vendors anchor themselves through patented AI models or domain-specific data sets.
Law Enforcement Software Industry Leaders
-
IBM Corporation
-
Motorola Solutions, Inc.
-
Hexagon AB
-
Axon Enterprise Inc.
-
Palantir Technologies
- *Disclaimer: Major Players sorted in no particular order
Law Enforcement Software Market Companies Covered in this Report
- Motorola Solutions Inc.
- Hexagon AB
- Axon Enterprise Inc.
- IBM Corporation
- Palantir Technologies
- Oracle Corporation
- Accenture plc
- ESRI
- Tyler Technologies Inc.
- CentralSquare Technologies
- NICE Ltd.
- Genetec Inc.
- Mark43 Inc.
- Omnigo Software
- Nuance Communications Inc.
- Cisco Systems Inc.
- Qognify Inc.
- Benchmark Analytics
- Flock Safety
- RapidDeploy Inc.
- CivicEye
- JusticeTrax
- Safariland Group (Digital division)
- Forensic Logic
Market Opportunities and Future Outlook
Opportunities concentrate on modernization programs that require integration across CAD/RMS, case management, and evidence, along with tighter procurement governance for surveillance and AI-enabled tools. In the United States, the DOJ COPS FY 2026 Technology and Equipment Program sets up to USD 401.4 million in noncompetitive, invitational funding with a July 23, 2026 deadline, creating a near-term channel for agencies to fund interoperable communications and related technology upgrades that can pull through software platforms. Separately, the FY 2026 NIBIN Modernization Program, which targets replacement of ballistic imaging technology at 194 existing sites, supports demand for connected investigative workflows where evidence intake, chain of custody, and analytics need to integrate with case management and discovery timelines.
Outside the United States, large-scale policing technology programs and tightening procurement controls create whitespace for vendors that can deliver resilient architectures, structured data governance, and auditable AI. In Australia, the Audit Office of New South Wales reported in May 2026 that the Police Technology Program timeline has slipped, with phase 1 delivery set for June 2029 and phase 2 for June 2031, alongside additional capital and recurrent funding needs. This reinforces the market need for phased migrations, large-scale data conversion, and long-duration managed services. At the city level, Berkeley approved Surveillance Use Policies for Community Video Streams and Investigative Software in June 2026, reflecting a broader trend toward competitive procurement frameworks and explicit use-policy compliance, which favors software vendors that can package configuration controls, reporting, and audit logs. Security-by-design procurement is also becoming more explicit, with the Netherlands publishing General Security Requirements for Central Government Contracts (ABRO) 2026 and California issuing Executive Order N-5-26 in April 2026 on Trusted AI Procurement, both increasing demand for demonstrable privacy, cybersecurity, and civil-liberties safeguards embedded into law enforcement software acquisition and operations.
Recent Industry Developments in Law Enforcement Software Market
- June 2026: Motorola Solutions announced a definitive agreement to acquire D-Fend Solutions, adding counter-drone technology to its public-safety portfolio. The acquisition expands the set of mission systems that can be integrated into command-center workflows, linking incident response with airspace threat detection and mitigation. It also underscores how agencies are consolidating purchases around fewer vendors across dispatch, evidence, analytics, and emerging threat domains.
- February 2026: Motorola Solutions received FedRAMP High authorization for its SVX body-worn assistant and for its CommandCentral DEMS cloud digital evidence management system. The authorization improves eligibility for federal and federally influenced procurements where FedRAMP is a gating requirement for cloud-hosted evidence and AI-adjacent workflows. It also increases competitive pressure on vendors to meet higher assurance baselines for voice, video, and evidence processing in SaaS environments.
- October 2024: Motorola Solutions launched capabilities connecting law enforcement to real-time 9-1-1 intelligence to improve response decisions during active incidents. The release strengthens integration between NG911 data, dispatch operations, and field response, reinforcing demand for interoperable mappings, location context, and data-sharing across agencies. It also aligns with the market shift toward end-to-end suites that shorten the path from call intake to case outcomes.
Law Enforcement Software Market Report Scope and Research Methodology
Market Definition and Coverage
For this study, the market covers software platforms used by law enforcement agencies to run day-to-day operations, manage records and incidents, dispatch resources, analyze data, and handle evidence, whether deployed on-premise or in the cloud.
Scope exclusions: We exclude general IT hardware and connectivity, and we also exclude non-law-enforcement public safety spending that is not purchased for policing workflows.
Segments Covered in This Report
- By Solution
- Records Management Systems
- Computer-Aided Dispatch (CAD)
- Jail Management
- Evidence / Digital Evidence Management
- GIS / Mapping
- Emergency Response
- Video Analytics and Facial Recognition
- Mobile / Field Reporting
- Predictive and Crime-Analytics Platforms
- By Deployment Mode
- Cloud
- On-Premise
- Hybrid
- By Component
- Software
- Services
- By End-User Agency
- Federal and National Police
- State and Provincial Police
- Municipal / Local Agencies
- Special-Jurisdiction and Tribal Forces
- By Geography
- North America
- United States
- Canada
- Mexico
- South America
- Brazil
- Argentina
- Rest of South America
- Europe
- Germany
- United Kingdom
- France
- Italy
- Spain
- Rest of Europe
- Asia Pacific
- China
- Japan
- India
- South Korea
- Australia
- New Zealand
- Rest of Asia Pacific
- Middle East and Africa
- Middle East
- Saudi Arabia
- United Arab Emirates
- Turkey
- Rest of Middle East
- Africa
- South Africa
- Nigeria
- Rest of Africa
- Middle East
- North America
Data Sources, Market Sizing, and Validation
Desk Research
Desk research starts by mapping what agencies buy and how budgets are allocated across public safety IT, then aligning that with commonly procured policing software categories. Public sources such as the US Bureau of Justice Statistics, FBI publications, and Department of Homeland Security and DOJ program pages are used to identify demand signals tied to modernization and compliance requirements.
We also reviewed procurement and spending signals that show what is actually being purchased, using examples such as SAM.gov postings, the EU TED tenders portal, and selected national open data procurement sites. Company filings, investor presentations, reputable press, and association websites were used to confirm product coverage, deployment shifts, and pricing logic for subscriptions versus perpetual licenses. Where needed, we referenced paid subscriptions for company financials and intelligence, news and financials, patent databases, and global contracts and tenders to cross-check timelines and adoption patterns. The above list is illustrative only, and many other sources were also consulted for data collection, validation, and clarification.
Primary Interviews and Surveys
Primary work was used to check what agencies prioritize, how deployment decisions are made, and how software budgets move between new buying and renewals. We spoke with a mix of solution implementers, agency-side users, and channel partners across the Americas, EMEA, and APAC, so gaps in public data could be closed and assumptions could be confirmed before finalizing the model.
Distribution of primary research fieldwork respondents
| Company type | Respondent position | Region |
|---|---|---|
| Top tier: 30% | CXOs: 21% | APAC: 43% |
| Mid tier: 48% | Functional/Unit leaders: 35% | EMEA: 32% |
| Smaller Players: 22% | Managers: 44% | Americas: 25% |
Market-Sizing & Forecasting
Sizing starts from a top-down build where public safety and justice IT spending is reconstructed by region, then filtered down using software-specific allocation shares and adoption rates that were checked in interviews. To keep results grounded, we corroborate totals with selective bottom-up approximations, such as sampled agency counts by jurisdiction, typical seat or user coverage, and average contract value ranges for core policing platforms.
Key inputs that shaped the model include procurement activity trends for RMS and CAD replacements, the pace of cloud migration (hybrid versus cloud-first), the mix shift between subscription and perpetual licensing, implementation and maintenance intensity, and the number of agencies by size band that are actively modernizing. We also considered how compliance and data governance needs influence refresh cycles and add-on module uptake, particularly for evidence handling and analytics.
For forecasting, scenario analysis was used so the outlook can reflect different budget environments and rollout speeds that experts pointed to, rather than relying on a single straight-line curve. Where bottom-up evidence was thin for smaller jurisdictions, we filled gaps using regional averages that were adjusted for agency density and typical procurement patterns, then rechecked those adjustments with respondents who sell or implement into those accounts.
Data Validation & Update Cycle
Validation is done through triangulation across model outputs, procurement signals, and interview feedback, so no single input drives the total by itself. Outliers are flagged when implied spend per agency or implied contract values drift away from what is seen in tenders, filings, and interviews, and then the assumptions are revisited.
A multi-step review is followed before sign-off, where another analyst checks calculations, unit consistency, and region-level reasonableness. Reports refresh annually, and interim updates are made when material events change budget cycles, deployment approaches, or buying behavior. Before delivery, a fresh final pass is performed so clients receive the most current view available at the time.
Mordor Intelligence's Law Enforcement Software Market Size Compared Against Other Published Estimates
Published market estimates for law enforcement software often disagree because the scope can shift in small but important ways, and then pricing and timing assumptions amplify the gap. Differences also come from whether renewals are counted the same way as new deployments, and how cloud subscriptions are annualized across multi-year contracts.
A major gap driver is whether services and implementation are counted alongside software, and Mordor Intelligence treats services only when they are directly tied to law enforcement platform deployment and ongoing support, rather than broad consulting or unrelated public safety IT work.
Benchmark comparison
| Source | Market Size | Gaps in Research Methodology |
|---|---|---|
| Mordor Intelligence | USD 21.18 B (2026) | |
| Regional Consultancy A | USD 21.30 B (2025) | Uses an earlier base year and tends to bundle broader services around public safety digitization, which can lift the total versus a tighter policing-platform spend view. |
| Trade Journal B | USD 7.55 B (2025) | Appears closer to a narrower police software subset and can exclude adjacent categories such as dispatch, evidence workflows, or agency-wide platforms, which reduces the reported value. |
The table shows that the spread is mostly explained by what gets counted as in-scope spend and how subscriptions and multi-year contracts are translated into annual revenue. By keeping the inputs traceable to adoption, procurement signals, and realistic contract structures, the final number stays practical to interpret and repeat over time.
Key Questions Answered in the Report
What is the current valuation of the law enforcement software market?
It is valued at USD 21.18 billion in 2026 and is projected to reach USD 31.23 billion by 2031, reflecting an 8.07% CAGR.
Which solution type holds the largest share of spending?
Computer-aided dispatch platforms lead with 24.55% of 2025 revenue, underscoring their role as the operational backbone for emergency response coordination.
Why are agencies moving to cloud deployment even though on-premise still dominates?
Cloud platforms cut capital expense, offer built-in disaster resilience and now meet CJIS and sovereign-cloud compliance, driving a 10.25% CAGR despite a 58.35% on-premise base.
Which region is growing fastest and why?
Asia-Pacific is expanding at a 9.42% CAGR thanks to smart-city programmes that integrate AI-powered surveillance, predictive policing and urban-management applications.
How fragmented is the competitive landscape?
The market receives a concentration score of 2 because the top ten vendors hold under 30% of revenue, leaving room for specialised analytics and SaaS entrants.
What funding sources are most influential for U.S. agencies?
Federal programmes like the Edward Byrne Memorial Justice Assistance Grant and DHS Science & Technology budgets inject hundreds of millions of dollars annually into technology modernisation.