
Market Overview
| Study Period | 2020 - 2031 |
|---|---|
| Forecast Data Period | 2026 - 2031 |
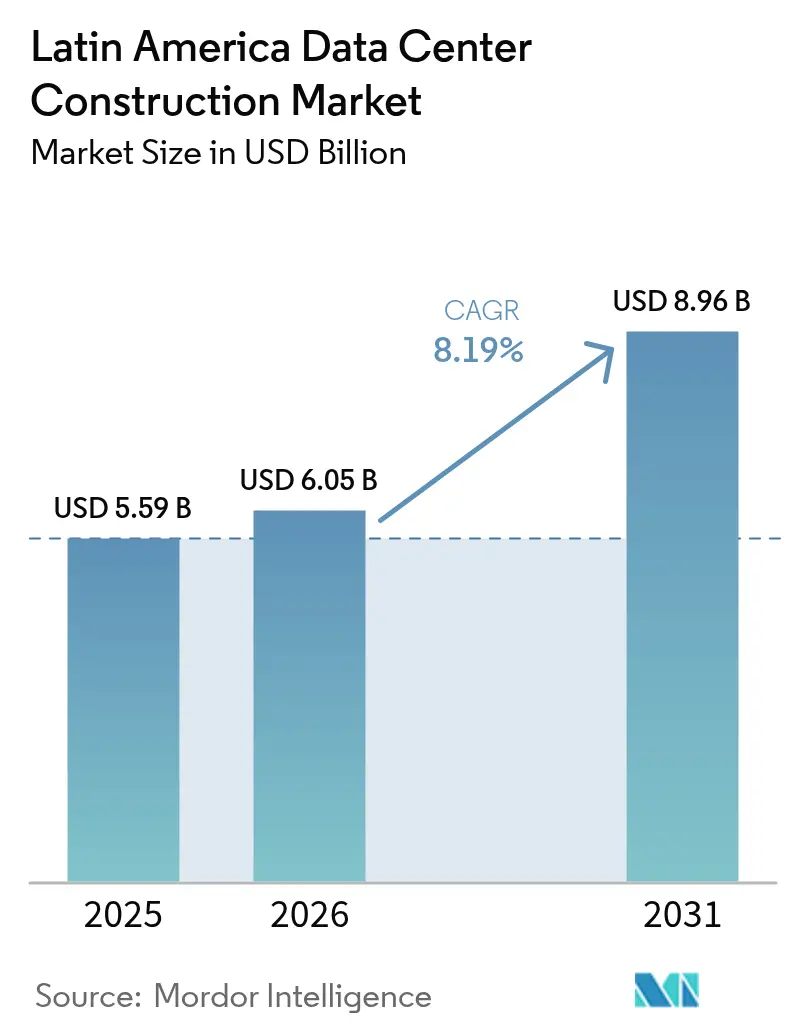
| Base Year Market Size (2025) | USD 5.59 Billion |
| Market Size (2026) | USD 6.05 Billion |
| Market Size (2031) | USD 8.96 Billion |
| Growth Rate (2026 - 2031) | 8.19% CAGR |
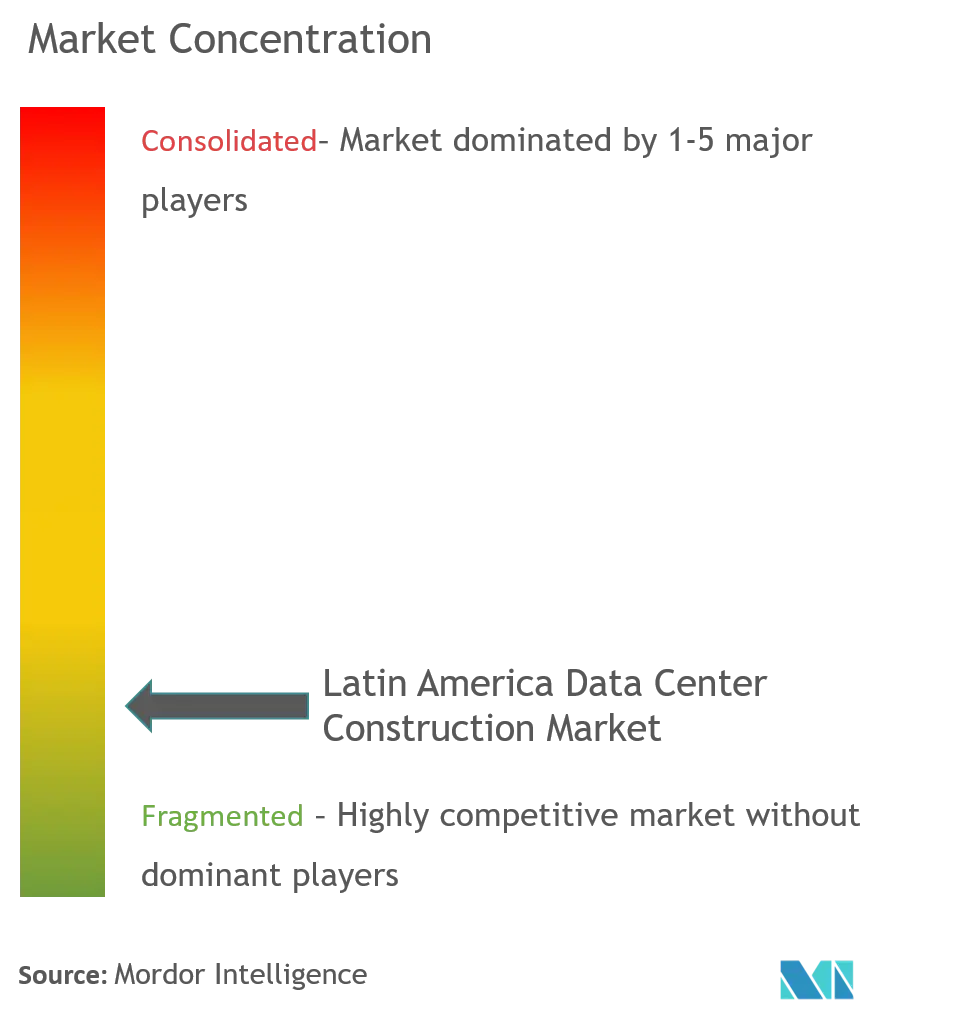
| Market Concentration | Low |
Major Players *Disclaimer: Major Players sorted in no particular order Image © Mordor Intelligence. Reuse requires attribution under CC BY 4.0. | |
Latin America Data Center Construction Market Analysis by Mordor Intelligence
The Latin America Data Center Construction market size is expected to grow from USD 5.59 billion in 2025 to USD 6.05 billion in 2026 and is forecast to reach USD 8.96 billion by 2031 at 8.19% CAGR over 2026-2031. Robust investment momentum stems from sovereign-cloud mandates, hyperscale campus build-outs by United States cloud majors, and mounting artificial-intelligence workloads that require specialized, high-density facilities. Brazil leads regional spending with 40% of total 2024 investments, while Mexico’s Querétaro corridor attracts fresh capital thanks to proximity to U.S. demand and state incentives. Mechanical infrastructure dominated 2024 spending at 38% because tropical heat loads elevate cooling requirements, yet IT infrastructure posts the quickest gains at an 8.52% CAGR through 2030. Tier III sites prevailed with 62% share in 2024, but Tier IV projects advance at an 8.90% CAGR as hyperscalers insist on fault-tolerant uptime. Supply-chain bottlenecks and grid constraints lengthen project cycles; however, sweeping deregulation in Chile and abundant renewable-energy opportunities across Brazil, Chile, and Colombia sustain a positive investment outlook.
Key Report Takeaways
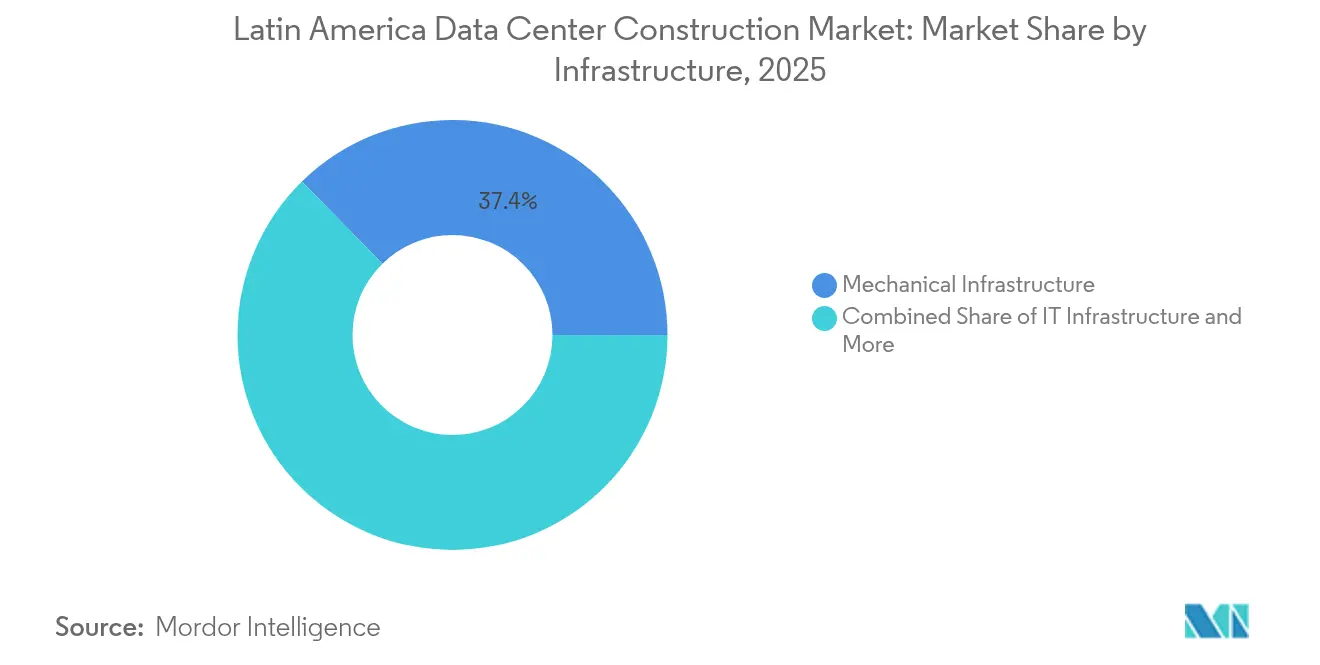
- By infrastructure, mechanical systems led with 37.35% of the Latin America Data Center Construction market share in 2025
- By tier standard, Tier III commanded 61.10% share of the Latin America Data Center Construction market size in 2025
- By end-user industry, IT and telecommunications held 48.40% of the Latin America Data Center Construction market share in 2025
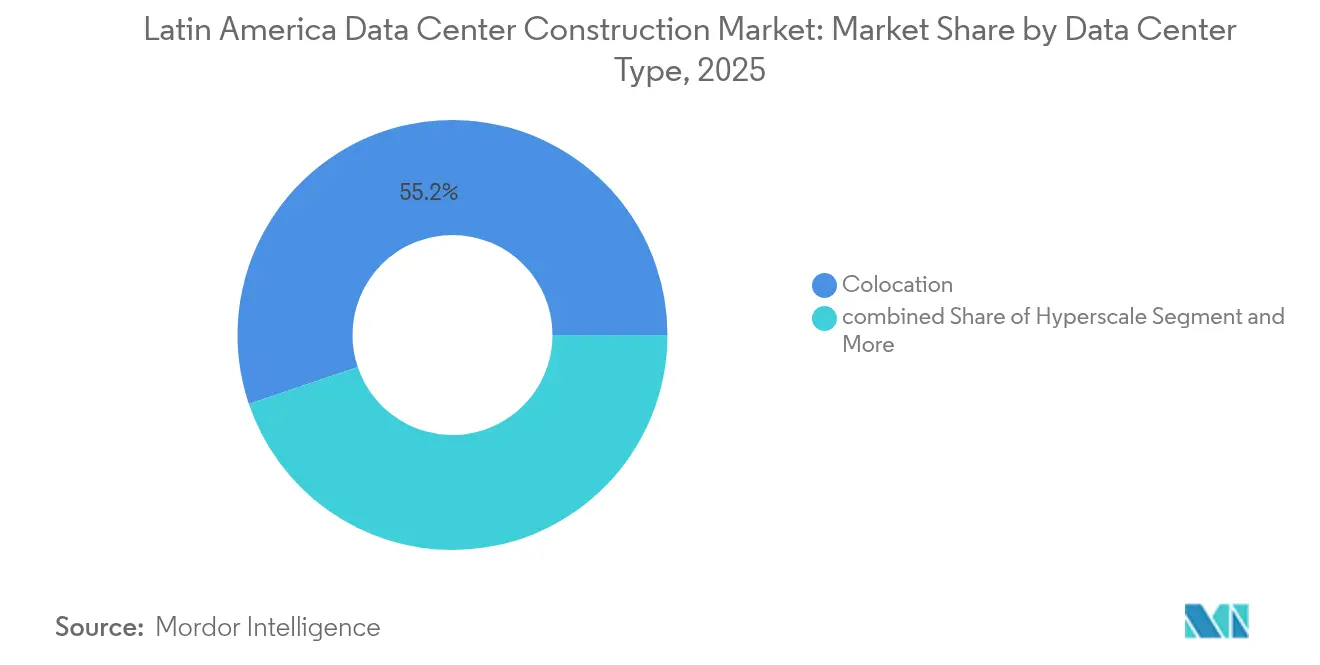
- By data center type, colocation facilities captured 55.20% of the Latin America Data Center Construction market size in 2025
Note: Market size and forecast figures in this report are generated using Mordor Intelligence’s proprietary estimation framework, updated with the latest available data and insights as of 2026.
Latin America Data Center Construction Market Trends and Insights
Drivers Impact Analysis*
| DRIVER | (~) % IMPACT ON CAGR FORECAST | GEOGRAPHIC RELEVANCE | IMPACT TIMELINE |
|---|---|---|---|
| Accelerating cloud, AI and big-data workloads | +2.1% | Brazil, Mexico, Chile | Medium term (2-4 years) |
| Hyperscale campus build-outs by U.S. cloud majors | +1.8% | Brazil, Mexico, Colombia | Short term (≤ 2 years) |
| 5G-driven edge-DC demand in secondary metros | +1.4% | Brazil, Mexico, Colombia, Peru | Long term (≥ 4 years) |
| Sovereign-cloud and data-residency regulations | +1.6% | All LATAM countries | Medium term (2-4 years) |
| Power-purchase agreement availability for renewables | +0.9% | Brazil, Chile, Colombia | Long term (≥ 4 years) |
| Modular and prefabricated construction adoption | +0.7% | Brazil, Mexico | Short term (≤ 2 years) |
| Source: Mordor Intelligence | |||
Accelerating cloud, AI and big-data workloads
Artificial-intelligence applications now demand three to five times the power density of legacy computing, compelling operators to redesign thermal architectures and electrical topologies. Microsoft’s USD 2.7 billion Brazil investment and Scala’s USD 50 billion AI City illustrate the scale of new requirements.[1]Stephen Nellis, Data center companies investing in Brazil, Reuters, reuters.com Liquid-cooling adoption accelerates, with locally manufactured Delta Cube systems reducing energy usage in ODATA sites. Regional policy makers regard AI infrastructure as a pillar of digital competitiveness, prompting expedited permits and targeted tax breaks. Contractors report surging bids for high-density MEP packages, and suppliers of busway, pumps, and plate-heat exchangers scale up regional production footprints.
Hyperscale campus build-outs by U.S. cloud majors
Amazon Web Services, Microsoft Azure, and Google Cloud collectively earmark more than USD 10 billion for Latin America by 2030. Multi-gigawatt campuses in São Paulo, Querétaro, and Bogotá require redundant 400 kV utility feeds, advanced fire suppression, and prefabricated power rooms that cut commissioning cycles to 12-18 months. Regional fiber conglomerate V.tal alone budgets USD 1 billion to deliver hyperscale-ready shells in Brazil. The build-to-suit model favors EPC firms proficient in integrated design-build, and demand spills into secondary metros as power availability tightens in first-tier cities.
5G-driven edge-DC demand in secondary LATAM metros
Claro Peru’s 5G-Advanced tests hit 10 Gbps download speeds, underscoring latency-sensitive use cases that require distributed micro-data centers nearer to end users.[2]Claro Peru & Huawei, 5G-A field trial hits 10 Gbps, rcrwireless.com EdgeUno rolls out prefabricated 0.5-2 MW sites in cities such as Arequipa and Mérida, while Colombian authorities cite ten submarine fiber-optic cables as an anchor for edge expansion. Construction differs from hyperscale models, focusing on modular skids, carrier-neutral meet-me rooms, and remote management platforms that cut staffing overhead.
Sovereign-cloud and data-residency regulations
Brazil’s General Data Protection Law, recent rules on cross-border data transfer, and Chile’s National Data Center Plan force multinationals to process data in-country.[3]Maria Pérez, Brief comments on Chile deregulation, terraforminglatam.net Argentina’s RIGI law sweetens terms for USD 200 million-plus builds, including tax holidays and forex protections. These measures lock in local construction demand, shape design specifications around security zones, and encourage partnerships with domestic utilities for renewable power supply.
Restraints Impact Analysis*
| RESTRAINTS | (~) % IMPACT ON CAGR FORECAST | GEOGRAPHIC RELEVANCE | IMPACT TIMELINE |
|---|---|---|---|
| Grid-power bottlenecks and surging electricity tariffs | -1.9% | Mexico, Argentina primary; Brazil, Colombia secondary | Short term (≤ 2 years) |
| Scarcity of Tier-III/IV-certified MEP labour | -1.2% | Regional, with acute shortages in secondary markets | Medium term (2-4 years) |
| Water-stress curbing liquid-cooling deployments | -0.8% | Chile, Mexico, Argentina; urban centers in Brazil | Long term (≥ 4 years) |
| Lengthy environmental licensing and community opposition | -0.6% | Brazil, Chile primary; Mexico, Colombia secondary | Medium term (2-4 years) |
| Source: Mordor Intelligence | |||
Grid-power bottlenecks and surging electricity tariffs
Mexico struggles with 18-month utility-interconnection queues, pushing developers to procure diesel generation that adds up to 25% to project CAPEX and inflates operating expenses. Argentina’s macro-economic volatility amplifies tariff risk, while localized transmission congestion in São Paulo forces developers toward Campinas and Porto Alegre. AI workloads multiply power density, stressing grids originally designed for commercial office loads. Operators increasingly sign 15-year renewable PPAs to secure predictable pricing, but smaller enterprises lack the balance-sheet to pursue such deals, slowing adoption in mid-market segments.
Scarcity of Tier-III/IV-certified MEP labor
Mission-critical construction now outpaces the talent pipeline, with certified electricians and HVAC technicians commanding premiums that lift labor cost 20-30% above conventional builds. Visa delays for imported specialists extend schedules, while secondary metros such as Barranquilla and Córdoba face acute shortages that push projects into Tier II specifications. Industry associations propose apprenticeship programs, yet uptake remains modest. Developers therefore lean on modular-prefabricated components to minimize on-site specialized labor hours.
*Our forecasts treat driver/restraint impacts as directional, not additive. The impact forecasts reflect baseline growth, mix effects, and variable interactions.
Segment Analysis
By Infrastructure: Cooling Dominates in Tropical Climates
Mechanical infrastructure contributed 37.35% to the Latin America Data Center Construction market size in 2025, as hot-humid conditions across Brazil, Peru, and Colombia require robust chilled-water loops, evaporative cooling, and custom containment systems. Power distribution units, switchgear, and UPS arrays within electrical infrastructure stay essential for banking and telecom uptime mandates. General construction captures resilient shell-and-core outlays, including seismic bracing and hurricane-rated envelopes that safeguard mission-critical halls.
IT infrastructure is the fastest-growing category with an 8.16% CAGR, driven by servers optimized for AI inference, NVMe storage arrays, and 400 Gbps networking fabric. Hyperscale clients standardize on high-density racks requiring direct-to-chip liquid manifolds, which boosts demand for stainless-steel piping and redundant coolant pumps. Services such as consulting, commissioning, and facility management add value by ensuring regulation compliance and PUE optimization. The Latin America Data Center Construction market share within energy-efficiency consulting rises as carbon disclosure norms tighten in stock exchanges across the region.


By Tier Standard: Reliability Premium Fuels Tier IV
Tier III sites held 61.10% of the Latin America Data Center Construction market share in 2025, balancing 99.982% availability against manageable capex. Banks, insurers, and public clouds select this level for core workloads that tolerate brief maintenance windows. Conversely, content-delivery networks and regional edge nodes often deploy Tier II to limit cost while placing nodes closer to users.
Tier IV construction will grow 8.55% CAGR through 2031 on the back of hyperscalers and fintech platforms seeking 99.995% service-level commitments. Multiple independent distribution paths, fault-tolerant chillers, and concurrently maintainable generators inflate capital budgets by up to 60%, yet clients accept the premium to satisfy uptime-linked revenue clauses. Builders partner with certification bodies early in design to avoid late-stage retrofit costs that have plagued first-time entrants.
By Data Center Type: Hyperscale Momentum Builds
Colocation data centers represented 55.20% of the Latin America Data Center Construction market share in 2025, providing immediate entry points for enterprises without the balance-sheet for self-builds. Operators like Equinix opened Rio 3 to capture latent demand from fintech and gaming clients. Service differentiation now leans on cross-connect density and sustainability metrics such as PUE and water-usage effectiveness.
Hyperscale/self-built campuses are accelerating at a 9.85% CAGR to 2031, propelled by cloud majors seeking sovereign compliance and latency gains. Microsoft’s São Paulo hub and CloudHQ’s Querétaro project both exceed 200 MW when fully built. Developers secure 400 kV substation access and multi-terabit terrestrial fiber rings, cementing long-run cost advantages versus multi-tenant models. Enterprise, edge, and modular data centers fill niche latency and disaster-recovery needs, benefiting local integrators skilled in rapid site roll-outs.
By End-User Industry : Healthcare Surges on Telemedicine Adoption
IT and telecommunications customers retained 48.40% share of the Latin America Data Center Construction market size in 2025, channeling investment into carrier hotels, IP transit nodes, and private-cloud expansions. BFSI workloads remain steady, with Banrisul’s storage upgrade illustrating steady refresh cycles to meet digital-banking growth. Government ministries award contracts for sovereign-cloud zones that isolate classified networks within domestically controlled cabinets.
Healthcare tops growth charts at 8.12% CAGR as telemedicine platforms, imaging archives, and electronic health records balloon data volumes. Hospitals deploy edge micro-data centers for real-time diagnostics, while national e-health regulations mandate on-shore processing. System integrators bundle HIPAA-equivalent compliance modules into new builds, expanding professional-services revenue streams. Other verticals such as manufacturing and media adopt smart-factory analytics and streaming distribution that further diversify demand for facility configurations.
Geography Analysis
Brazil held 39.20% of regional capital outlays in 2025 and remains the anchor of the Latin America Data Center Construction market. Eighty-five percent renewable-energy penetration and a stable regulatory regime reduce long-term operating risk. São Paulo alone concentrates 80% of national capacity, but developers increasingly select Campinas and Porto Alegre for land and power availability. Public banks earmark BRL 2 billion in credit lines, and Patria’s USD 1 billion platform signals ongoing domestic-investor confidence.
Mexico leverages near-shoring dynamics and US-MCA trade certainty, with Querétaro’s state government offering discounted land leases and streamlined permits. CloudHQ’s greenfield project highlights cross-border fiber synergies, yet power shortages around Mexico City create siting challenges. Chile positions itself through deregulation that exempts data-center projects from environmental impact assessments, while providing government-backed land plus 1 million-liter diesel storage thresholds that cut permitting by six months. Equinix’s USD 130 million Santiago build illustrates international appetite.
Colombia controls 9.35% revenue share and posts 12.6% annual growth as Bogotá benefits from cool temperatures and plentiful submarine-cable landings. KIO’s 6 MW launch with an option to double underscores institutional confidence. Argentina’s new RIGI incentives lure USD 200 million-plus investors to Buenos Aires and Bahía Blanca with 30 MW guaranteed power and tax relief. Peru and the rest of Latin America serve as emerging hotspots where 5G advances and digital-inclusion funds accelerate micro-facility adoption.
Regulatory Landscape
Regulation for data center construction in Latin America is increasingly shaped by data-residency requirements and by permitting and incentive frameworks that affect land, power access, and imported equipment. Brazil remains a key reference point for the region, with Provisional Measure 1.318/2025 establishing REDATA (Regime Especial de Tributacao para Servicos de Datacenter) to incentivize installation and expansion. The incentive structure ties benefits to local-market commitments, including requirements around domestic capacity allocation and R&D spending linked to incentivized equipment.
Compliance expectations are also tightening for facilities that function as critical nodes for telecom networks. In Brazil, ANATEL Resolution 780/2025 introduced certification expectations for data centers integrated into telecommunications networks, while Public Consultation No. 48/2025 continues through 2026 to refine technical conformity and operational requirements. Legislative discussion around a National Data Center Policy has also included prioritization of electricity transmission access for data centers in areas with energy surplus, reflecting scrutiny of how large loads are connected without amplifying residential tariff pressure.
Value Chain Analysis
The value chain covers site selection and permitting, grid interconnection and energy contracting, design and engineering, civil and structural works, MEP and IT fit-out, commissioning, and ongoing facilities services. In Brazil and parts of Mexico, grid-connection timelines and transmission constraints act as an early gating factor, which then shapes procurement plans for substations, switchgear, generators, and cooling plant. Developers increasingly pair utility processes with long-term renewable PPAs and on-site or dedicated energy solutions to stabilize power availability and costs, while connectivity planning (carrier-neutral fiber routes and corridors between hubs) is being pulled forward into earlier design stages.
On the supply side, Latin America often blends strong local delivery capacity for civil construction, structural steel, and MEP installation with reliance on imported long-lead equipment such as chillers, generators, and advanced controls, which can extend lead times and increase costs when import taxes apply. Skilled labor availability for Tier III/IV mission-critical MEP and specialist designers remains a bottleneck, encouraging modular and prefabricated approaches to reduce on-site complexity. Operator and developer partnerships are also more visible across the chain, including alliances aimed at deploying AI infrastructure across multiple countries and investments in neutral long-haul networks to connect major data center clusters.
Competitive Landscape
The contractor ecosystem shows moderate fragmentation as global EPC majors vie with regional builders and niche modular specialists. AECOM, Turner, and Jacobs capitalize on certified project-delivery frameworks to win hyperscale contracts, whereas Andrade Gutierrez and Queiroz Galvão leverage utility-interconnection know-how and municipal relationships. No single firm exceeds 10% regional revenue, keeping bargaining power dispersed.
Competition increasingly hinges on sustainability credentials and modular-delivery track records. Scala Data Centers pairs 100% wind PPAs with prefabricated power rooms, cutting schedule risk while meeting net-zero pledges. V.tal’s design-build model integrates substation erection, accelerating time-to-service for U.S. cloud tenants. Contractors adopt BIM and digital twins to improve clash-detection and reduce re-work by 20%, a key advantage amid skilled-labor shortages.
Secondary markets open white-space for local firms adept in mid-tier builds. Grupo Marhnos pivots from commercial real estate into 5-10 MW edge hubs, emphasizing rapid deployment and low OPEX. International utilities such as Iberdrola explore joint ventures that bundle renewable generation with build-transfer-operate data-center shells, adding a fresh competitive dimension.
Latin America Data Center Construction Industry Leaders
AECOM
Turner Construction
DPR Construction
Jacobs Solutions
Fluor Corporation
- *Disclaimer: Major Players sorted in no particular order

Market Opportunities and Future Outlook
Brazil is a central opportunity pocket where incentive policy, hyperscale demand, and new-build campuses are converging into a large construction pipeline. The shift from provisional to permanent incentives is underway, with PL 278/2026 advancing in 2026 to establish a ReData tax regime that replaces MP 1.318/2025. In parallel, hyperscale projects are already in execution, including Omnia starting the first phase of a Pecem (Ceara) campus described as a 200 MW build, and Ada Infrastructure beginning construction of its 300 MW GRU10 campus in Franco da Rocha, Sao Paulo, with Racional Engenharia as the phase-one builder.
A second, increasingly visible opportunity is integrated power-plus-data-center development that directly addresses grid bottlenecks and tariff risk. Developers are pairing campuses with dedicated renewable supply agreements, including Omnia and Casa dos Ventos signing a USD 2 billion energy-supply deal linked to the Pecem project, and initiatives that combine data center land positions with solar and storage, such as Solaer securing a long-term lease in Chile’s Atacama region tied to a plan that includes 197 MW of solar and 500 MWh of battery storage. Expansion by operators building outside the largest metros also supports opportunities for modular delivery, edge-ready designs, and faster commissioning models, illustrated by Telconet announcing additional data center rollouts across Ecuador, Panama, and Colombia for operations by end-2026.
Recent Industry Developments
- July 2026: Racional Engenharia began construction of the first facility in Ada Infrastructure’s GRU10 data center campus in Franco da Rocha, Sao Paulo. The phase-one build is planned over an 18 to 24 month window, supporting a staged delivery model that aligns substation and building works with hyperscale capacity ramp.
- August 2025: Scala Data Centers and Serena announced a major renewable-energy arrangement focused on wind power self-supply for data centers in Latin America. The agreement strengthened the region’s move toward PPAs and captive clean energy as developers respond to grid constraints and customer sustainability requirements.
- April 2024: Equinix expanded its Latin America footprint through continued investment activity tied to its regional colocation platform. The move reinforced demand for construction services that prioritize fast delivery, high cross-connect density, and energy-efficient mechanical infrastructure in the region’s primary metros.


Research Methodology Framework and Report Scope
Market Definition and Coverage
For this study, the market covers spending tied to building and upgrading data center facilities across Latin America, including the core construction work and the supporting infrastructure needed to make the site operational.
Scope exclusions: The sizing does not count ongoing operations and maintenance spending after commissioning, and it also excludes pure IT hardware procurement that is not part of construction delivery.
Segmentation Overview
- By Infrastructure
- By Electrical Infrastructure
- Power Distribution Solutions
- Power Distribution Unit
- Switchgears
- Others Electrical Infrastructure
- Power Backup Solutions
- UPS
- Generators
- Power Distribution Solutions
- By Mechanical Infrastructure
- Cooling Systems
- Liquid-based Cooling
- Air-based Cooling
- Racks and Cabinets
- Other Mechanical Infrastructure
- Cooling Systems
- By IT Infrastructure
- Servers
- Storage
- Other IT Infrastructure
- General Construction
- Services
- Design and Consulting
- Integration
- Support and Maintenance
- By Electrical Infrastructure
- By Tier Standard
- Tier I and II
- Tier III
- Tier IV
- By End-User Industry
- Banking, Financial Services and Insurance
- IT and Telecommunications
- Government and Defense
- Healthcare
- Other End Users
- By Data Center Type
- Colocation Data Centers
- Hyperscale / Self-built Data Centers
- Others (Enterprise / Edge / Modular)
- By Geography
- Brazil
- Chile
- Argentina
- Rest of Latin America
Data Sources, Market Sizing, and Validation
Desk Research
We start by mapping the investable pipeline and the local build environment in key countries, then align it with repeatable construction cost benchmarks. Public and official sources are used to anchor the fundamentals, such as national statistics offices in the region, central bank inflation series, energy regulators and grid operators, and customs and trade portals for large electrical and mechanical equipment flows.
To keep assumptions practical, we review building and electrical codes, permitting guidance, and publications from industry associations and standards bodies that cover data center tiers and facility requirements. Company filings, investor presentations, and reputable regional business press help validate announced capacity additions, campus plans, and contractor activity. Where needed, paid subscriptions for company financials and intelligence, patent databases, and import-export shipment level data are used to cross-check timelines and supply signals. The sources listed here are illustrative only, and many other references were also used for data collection, validation, and clarification during the work.
Primary Interviews and Surveys
Next, we validate the model through interviews and surveys with contractors, engineering firms, equipment integrators, developers, and large buyers that commission capacity. Coverage is kept balanced across Brazil, Mexico, Argentina, and the rest of the region so that project timing, cost inflation, and local power constraints are reflected in the final sizing and assumptions.
Distribution of primary research fieldwork respondents
| Company type | Respondent position | Region |
|---|---|---|
| Top tier: 34% | CXOs: 17% | |
| Mid tier: 46% | Functional/Unit leaders: 34% | |
| Smaller Players: 20% | Managers: 49% |
Market-Sizing & Forecasting
Sizing is built using top-down and bottom-up checks, so the totals stay tied to real build activity without overstating precision. The top-down core uses country-level build and expansion signals to reconstruct construction demand, then converts that into annual spend using typical capex per MW, build timelines, and the split of spend across general construction, electrical infrastructure, and mechanical infrastructure.
To keep the numbers grounded, we corroborate totals with selective bottom-up approximations, such as rolling up a sample of announced projects, checking reported contractor backlogs, and applying sampled cost ranges to power capacity additions and disclosed white space additions. When project disclosure is incomplete, gaps are handled by using conservative ranges for cost per MW and phasing, then testing the outcomes against what experts say is feasible for permitting and delivery.
For forecasting, we rely mainly on scenario analysis because near-term outcomes depend on project timing, power availability, and financing conditions that can shift quickly. Key inputs that are tracked include announced and under-construction MW, expected commissioning dates, inflation in construction labor and materials, exchange rate timing for imported equipment, and shifts in tier preferences and cooling intensity, which changes mechanical and electrical spend per site.
Data Validation & Update Cycle
Before finalizing, outputs are checked against independent signals, including regional investment announcements, capacity additions, and import patterns for major electrical and mechanical components. If a country total moves outside expected ranges, the assumptions are revisited and respondents are re-contacted to confirm whether the change is real or mainly a timing shift.
A multi-step internal review is followed so that calculation logic, currency conversions, and country roll-ups are consistent. The report is refreshed annually, and interim updates are made when there is a material event such as a large campus announcement, a delay in power interconnect, or a major change in cost inflation. Right before delivery, we run a final pass so clients receive the latest updated view.
Mordor Intelligence's Latin America Data Center Construction Market Estimate Compared With Other Published Estimates
Published market sizes for data center construction in Latin America often do not match, mostly because firms count different cost buckets and treat the project pipeline differently. The spread usually comes from what is counted as construction spend, which years are used as the starting point, and how currency and inflation are applied.
In this market, the biggest gap driver is whether estimates include only facility build and retrofit packages (general construction plus electrical and mechanical infrastructure) or whether they also fold in adjacent digital infrastructure items. That difference becomes visible once MW-based cost ranges and commissioning phasing are applied consistently near the end of the build cycle, as done by Mordor Intelligence.
Benchmark comparison
| Source | Market Size | Gaps in Research Methodology |
|---|---|---|
| Mordor Intelligence | USD 5.59 B (2025) | |
| Industry Publisher A | USD 3.01 B (2025) | This estimate is presented as investment-based and tends to track a narrower set of construction packages and disclosed projects, which can understate retrofit activity and supporting infrastructure spend when disclosure is limited. |
| Industry Publisher B | USD 1.58 B (2024) | This figure uses an earlier base year and a faster growth profile, and the scope can lean toward a selective pipeline view and different currency and inflation timing, which makes the starting market value smaller than a full facility construction spend roll-up. |
The table shows that most differences can be explained by scope and timing choices, rather than by a completely different demand story. By keeping the spend definition tied to construction and infrastructure packages and stress-testing totals against MW additions and build phasing, the result stays traceable to inputs that can be re-checked and repeated.


Key Questions Answered in the Report
How large is the Latin America Data Center Construction market in 2026?
The market stands at USD 6.05 billion in 2026 and is projected to reach USD 8.96 billion by 2031.
Which infrastructure category captures the biggest outlay?
Mechanical infrastructure leads with 37.35% share because tropical climates elevate cooling and power-distribution costs.
What is driving the surge in Tier IV facilities?
Hyperscale cloud providers and fintech platforms demand 99.995% uptime, pushing Tier IV builds to grow at 8.55% CAGR.
Why is healthcare the fastest-growing vertical?
Telemedicine expansion and electronic health records require secure, on-shore processing, resulting in 8.12% CAGR through 2031.
Which country dominates investment?
Brazil accounts for 39.20% of 2025 spending due to abundant renewable power, stable regulation, and a deep contractor base.
How are power constraints being addressed?
Developers sign long-term renewable PPAs and integrate on-site generation to mitigate grid bottlenecks and tariff volatility.
Page last updated on:


