
Laser-based Gas Analyzers Market Size and Share
Market Overview
| Study Period | 2020 - 2031 |
|---|---|
| Market Size (2026) | USD 617.22 Million |
| Market Size (2031) | USD 856.82 Million |
| Growth Rate (2026 - 2031) | 6.78% CAGR |
| Fastest Growing Market | Asia-Pacific |
| Largest Market | North America |
| Market Concentration | Medium |
Major Players *Disclaimer: Major Players sorted in no particular order Image © Mordor Intelligence. Reuse requires attribution under CC BY 4.0. | |
Laser-based Gas Analyzers Market Analysis by Mordor Intelligence
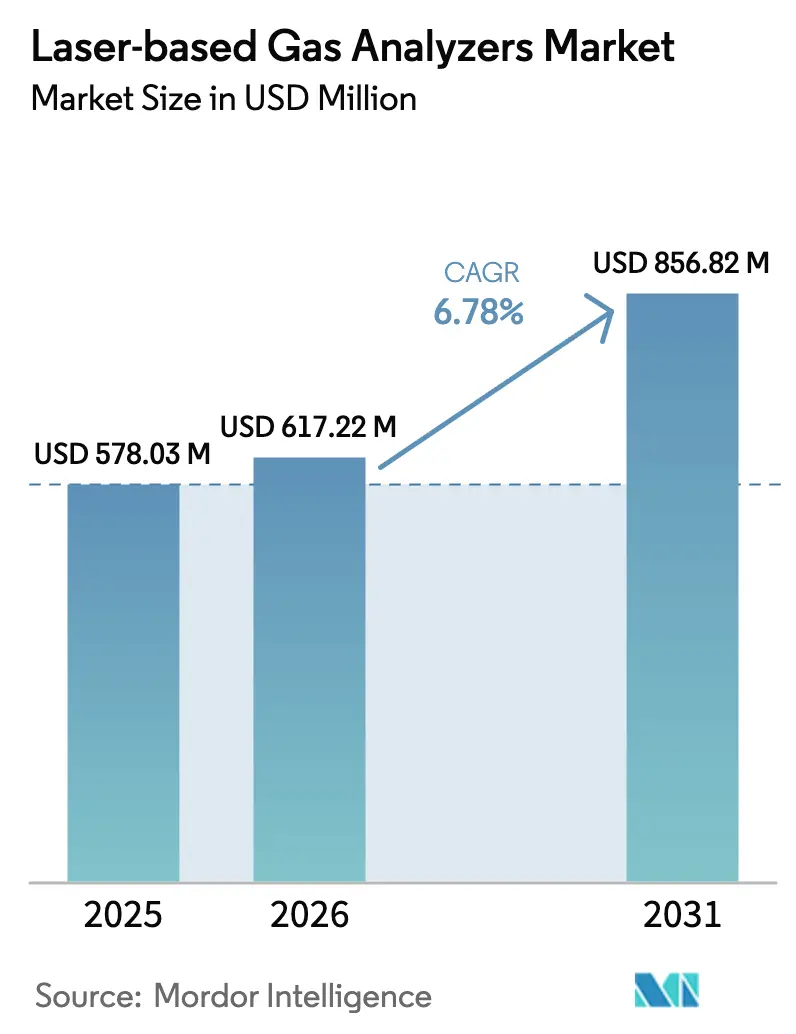
The Laser-based Gas Analyzers Market size is expected to increase from USD 578.03 million in 2025 to USD 617.22 million in 2026 and reach USD 856.82 million by 2031, growing at a CAGR of 6.78% over 2026-2031.
Stringent multi-pollutant rules in emerging economies, rising coal-to-hydrogen co-firing activity, and the build-out of small modular reactors support steady capital spending on continuous off-gas monitoring. Vendors that integrate cloud analytics with hardware are lowering operating costs for plants that lack on-site spectroscopy skills, while supply-chain workarounds for gallium arsenide wafers are easing recent lead-time pressures. Procurement also benefits from mid-infrared quantum cascade laser modules that resolve trace ammonia and volatile organic compounds in petrochemical streams. Growth opportunities remain strongest where subsidies, such as China’s air-quality budget and the United States Department of Energy capture hubs program, offset the capital-cost premium of laser platforms.
Key Report Takeaways
- By process, in-situ configurations led with 58.73% revenue share in 2025 of the laser-based gas analyzers market, whereas extractive systems are advancing at a 7.66% CAGR through 2031.
- By technology, tuneable diode laser spectroscopy retained 41.63% revenue share in 2025 of the laser-based gas analyzers market, while quantum cascade laser systems are expanding at a 7.33% CAGR to 2031.
- By end-user industry, oil and gas contributed 32.73% revenue share in 2025 of the laser-based gas analyzers market; healthcare and pharmaceuticals record the fastest 6.99% CAGR to 2031.
- By application, emissions monitoring accounted for 41.74% of the laser-based gas analyzers market size in 2025 and laboratory and research analysis is growing at a 7.44% CAGR through 2031.
- By geography, North America held 38.73% of geographic revenue in 2025 of the laser-based gas analyzers market; Asia-Pacific is forecast to post the highest 7.55% CAGR to 2031.
Note: Market size and forecast figures in this report are generated using Mordor Intelligence’s proprietary estimation framework, updated with the latest available data and insights as of January 2026.
Global Laser-based Gas Analyzers Market Trends and Insights
Drivers Impact Analysis*
| Driver | (~) % Impact on CAGR Forecast | Geographic Relevance | Impact Timeline |
|---|---|---|---|
| Stringent multi-pollutant emissions regulations post-2025 in emerging economies | +1.2% | Asia-Pacific core, spillover to Middle East and Africa | Medium term (2-4 years) |
| Accelerated coal-to-hydrogen co-firing retrofits requiring real-time combustion analytics | +0.9% | Europe and Asia-Pacific, selective North America sites | Medium term (2-4 years) |
| Rapid expansion of small modular reactor projects needing continuous off-gas monitoring | +0.7% | North America and Europe, early Asia-Pacific deployments | Long term (≥4 years) |
| Rising adoption of CCUS with laser inline CO₂ purity checks | +1.1% | Global, concentrated in North America and Middle East | Medium term (2-4 years) |
| Petrochemical shift to green ammonia driving in-situ NH₃ leak detection systems | +0.8% | Middle East, Asia-Pacific, selective Europe hubs | Medium term (2-4 years) |
| Growth of hospital negative-pressure isolation rooms mandating trace anesthetic gas analysis | +0.5% | Global, accelerated in North America and Europe | Short term (≤2 years) |
| Source: Mordor Intelligence | |||
Stringent Multi-Pollutant Emissions Regulations Post-2025 in Emerging Economies
Vietnam, Kenya, and India enacted rules between 2024 and 2025 that oblige thermal power plants and cement kilns to install continuous analyzers for nitrogen oxides, sulfur dioxide, and particulate matter. Vietnam’s Circular 45/2024 demands real-time monitoring for units above 30 MWth, capturing nearly 180 coal-fired boilers. Kenya’s 2024 air-quality update reduced the nitrogen-oxide cap to 150 mg/m³ and tightened quarterly reporting, while India extended its 2015 norms to about 400 captive generators. Near-infrared tuneable diode laser and mid-infrared quantum cascade laser systems outperform electrochemical cells in these dusty high-moisture stacks, reinforcing demand across the laser-based gas analyzers market.
Accelerated Coal-to-Hydrogen Co-Firing Retrofits Requiring Real-Time Combustion Analytics
European and Asian utilities are blending up to 20% hydrogen or ammonia with coal, altering flame chemistry and increasing unburned-fuel slip. Mitsubishi Heavy Industries measured 15 ppm ammonia slip at a 20% co-fire setting and recommended sub-5 ppm detection thresholds, achievable with modern tuneable diode laser analyzers.[1]Mitsubishi Heavy Industries, “Ammonia Co-firing Technology for Coal-Fired Power Plants: Combustion Characteristics and Emissions Control,” mhi.com The EU Innovation Fund awarded EUR 150 million (USD 169.5 million) to demonstration plants in late 2024, each specifying continuous laser-based combustion analytics.[2]European Commission, “Innovation Fund: Large-Scale Projects Call Results,” climate.europa.eu Japan targets 1 GW ammonia co-firing by 2030, with early projects at JERA facilities adopting quantum cascade laser platforms for simultaneous ammonia and nitrous-oxide monitoring. These actions amplify opportunity across the laser-based gas analyzers market.
Rapid Expansion of Small Modular Reactor Projects Needing Continuous Off-Gas Monitoring
The United States Nuclear Regulatory Commission approved NuScale’s 77 MWe module in 2023, with Idaho construction permits expected by 2026. Off-gas systems must detect krypton-85, xenon-133, and iodine-131 at sub-ppb levels. Pacific Northwest National Laboratory reported that cavity ring-down spectroscopy attains detection limits 10 times lower than beta-gamma counters while eliminating sample conditioning. IAEA Technical Document 1991, published in 2025, endorses continuous laser-based noble-gas tracking in Generation IV designs.[3]International Atomic Energy Agency, “Continuous Off-Gas Monitoring for Generation IV Reactors,” iaea.org Growing reactor fleets thus expand the laser-based gas analyzers market.
Rising Adoption of CCUS with Laser Inline CO₂ Purity Checks
CO₂ streams require ≥95% purity before pipeline injection to curb corrosion. The United States Department of Energy directs regional capture hubs to verify purity in real time, favoring laser platforms that bypass dilution and desiccant steps. Norway’s Northern Lights project rejected two cargoes in early 2025 due to nitrogen contamination detected by laser analyzers. Draft ISO 27919-3, expected in 2026, names tuneable diode laser spectroscopy for sulfur dioxide and hydrogen sulfide trace measurement. Implementation momentum boosts the laser-based gas analyzers market worldwide.
Restraints Impact Analysis*
| Restraint | (~) % Impact on CAGR Forecast | Geographic Relevance | Impact Timeline |
|---|---|---|---|
| Capital cost premium versus electrochemical sensors in cost-sensitive mid-tier plants | -0.8% | Asia-Pacific, South America, Africa | Short term (≤2 years) |
| Skill shortage to interpret high-resolution spectral data in developing regions | -0.6% | Asia-Pacific, Middle East, Africa | Medium term (2-4 years) |
| Laser source supply-chain constraints due to GaAs wafer shortages | -0.5% | Global, acute in North America and Europe | Short term (≤2 years) |
| Standardization gaps across global regulatory methods hindering procurement decisions | -0.4% | Global, pronounced in Asia-Pacific and Latin America | Medium term (2-4 years) |
| Source: Mordor Intelligence | |||
Capital Cost Premium Versus Electrochemical Sensors in Cost-Sensitive Mid-Tier Plants
Laser analyzers cost 2-3 times more than electrochemical arrays. An Asian Development Bank study estimated 18-24 months payback in Southeast Asian plants, exceeding the 12-month hurdle many managers apply. Where enforcement remains uneven, operators delay upgrades, especially when single-gas non-dispersive infrared devices suffice. The premium tempers short-term uptake in parts of Asia-Pacific, South America, and Africa, restraining the laser-based gas analyzers market.
Skill Shortage to Interpret High-Resolution Spectral Data in Developing Regions
Only 15% of technicians in India, Indonesia, and Nigeria possess laser spectroscopy training versus 40% in Germany, according to a 2025 ISA survey. The gap creates commissioning delays and mis-alarms. Cloud analytics mitigate the problem, yet bandwidth limits and data-sovereignty rules hinder adoption in remote or regulated plants. The talent deficit therefore reduces near-term growth potential in several high-priority regions of the laser-based gas analyzers market.
*Our forecasts treat driver/restraint impacts as directional, not additive. The impact forecasts reflect baseline growth, mix effects, and variable interactions.
Segment Analysis
By Process: Extractive Systems Widen Adoption in Harsh Environments
Extractive systems are gaining ground even though in-situ units delivered 58.73% of 2025 revenue in the laser-based gas analyzers market. Power plants that retrofit pre-2000 continuous emissions monitoring hardware favor extractive probes that sit outside the flue, shielded from acid rain precursors and dust. Extractive modules deliver 7.66% CAGR through 2031 as coal, waste-to-energy, and biomass boilers exceed optical path fouling limits that hamper cross-stack tuneable diode laser probes. The United States Environmental Protection Agency Performance Specification 18 update in 2024 legitimized extractive tuneable diode laser reporting provided transfer lines stay above the acid dew point. Calibration is straightforward because certified gas blends can be injected directly, a convenience embraced by ISO 14001-certified facilities.
Hybrid architectures are emerging in refineries that use an in-situ probe for combustion trim and an extractive loop for trace hydrogen sulfide. The European Industrial Emissions Directive mandates continuous reporting of 12 pollutants at integrated refinery sites, an obligation most cost-effectively met with multi-point extractive networks feeding central spectrometers. As maintenance teams gain experience, extractive installations in cement kilns and glass furnaces are also climbing. Altogether, growing retrofit activity enlarges the share of extractive solutions within the laser-based gas analyzers market.


By Technology: Mid-Infrared QCLS Accelerates Trace-Gas Detection
Tuneable diode laser spectroscopy delivered 41.63% of technology revenue in 2025, supported by mature supply chains for 1.3 µm to 1.6 µm distributed-feedback lasers that measure water vapor, methane, and hydrogen chloride. Quantum cascade laser spectroscopy, however, records the highest 7.33% CAGR, driven by its 2 µm–12 µm wavelength coverage, which probes the fundamental vibrational modes of ammonia, nitrous oxide, and volatile organic compounds. When Thorlabs introduced a room-temperature module below USD 15,000 in 2025, entry barriers for mid-sized petrochemical plants fell sharply.
Cavity ring-down spectroscopy is gaining traction in isotopic CO₂ verification for carbon accounting, as cited in the NIST Standard Reference Material 2820, released in 2025. Raman analyzers remain mainly in laboratories due to fluorescence interference from aromatics, although new chemometric libraries are improving field viability. The International Electrotechnical Commission is drafting IEC 61508 functional-safety guidance specific to quantum cascade analyzers in hazardous areas, with publication expected in late 2026. Together, these advances diversify technology preferences inside the laser-based gas analyzers market.
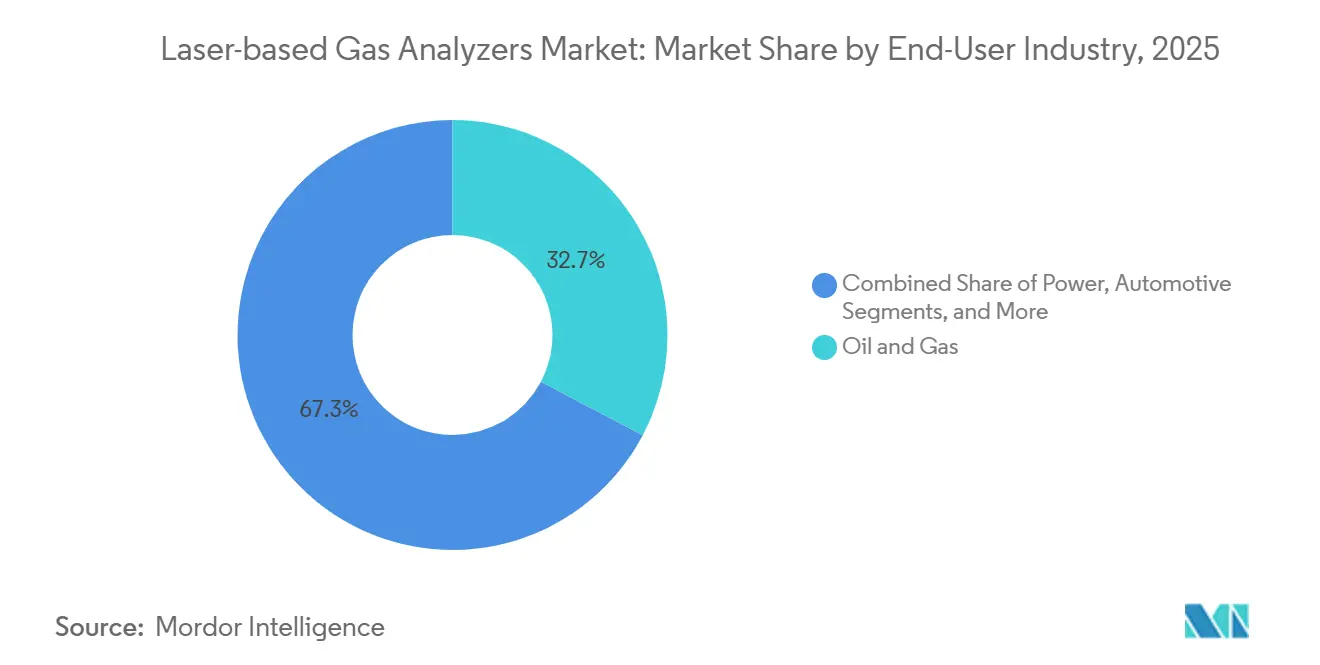
By End-User Industry: Healthcare Gains Momentum
Oil and gas contributed 32.73% of 2025 revenue, anchored by methane leak rules under the United States EPA Subpart W and Canadian federal mandates. Healthcare and pharmaceuticals now post a 6.99% CAGR through 2031, reflecting hospital expansions of negative-pressure isolation rooms that require continuous anesthetic-gas monitoring under ASHRAE 170-2021. Real-time volatile-organic-compound tracking also helps pharmaceutical manufacturers comply with ICH Q3C residual-solvent limits.
In power generation, high-dust coal units favor laser analyzers because electrochemical cells drift under particulate loading. Automotive paint booths rely on perimeter laser monitoring to ensure 95% destruction of volatile organic compounds, as mandated by the European Solvent Emissions Directive. Pulp and paper mills outfit recovery boilers with tunable diode laser units to maintain total reduced sulfur levels below odor thresholds. Food processors installing renewable natural gas equipment verify that methane purity is above 97% and hydrogen sulfide is below 4 ppm. Such diverse use cases broaden the laser-based gas analyzers market across end-user verticals.

By Application: Laboratory Analysis Records Fastest Uptick
Emissions monitoring retained 41.74% revenue share in 2025, rooted in mandatory continuous emissions monitoring systems at approximately 1,200 North American power plants alone. Laboratory and research analysis, however, exhibits a 7.44% CAGR to 2031, boosted by academic adoption of cavity ring-down spectroscopy for carbon isotopics and breath analysis. NIST’s 2025 isotopic standards closed a traceability gap and sparked instrument purchases for voluntary carbon market verification.
Process optimization gains ground in petrochemical crackers where real-time ethylene and propylene readings enhance olefin yields. Safety and leak detection rollouts at liquefied natural gas terminals rely on sub-ppm hydrogen and methane thresholds to preempt explosive conditions. Environmental compliance testers value portable tuneable diode laser instruments weighing under 10 kg that simplify multi-site sampling. Cumulatively, expanding laboratory, safety, and optimization tasks enrich the laser-based gas analyzers market application mix.
Geography Analysis
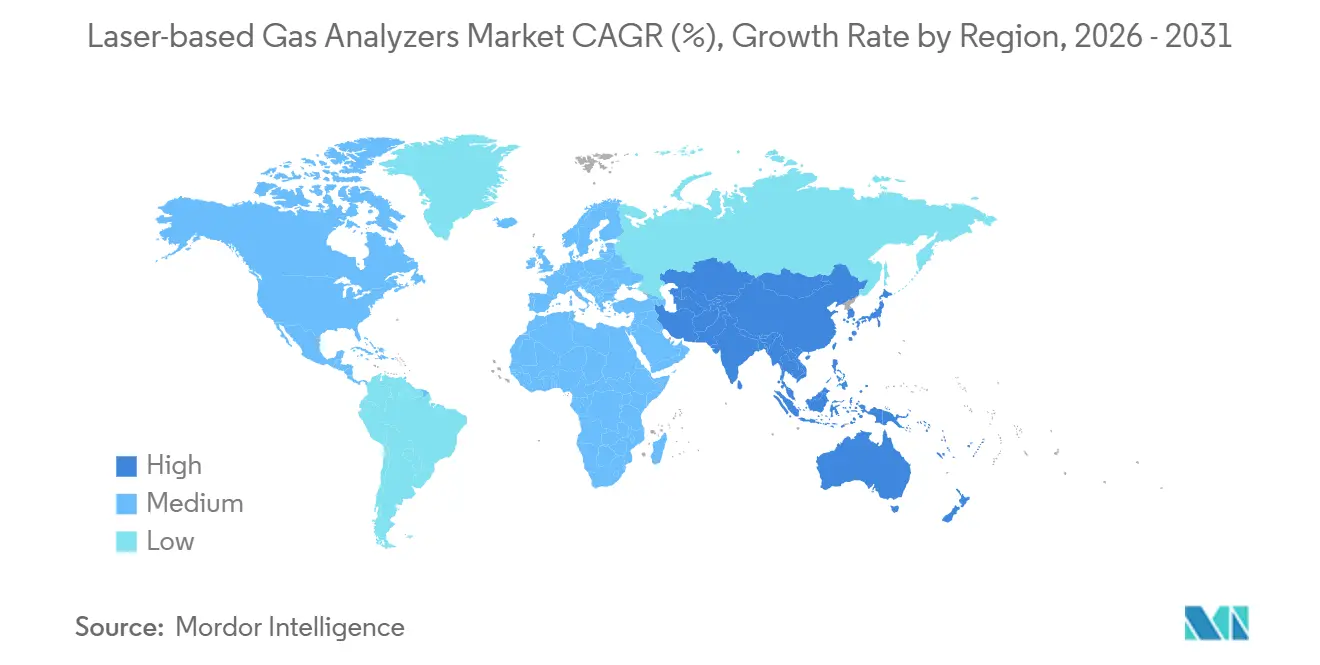
North America generated 38.73% of laser-based gas analyzers market revenue in 2025. United States power plants covered by the Acid Rain Program and the Regional Greenhouse Gas Initiative must submit continuous emissions data, and the 2024 Performance Specification 18 revision further entrenched laser absorption methods. Canadian upstream operators comply with quarterly methane leak surveys, while new carbon capture hubs require inline CO₂ purity checks, driving additional analyzer orders.
Asia-Pacific posts the fastest 7.55% CAGR through 2031. China’s Ministry of Ecology and Environment directed CNY 1.2 trillion (USD 169 billion) toward air-quality upgrades during the 14th Five-Year Plan, subsidizing laser deployments in steel and non-ferrous smelters. India’s National Clean Air Programme, updated in 2025, compels 1,500 industrial sources to install continuous monitoring by 2027. Southeast Asian power stations adopt laser systems as Vietnam and Indonesia enforce new stack limits. Mid-sized chemical plants remain cost sensitive, yet rising enforcement and falling module prices are closing the gap.
Europe’s share stabilizes as Western sites near saturation, yet Eastern member states, including Poland and Romania, accelerate installations to meet Industrial Emissions Directive best-available-technique notes. The Middle East builds new petrochemical complexes committed to Zero Routine Flaring goals, prompting orders for hydrogen sulfide and moisture analyzers. South American growth centers on Brazilian ethanol distilleries and Argentine shale projects, while South Africa’s draft 2024 rules could spark demand at 12 Eskom coal units. Collectively, regulatory divergence and investment cycles shape geographic prospects for the laser-based gas analyzers market.

Regulatory Landscape
Regulatory pull continues to formalize laser-based measurement in emissions monitoring and hazardous-area gas detection. ISO 7935:2024 for stationary source SO2 monitoring explicitly recognizes laser spectroscopic and tunable laser spectroscopy approaches, supporting procurement of TDLS and related laser platforms for flue gas applications. In the United States, the EPA has continued to expand pathways for laser-based approaches through alternative test method approvals under NSPS requirements, including an April 2025 approval for Sensirion Connected Solutions Nubo Sphere laser-based methane sensing and an August 2025 approval for SLB's Methane Lidar Camera for periodic screening, which reinforces acceptability of laser methods in specific compliance workflows.
Standardization and digital compliance requirements also affect product design, certification, and data handling. EN IEC 60079-29-0:2026 sets updated general requirements and test methods for gas detection equipment used in explosive atmospheres, which intersects with hazardous-area adoption in oil and gas, petrochemical, and terminals where Zone-rated analyzer packages are required. China has tightened technical specifications for laser spectroscopy leak detection in hazardous chemical operations through SN/T 5918-2025 (implemented February 2026). In parallel, the United States EPA finalized amendments for Chemical Manufacturing Area Sources (March 27, 2026) that increase emphasis on electronic reporting and remove certain analyzer gas stream exemptions, raising the operational importance of robust continuous monitoring configurations and auditable data outputs.
Value Chain Analysis
The value chain runs from laser source and infrared optics inputs to analyzer OEM integration, certification, distribution, and lifecycle service. Upstream concentration is high in key laser components, with a limited set of specialist manufacturers supplying a large share of high-spec distributed feedback and interband cascade laser diodes. Midstream OEMs integrate lasers with detectors, optics (germanium, ZnSe/ZnS, chalcogenide glasses), electronics, and embedded software to deliver in-situ and extractive analyzers for CEMS, process control, and leak detection.
Final assembly often includes hazardous-area packaging and functional safety engineering to meet SIL-2/SIL-3 expectations in industrial sites, followed by calibration, commissioning, and long-term maintenance contracts delivered directly or via regional channel partners and system integrators. Supply risk remains a defining feature of the chain, especially for infrared optical materials and wafer-related inputs. Industry reporting in 2024 highlighted extended lead times for germanium in some optics supply paths following tighter export controls on critical materials, while changing tariffs and cross-border procurement complexity have pushed OEMs toward multi-sourcing, component interchangeability, and longer-term supplier agreements. Downstream, end users increasingly prefer analyzer platforms that combine hardware with diagnostics and remote support, reducing reliance on scarce spectroscopy skills and elevating the role of software, connectivity, and service networks alongside core laser and optics capability.
Competitive Landscape
Top Companies in Laser-based Gas Analyzers Market
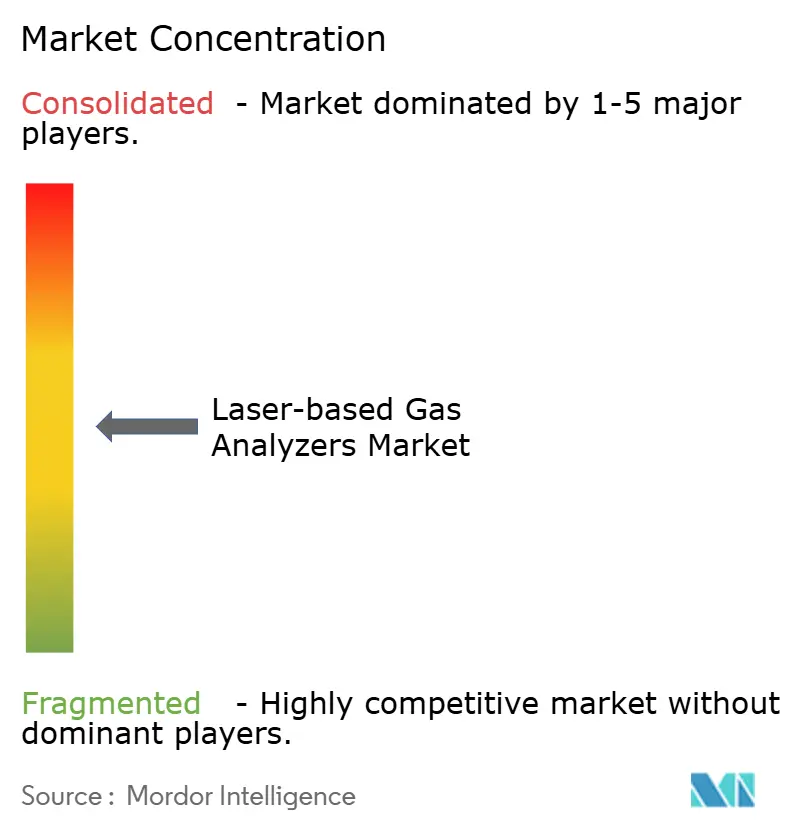
Five global automation conglomerates, ABB, Emerson, Siemens, Yokogawa, and Endress+Hauser, controlled about half of 2025 revenue by bundling service contracts with tuneable diode laser, quantum cascade laser, and Raman offerings. High installed-base switching costs safeguard their positions. Mid-tier chemical plants in Southeast Asia and Latin America represent white-space where price sensitivity and skill shortages have slowed conversions, but cloud-enabled analyzers promise to simplify adoption.
Specialists such as Tiger Optics, SpectraSensors, and Gasera focus on sub-ppb detection of moisture and ammonia in semiconductor fabs and pharmaceutical cleanrooms. Chinese firms Focused Photonics and Hangzhou Zetian gained domestic ground through localized production priced 20-30% below Western equipment, though European and United States certification hurdles limit exports. Patent activity concentrates on wavelength-modulation noise suppression. Siemens filed EP4012400 in 2024 for a second-harmonic normalization algorithm that cuts drift by 40%.
Technology strategies diverge, as incumbents push tunable diode lasers due to mature supply chains, while venture-backed firms emphasize quantum cascade lasers and cavity ring-down spectroscopy for green ammonia and isotopic CO₂ niches. The International Electrotechnical Commission is drafting IEC 61508 laser-specific safety rules that will advantage companies with certified design processes. Overall, moderate concentration prevails in the laser-based gas analyzers market.
Laser-based Gas Analyzers Industry Leaders
ABB Ltd
Opsis AB
Emerson Electric Co.
HORIBA Ltd
Servomex Group Limited
- *Disclaimer: Major Players sorted in no particular order

Market Opportunities and Future Outlook
Near-term white space is concentrated in sites facing multi-pollutant rules but lacking internal spectroscopy expertise, where integrated analytics and simplified workflows can drive adoption. EPA's continued acceptance of laser-based approaches through alternative test method approvals, including the April 2025 approval for Sensirion's laser-based methane sensing and the August 2025 approval for SLB's methane lidar method, provides practical reference points for operators and integrators looking to standardize screening and monitoring programs around laser platforms. China’s implementation of SN/T 5918-2025 for laser spectroscopy-based natural gas leak detection in hazardous chemical operations also creates a defined technical bar, supporting opportunities for compliant, inspection-ready instruments and services in large-scale industrial clusters.
Application-driven opportunities broaden as customers consolidate measurement needs into fewer devices and extend coverage to harder-to-measure species. Hybrid analyzer architectures that pair quantum cascade laser spectroscopy with oxygen measurement (such as paramagnetic O2) expand addressable monitoring points in CEMS, CAMS, and CCUS where operators want a single footprint and a unified data stream. Research institute deployment work, such as Fraunhofer IPM’s laser spectroscopy activities, and established suppliers’ TDLS portfolios support a pipeline of implementations in harsh environments including high-dust combustion, ammonia slip monitoring for co-firing, and moisture and contaminant measurement in natural gas and biogas. Additional pull comes from hazardous-area standardization under EN IEC 60079-29-0:2026, which favors certified, field-ready analyzer packages.
Recent Industry Developments
- March 2026: ABB launched EmissionVision, an automated solution for advanced gas leak detection. The release supports broader deployment of laser-enabled monitoring workflows by packaging detection, automation, and operational use into a single solution suited to compliance-driven leak programs.
- February 2026: Emerson introduced the Rosemount QX1000 hybrid continuous gas analyzer, combining quantum cascade laser spectroscopy for multiple target gases with paramagnetic oxygen measurement. The hybrid approach expands multi-gas coverage in a single analyzer footprint for CEMS, CAMS, and CCUS use cases where facilities prioritize consolidated measurement and standardized data outputs.
- May 2024: HORIBA released the LG-100 Series laser gas analyzer using IRLAM (Infrared Laser Absorption Modulation) for real-time monitoring of partial pressure in silicon tetrafluoride (SiF4) during semiconductor etching. This move reinforces laser-based analyzers in high-value industrial process control applications that demand fast, sensitive measurements under specialized operating conditions.


Research Methodology Framework and Report Scope
Market Definition and Coverage
This market covers laser-based instruments and systems used to measure gas concentration in real time or near real time, mainly for process control, emissions monitoring, safety, and compliance use cases across industrial sites and lab environments.
Scope exclusions: Non-laser gas analyzers (for example, electrochemical or paramagnetic systems) are excluded, along with stand-alone consumables, routine calibration services, and broad plant automation hardware that is not sold as part of the analyzer system.
Segmentation Overview
- By Process
- In Situ
- Extractive
- By Technology
- Tuneable Diode Laser Spectroscopy (TDLS)
- Raman Spectroscopy (RA)
- Cavity Ring-Down Spectroscopy (CRDS)
- Quantum Cascade Laser Spectroscopy (QCLS)
- By End-user Industry
- Power
- Oil and Gas
- Mining and Metals
- Chemical and Petrochemical
- Automotive
- Pulp and Paper
- Healthcare and Pharmaceuticals
- Other End-user Industries
- By Application
- Emissions Monitoring
- Process Optimization and Control
- Safety and Leak Detection
- Environmental Compliance Testing
- Laboratory and Research Analysis
- By Geography
- North America
- United States
- Canada
- Mexico
- South America
- Brazil
- Argentina
- Rest of South America
- Europe
- Germany
- United Kingdom
- France
- Italy
- Spain
- Rest of Europe
- Asia-Pacific
- China
- Japan
- India
- South Korea
- ASEAN
- Rest of Asia-Pacific
- Middle East and Africa
- Middle East
- Saudi Arabia
- United Arab Emirates
- Rest of Middle East
- Africa
- South Africa
- Nigeria
- Rest of Africa
- Middle East
- North America
Data Sources, Market Sizing, and Validation
Desk Research
Desk research was used to set the market boundary and to pull consistent demand signals. The work typically relies on public sources such as US EPA air emissions programs, the European Environment Agency, the International Energy Agency, and national statistics offices that publish industrial production and energy data. For trade flow and equipment movement, customs and import-export statistics are reviewed, and regional safety and compliance direction is cross-checked through bodies such as OSHA and similar regulators.
Company annual reports, product brochures, investor presentations, and trusted press coverage are also reviewed to understand where analyzers are being deployed and which product or packaging changes influence pricing. A paid database subscription is used selectively for company financials, patent lookups, and shipment-level trade checks where public series do not go deep enough. The sources listed here are illustrative and not exhaustive, and we also reviewed many other public documents to compile data, validate assumptions, and clarify open questions.
Primary Interviews and Surveys
Primary work focused on expert interviews and structured surveys with manufacturers, channel partners, EPC and plant engineering teams, and end users operating continuous monitoring and process control systems. Since this is a global market, the fieldwork checks covered major demand pockets across APAC, EMEA, and the Americas, and the discussions were used to confirm adoption patterns for in situ versus extractive setups, typical replacement cycles, and the buying triggers tied to compliance needs.
Distribution of primary research fieldwork respondents
| Company type | Respondent position | Region |
|---|---|---|
| Top tier: 39% | CXOs: 14% | APAC: 49% |
| Mid tier: 42% | Functional/Unit leaders: 36% | EMEA: 32% |
| Smaller Players: 19% | Managers: 50% | Americas: 19% |
Market-Sizing & Forecasting
Sizing starts with a top-down build where industrial activity and compliance-driven monitoring needs are translated into a demand pool for laser-based analyzers, then filtered by where laser spectroscopy is preferred. That demand pool is pressure-tested using selective bottom-up approximations, such as sampled average selling prices times estimated unit volumes for key applications, followed by distributor and integrator channel checks to adjust totals where needed.
Key inputs used in the model include the installed base intensity in emissions monitoring and process optimization, the share of in situ versus extractive deployments, typical replacement and upgrade cycles, and project timing in sectors such as power, oil and gas, mining and metals, and chemical and petrochemical. We also track how regulations and plant uptime requirements affect the mix of continuous monitoring versus laboratory and research use, because that shifts unit economics. For the forecast, scenario analysis is used around industrial production outlook, emissions compliance enforcement, and capex cycles, then the final path is aligned with what interviewees report for budgets and procurement timing.
Where unit-level detail is thin in smaller countries, the model uses proxy indicators such as sector output and installed capacity to reduce overfitting, then normalizes back to regional totals through the review steps.
Data Validation & Update Cycle
Outputs are validated through consistency checks across regions, applications, and implied pricing so totals do not conflict with known demand signals. We review unusual jumps, outlier ASP movements, or share shifts, and then re-check assumptions with a follow-up call when the variance cannot be explained through public events.
Each dataset and calculation step is reviewed by an analyst peer before sign-off. The model logic is also compared against independent indicators such as industrial production direction and regulation timelines. The report is refreshed annually, and interim updates are made when a material policy change, capacity addition, or major end-use swing is observed, followed by a final pre-delivery refresh pass so clients receive the latest view.
Mordor Intelligence's Laser Based Gas Analyzers Market Size Measured Against Other Published Estimates
Published market sizes for laser-based gas analyzers often differ because firms do not draw the same line around what counts as a laser analyzer and where revenue is recognized. Variations can also come from the base year used, whether pricing is averaged or application-specific, and how strongly assumptions are checked with system integrators and end users.
By tracking application-level deployments and refreshing the in situ versus extractive revenue split each year, Mordor Intelligence keeps the number focused on laser-based analyzer revenue for industrial monitoring rather than mixing in broader gas analyzer, detector, or sensor categories. In some external work, the gap is mainly driven by including portable detection formats, wider product sets, or using a longer forecast frame that applies a uniform growth rate without re-checking ASP movement and compliance timing.
Benchmark comparison
| Source | Market Size | Gaps in Research Methodology |
|---|---|---|
| Mordor Intelligence | USD 578.03 M (2025) | |
| Industry Data Publisher A | USD 538.00 M (2025) | Uses a lower 2025 value that appears to rely more on shipment-based rollups and a tighter device definition, which can undercount project-led systems delivered through integrators and EPC routes. |
| Industry Press Brief B | USD 3.15 B (2024) | Covers a broader laser gas analyzer universe and likely includes fixed and portable formats across wider end uses, which lifts totals versus a strict laser-based analyzer scope tied to industrial monitoring and compliance. |
The spread in the table is mostly explained by scope boundaries and how pricing and volumes are translated from end-use demand into revenue. When the scope is held to laser-based analyzers and the adoption drivers are checked against compliance and plant operating patterns, the total becomes easier to trace and repeat from year to year.


Key Questions Answered in the Report
How big is the Laser-based Gas Analyzers Market?
The laser-based gas analyzers market size reached USD 617.22 million in 2026 and is projected to climb to USD 856.82 million by 2031.
Which segment is growing fastest within this market?
Quantum cascade laser technology shows the quickest adoption, expanding at a 7.33% CAGR through 2031 due to its mid-infrared trace-gas capabilities.
How are emissions regulations influencing demand?
Post-2025 rules in Asia-Pacific and Africa require multi-pollutant continuous monitoring, adding roughly +1.2% to the overall CAGR.
Why are healthcare facilities investing in laser analyzers?
Hospitals need continuous anesthetic-gas and volatile-organic-compound tracking to meet ASHRAE 170-2021 and occupational exposure limits.
Which region will post the highest growth rate?
Asia-Pacific is expected to register a 7.55% CAGR through 2031, driven by Chinese and Indian air-quality mandates and subsidy programs.
Page last updated on:






