
Large Format Display Market Size and Share
Market Overview
| Study Period | 2020 - 2031 |
|---|---|
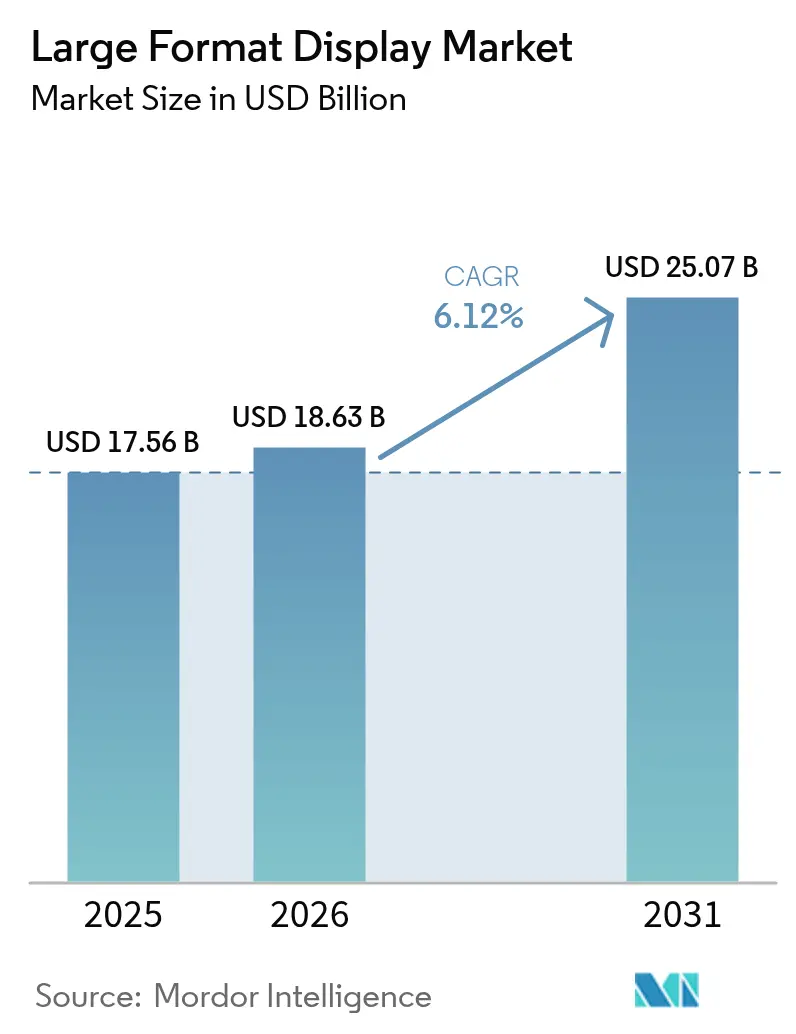
| Market Size (2026) | USD 18.63 Billion |
| Market Size (2031) | USD 25.07 Billion |
| Growth Rate (2026 - 2031) | 6.12 % |
| Fastest Growing Market | Asia Pacific |
| Largest Market | North America |
| Market Concentration | Medium |
Major Players *Disclaimer: Major Players sorted in no particular order Image © Mordor Intelligence. Reuse requires attribution under CC BY 4.0. | |
Large Format Display Market Analysis by Mordor Intelligence
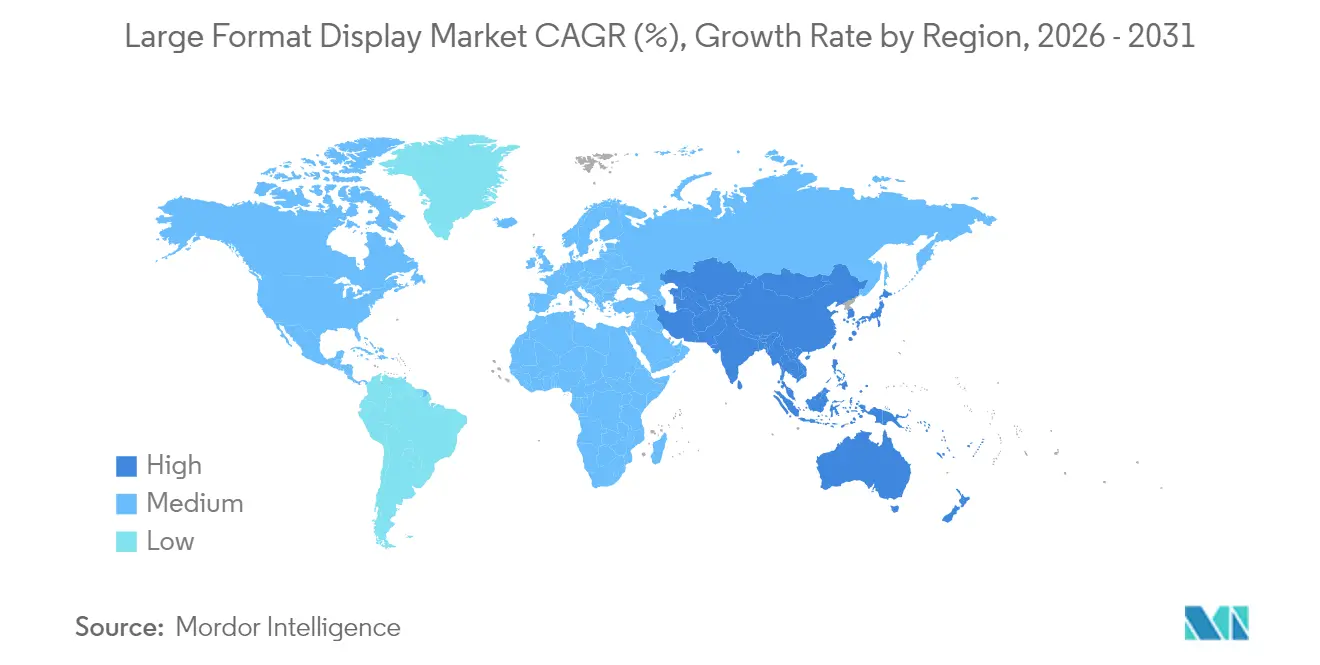
The large format display market size is expected to grow from USD 17.56 billion in 2025 to USD 18.63 billion in 2026 and is forecast to reach USD 25.07 billion by 2031 at 6.12% CAGR over 2026-2031. Momentum is shifting from pure hardware sales toward software-centric ecosystems, with roughly half of digital-signage spending now directed toward content-management platforms and cloud services, rather than panels alone. Video walls retained a 52.74% large format display market share in 2024, however, fine-pitch modular LED is narrowing the performance gap and eroding the segment’s price premium. Displays above 80 inches represent the fastest-growing size class, expanding at 6.88% as virtual-production studios, control rooms, and immersive retail lean on seamless canvases that only Micro LED and advanced LED architectures can deliver at scale. Indoor deployments accounted for 64.73% of 2024 revenue, driven by hybrid-work collaboration suites and programmatic digital-out-of-home (DOOH) networks that replace static posters with data-driven, cloud-served ads. Asia-Pacific now anchors the demand outlook with a forecast 7.02% CAGR as municipal bodies in China and India embed large format displays into smart-city infrastructure.
Key Report Takeaways
- By display type, video walls commanded 52.02% of the large format display market share in 2025 while stand-alone displays are set to post the fastest 6.64% CAGR through 2031.
- By screen size, the 41–60 inch class accounted for 38.25% of the large format display market size in 2025, whereas panels above 80 inches are advancing at 6.53% CAGR.
- By application, indoor venues represented 64.05% of 2025 revenue, yet outdoor installations are projected to grow at a 6.76% CAGR during 2026-2031.
- By end-user, commercial settings held 46.10% share of the large format display market size in 2025; infrastructural deployments will register the highest 6.71% CAGR through 2031.
- By geography, North America led with 35.25% share in 2025, while Asia-Pacific is slated to achieve a 6.68% CAGR to 2031.
Note: Market size and forecast figures in this report are generated using Mordor Intelligence’s proprietary estimation framework, updated with the latest available data and insights as of 2026.
Market Trends and Insights
Drivers Impact Analysis of Large Format Display Market*
| Driver | (~) % Impact on CAGR Forecast | Geographic Relevance | Impact Timeline |
|---|---|---|---|
| Rise in high-brightness, energy-efficient LED video-wall solutions | +1.2% | Global, with strongest adoption in North America and Asia-Pacific | Medium term (2-4 years) |
| Soaring demand for digital signage in retail and smart-city infrastructure | +1.5% | Global, Asia-Pacific core with spill-over to MEA and South America | Short term (≤ 2 years) |
| Proliferation of 4K/8K and interactive displays across education and corporate collaboration | +1.0% | North America and Europe, expanding to Asia-Pacific | Medium term (2-4 years) |
| Cost-per-inch decline of large-area LCD/LED panels | +0.9% | Global | Long term (≥ 4 years) |
| Virtual-production LED volumes accelerating studio adoption | +0.7% | North America and Europe, emerging in Asia-Pacific | Medium term (2-4 years) |
| AI-driven, cloud-based CMS enabling real-time content personalization | +1.1% | Global, led by North America and Europe | Short term (≤ 2 years) |
| Source: Mordor Intelligence | |||
Rise in High-Brightness, Energy-Efficient LED Video-Wall Solutions
Flip-chip chip-on-board (COB) technology is delivering IP67 durability, lower thermal loads, and 3,840 Hz refresh rates, cutting lifetime operating costs for 24/7 command-center displays. Philips’ Unite LED 5000 Series, unveiled at InfoComm 2024, uses common-cathode COB modules as fine as P0.78 to extend warranty coverage from 2 to 3 years, with optional 5-year service plans. Samsung’s long-running dominance likewise stems from similar durability investments, yet increasing commoditization across Asian fabs is compressing hardware margins and pushing incumbents to differentiate through software support offerings.[1] Upcoming European Union draft rules aimed at reducing standby and network-standby power will further favor energy-optimized LED architectures.[2]
Soaring Demand for Digital Signage in Retail and Smart-City Infrastructure
Retail-media networks are accelerating in-store digitization, but in-aisle screens still capture less than 1% of total retail-media budgets, translating into a USD 690 million upside for U.S. retailers alone by 2028. Samsung’s July 2024 positioning frames large format displays as the connective tissue for smart cities, integrating wayfinding, transit alerts, and emergency messaging into one managed platform. VIOOH’s 2024 study found 27% of recent campaigns included programmatic DOOH buys, a share likely to reach 35% by end-2026 as advertisers seek dynamic, data-enriched impressions. Municipal agencies in Asia-Pacific are already embedding similar functionality into public tenders, making the large format display market an infrastructure line item rather than a discretionary purchase.
Proliferation of 4K/8K and Interactive Displays Across Education and Corporate Collaboration
Universities are scaling campus-wide refresh cycles that lock vendors in for up to a decade. Panasonic disclosed that the University of St. Thomas replaced more than 300 legacy projectors and displays with 4K laser solutions to meet hybrid-learning mandates.[3] Corporate buyers mirror this trend, Manulife Plaza integrated 65-inch 4K displays and PTZ cameras into convertible boardrooms spanning 450,000 square feet to preserve collaboration equity for on-site and remote workers. Interactivity and ultra-HD resolution enable annotation, real-time polling, and content-rich presentations, pushing demand for touch-enabled large format display market solutions that bridge physical and virtual meeting spaces.
AI-Driven, Cloud-Based CMS Enabling Real-Time Content Personalization
Content-management software is evolving from scheduling utilities into AI engines that optimize ad slots, segment audiences, and auto-generate creatives. Samsung’s VXT platform delivers cloud-native device monitoring, audience analytics, and integrated ad networks, while LG Business Cloud marries CMS with electric-vehicle charging kiosks to monetize dwell time. Facial recognition and natural-language models allow messaging to adjust to demographics or contextual triggers, though GDPR and similar frameworks require robust consent and data-minimization workflows, favoring larger vendors with mature compliance resources.
Restraints Impact Analysis of Large Format Display Market*
| Restraint | (~) % Impact on CAGR Forecast | Geographic Relevance | Impact Timeline |
|---|---|---|---|
| High initial capex and TCO for large format installations | -0.8% | Global, particularly acute in price-sensitive South America and MEA markets | Short term (≤ 2 years) |
| Intensifying competition from mobile / online advertising channels | -0.6% | Global, strongest in North America and Europe | Medium term (2-4 years) |
| Installation and maintenance complexity across multi-panel walls | -0.4% | Global | Medium term (2-4 years) |
| Emerging energy-consumption regulations for high-nit displays | -0.5% | Europe and North America, expanding to Asia-Pacific | Long term (≥ 4 years) |
| Source: Mordor Intelligence | |||
High Initial Capex and Total Cost of Ownership for Large Format Installations
Flagship projects can exceed USD 8 million, as shown by Captivision’s 16,000-square-foot transparent media-glass façade at COEX Magok Le-West in Seoul, completed in 2024. Costs encompass structural reinforcements, power upgrades, and multi-year maintenance contracts. Integrators such as Acuity Brands, which agreed to acquire QSC for USD 1.215 billion, are bundling audio-visual, lighting, and control systems into turnkey deals to amortize expenses over service contracts. Nevertheless, mid-market enterprises and cash-constrained municipalities often delay projects or limit deployments to single-screen pilot programs, slowing the near-term trajectory of the large format display market.
Intensifying Competition from Mobile and Online Advertising Channels
Programmatic DOOH frequently draws budget reallocations rather than fresh spend; VIOOH reported that 81% of funds came from other digital channels when DOOH was purchased by programmatic teams. Marketers cite the absence of unified cross-channel metrics and granular conversion tracking as key barriers. While audience-measurement platforms are improving, mobile and social networks still deliver richer attribution, placing pressure on display network operators to prove ROI and maintain CPMs.
*Our forecasts treat driver/restraint impacts as directional, not additive. The impact forecasts reflect baseline growth, mix effects, and variable interactions.
Large Format Display Market Segment Analysis
By Display Type:
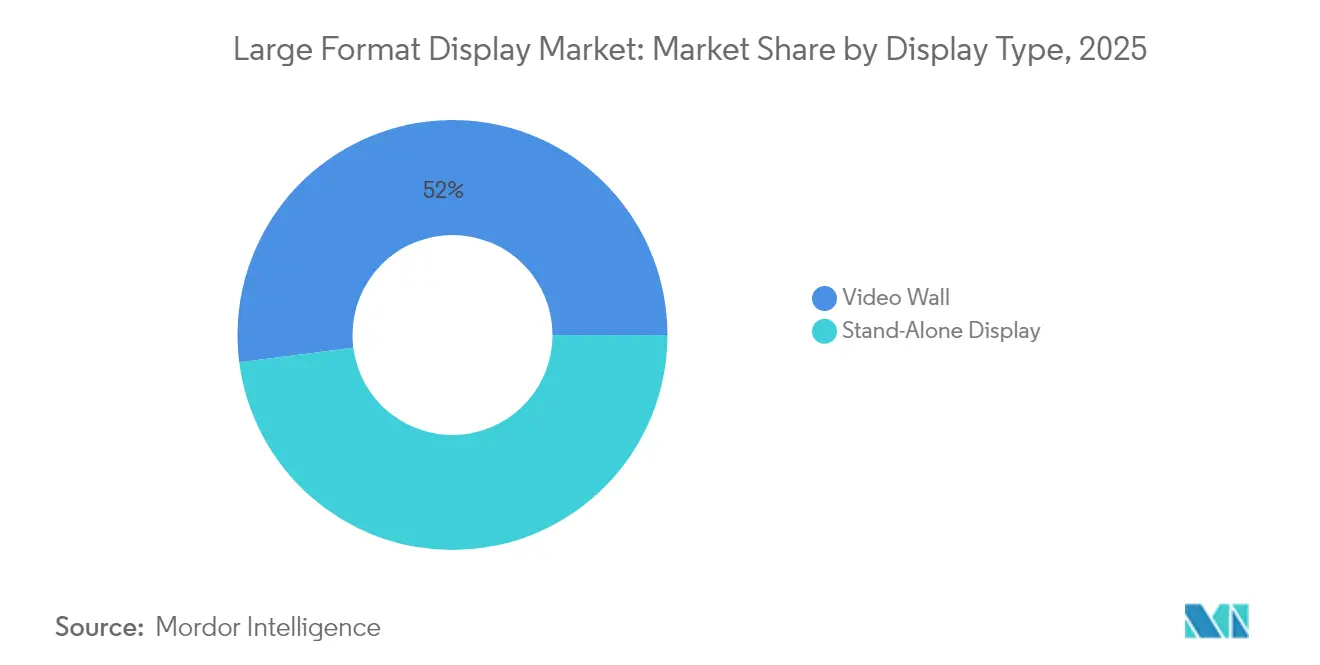
Video Walls Dominate, Stand-Alone Displays Expand in Niche VerticalsIn 2025, video walls captured 52.02% of the large format display market share, while stand-alone displays are projected to achieve the fastest growth rate at 6.64% CAGR through 2031. The large format display market size for stand-alone units remains smaller but is gaining share in quick-service restaurants, corporate lobbies, and wayfinding kiosks, where drop-in replacement and modular mounting are paramount. Philips’ Unite LED 5000 Series ships in 27.1-inch 16:9 cabinets that snap together into 8K canvases, blending video-wall continuity with single-panel serviceability. LG’s 118-inch MAGNIT Micro LED provides an All-in-One alternative for luxury hospitality, circumventing bezel management altogether.
The performance-price gap is narrowing as COB LED costs fall and management software converges across form factors. Samsung’s VXT and LG Business Cloud allow multi-site fleets to mix video walls and stand-alone panels under one dashboard, shifting differentiation to analytics and ad-tech hooks. Consequently, integrators report higher attach rates for managed-service contracts, a trend that elevates recurring revenue in the large format display market.

By Display Size:
Above 80 Inches Chart the Fastest Growth CurvePanels exceeding 80 inches are on track to register a 6.53% CAGR to 2031, the quickest among size tiers, driven by virtual-production stages, control-room overviews, and experiential retail façades. In contrast, 41–60 inch models held the lion’s share at 38.25% in 2025 thanks to corporate huddle spaces and drive-through menus. TCL Technology revealed that 79% of its 2024 shipments exceeded 55 inches, underscoring supply readiness for ever-larger canvases. Architectural installations add transparency and curvature to the size mix; Captivision’s media glass and LG’s Transparent OLED walls enable designers to meld digital and physical realms, feeding premium niches of the large format display market.
Energy consumption looms as a regulatory wildcard. The European Commission’s forthcoming ecodesign rules target high-nit displays, a category dominated by panels larger than 80 inches. Vendors must therefore balance luminous output against stricter efficiency thresholds without inflating total cost of ownership.
By Application:
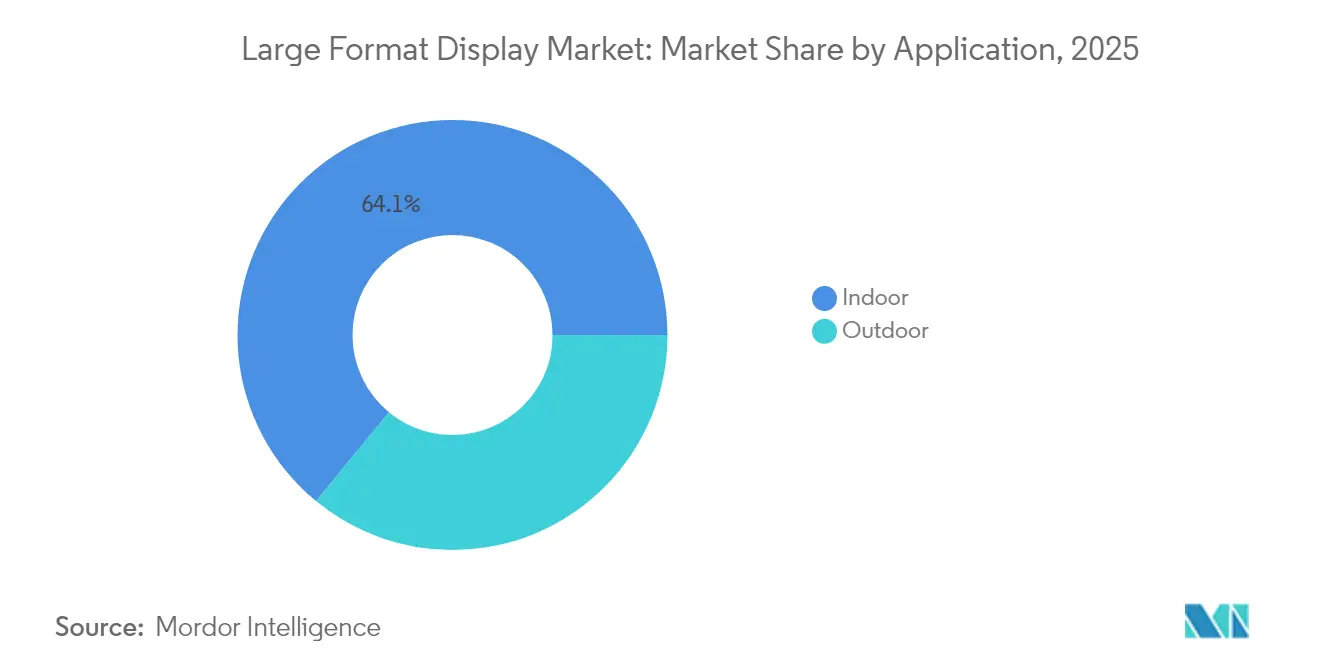
Indoor Revenues Lead, Outdoor Networks AccelerateIndoor environments captured 64.05% of 2025 sales or USD 11.24 billion within the large format display market size. Controlled lighting conditions allow thinner profiles and lower ingress-protection ratings, which reduce bill-of-materials costs. Outdoor deployments, however, are gaining momentum at a forecast 6.76% CAGR as municipalities and media owners upgrade roadside billboards and transit shelters to IP67, 5,000-nit LED modules that support programmatic DOOH trades. Samsung projects that 50% of global DOOH campaigns will be programmatic by 2026, representing a doubling of 2023 volumes. Proof-of-play verification and audience analytics remain prerequisites for premium outdoor CPMs, prompting display vendors to integrate camera sensors and edge AI into their hardware offerings.
Indoor retail screens benefit from proximity to the point of sale. Survey data show 75% of shoppers scanned QR codes displayed in-store during 2024, converting physical engagement into e-commerce baskets. As generative-AI engines personalize messaging on the fly, the revenue mix tilts further toward software licensing in the large format display market.
By End-User:
Infrastructure Deployments Outpace Commercial InstallationsCommercial entities, retailers, hotels, and offices, held 46.10% of 2025 revenue, but infrastructure users, chiefly city governments and transit agencies, will grow at a 6.71% CAGR as smart-city blueprints mature. Samsung’s smart-connected-city initiative integrates displays with IoT sensors for transit updates and emergency alerts, generating advertising revenue during idle cycles. LG’s partnership with ChargePoint embeds large screens into EV charging stations, monetizing the 20–40-minute dwell window.
Regulatory procurement is increasingly tied to sustainability mandates. The EU’s Ecodesign for Sustainable Products Regulation obliges vendors to supply 10-year software support and Digital Product Passports by 2027. Vendors equipped with lifecycle-tracking systems will therefore capture a disproportionate share of forthcoming infrastructure tenders within the large format display market.
Geography Analysis
North America Large Format Display Market
North America accounted for 35.25% of 2025 revenue in the large format display market, buoyed by hybrid-work upgrades, stadium video-wall renovations, and retail-media network rollouts. Daktronics reported an 18% spike in Live Events revenue to USD 109 million in Q1 FY2025 after winning arena projects such as UBS Arena and Allegiant Stadium, though heavy consulting and IT outlays compressed near-term margins. Programmatic DOOH saw U.S. advertisers boost spend by 29% on average in 2024, advancing the shift from static boards to cloud-managed screens.
APAC Large Format Display Market
Asia-Pacific is projected to log a 6.68% CAGR to 2031, the fastest of any region. TCL Technology’s Guangzhou G8.6 oxide line ran at full capacity throughout 2024 and contributed 21% of CSOT revenue, cementing China’s dominance in large format LCD and LED substrates. South Korea’s LG Electronics invested in Mo-Sys Engineering to integrate Micro LED panels with XR camera tracking, targeting regional studios adopting in-camera VFX. India’s Smart-City Mission plans to integrate real-time passenger information systems into 100 urban centers by 2027, though fragmented procurement and fiscal constraints moderate near-term volumes.
Europe Large Format Display Market
Europe faces the most stringent regulatory headwinds. The European Commission’s November 2024 consultation aims to slash electricity use among the 70 million electronic displays sold annually by tightening standby-power caps and mandating repairability. Vendors must embed recycled content and substance-of-concern tracking, raising entry barriers. Germany, France, and the UK are prioritizing digital signage for multimodal transit hubs, converting legacy paper timetables to dynamic displays that double as advertising inventory.
MEA and South America Large Format Display Market
South America and the Middle East and Africa collectively generate under 10% of global revenue but represent long-range opportunities. Brazil and Mexico are digitizing quick-service restaurant menus, yet economic volatility constrains capital spend. The UAE and Saudi Arabia allocate smart-city budgets to immersive façades in airports and malls aligned with tourism initiatives. Power-reliability issues in parts of Africa continue to limit 24/7 operation, though telco tower-side displays are emerging as alternative advertising nodes.
Regulatory Landscape
Energy efficiency and product sustainability rules are tightening for large format displays, especially in Europe. The EU Ecodesign framework for electronic displays (Regulation (EU) 2019/2021) continues to anchor power-demand and energy-efficiency requirements, while Regulation (EU) 2024/1781 (Ecodesign for Sustainable Products Regulation, adopted in June 2024) expands the regulatory direction toward durability, repairability, and broader sustainability attributes that affect commercial signage and video-wall deployments.
Regulatory requirements also shape market access and feature roadmaps outside the EU. In Great Britain, the Ecodesign for Energy-Related Products and Energy Information (Amendment) Regulations 2026 (March 2026) align aspects of UK ecodesign administration with evolving EU requirements, influencing compliance documentation and product labeling strategies for vendors serving both markets. In the United States, the U.S. Department of Energy has ongoing certification and reporting obligations for covered equipment (including updated reporting expectations highlighted in May 2025), and the FCC set an August 2026 compliance milestone for readily accessible closed captioning display settings, reinforcing accessibility-by-design in relevant display use cases.
Value Chain Analysis
The value chain spans upstream materials (glass substrates, LED packages, driver ICs, polarizers, and optical films), panel/module manufacturing (LCD, direct-view LED, Micro LED), and midstream assembly and integration (cabinets, controllers, mounting, power, networking, and calibration). Downstream, distributors and AV integrators bundle displays with content-management software (CMS), device management, and ongoing services, and then deliver into end markets such as retail, corporate collaboration, education, transportation, and smart-city infrastructure, where installation quality and managed services often determine lifetime performance.
Recent supply-side shifts highlight both consolidation and regionalization. In April 2025, LG Display transferred its Guangzhou Gen 8.5 LCD line to TCL CSOT (renamed T11), reinforcing the concentration of large-generation capacity among fewer Asian manufacturers. In parallel, tariff and trade uncertainty has pushed display makers toward production-to-order utilization strategies and encouraged near-shoring of selected assembly steps; for example, Azumo, Ubiqconn, and E3 Displays signed a July 2025 MOU to pursue on-shore module assembly in Phoenix, Arizona to mitigate tariff exposure for certain display modules. Brand procurement strategies also reflect this environment, with reports in 2025 of Samsung planning sizable LCD panel sourcing from BOE to rebalance supplier dependence, while integrators and platform providers continue to capture more value through turnkey deployment, CMS, and service contracts.
Competitive Landscape
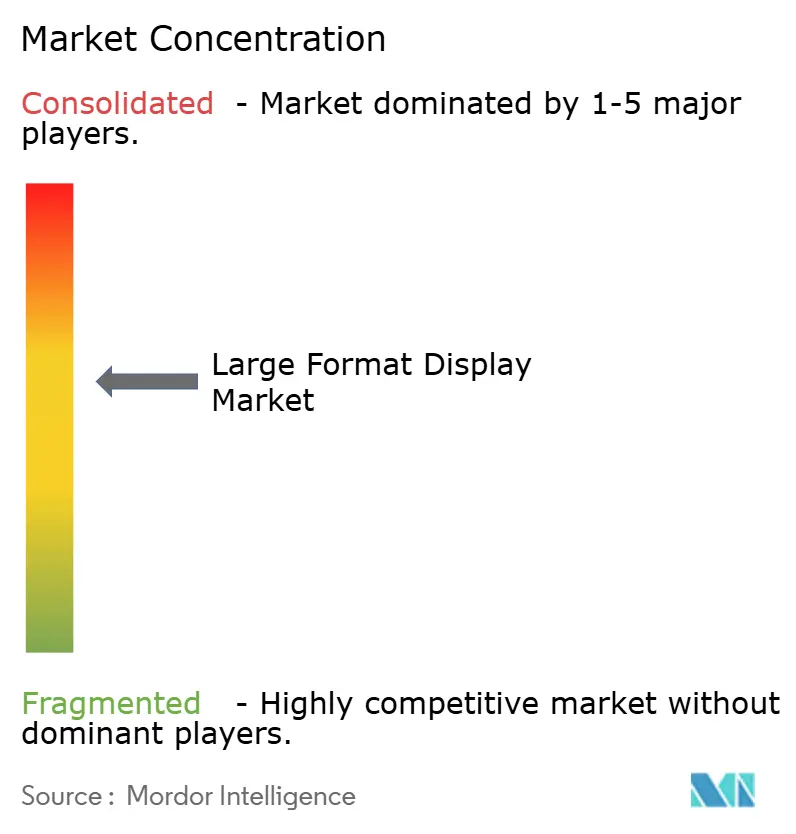
The large format display market remains fragmented on the software side, where the top five CMS providers controlled only 12.79% revenue in 2022. Conversely, hardware consolidation is underway as panel makers vertically integrate into software and managed services. Samsung marked its 15th consecutive year as global signage leader by bundling VXT cloud CMS, remote monitoring, and ad-tech hooks with its QLED and LED portfolio, building stickier annual-recurring-revenue streams. LG’s seed stake in Mo-Sys Engineering extends its Micro LED panels into virtual production pipelines, tapping into the fast-growing content studio niche.
TCL Technology invested RMB 10.309 billion (USD 1.42 billion) in R&D during 2024, focusing on Pol-Less LCD, Mini-LED backlights, and 1,512 PPI VR panels to escape commodity margin compression. Smaller innovators carve out architectural niches, such as Captivision’s transparent media glass, which generated USD 8 million from a single Seoul façade, proving an appetite for building-integrated displays despite project-based scalability limits.
Regulation is sharpening competitive edges. The EU’s Digital Product Passport mandate will exclude vendors lacking lifecycle transparency, advantaging incumbents with established compliance teams. Integrators are also consolidating; Acuity Brands’ USD 1.215 billion acquisition of QSC unites audio, video, lighting, and building-management stacks under one umbrella, simplifying procurement for enterprise buyers. Overall, suppliers that combine differentiated hardware, cloud software, and compliance credentials are positioned to outpace pure-play panel vendors in the large format display market.
Large Format Display Industry Leaders
-
Panasonic Corporation
-
Barco NV
-
LG Electronics
-
Samsung Electronics Co., Ltd
-
NEC Corporation
- *Disclaimer: Major Players sorted in no particular order
Large Format Display Market Companies Covered in this Report
- Samsung Electronics Co., Ltd.
- LG Display Co., Ltd.
- Sharp NEC Display Solutions, Ltd.
- Leyard Optoelectronic Co., Ltd.
- Barco NV
- Panasonic Holdings Corp.
- Sony Group Corp.
- AU Optronics Corp.
- TPV Technology Ltd.
- ViewSonic Corp.
- Christie Digital Systems USA, Inc.
- Daktronics, Inc.
- Absen Optoelectronic Co., Ltd.
- Unilumin Group Co., Ltd.
- Delta Electronics, Inc.
- AOTO Electronics Co., Ltd.
- Planar Systems, Inc.
- DynaScan Technology Corp.
- Koninklijke Philips N.V.
- BenQ Corp.
- E Ink Holdings, Inc.
- Prysm Systems, Inc.
Market Opportunities and Future Outlook
Opportunity is expanding where buyers value faster deployment and simpler lifecycle management over bespoke, multi-vendor builds. All-in-One (AIO) and front-serviceable direct-view LED packages reduce installation and maintenance complexity that constrains multi-panel video walls, and suppliers are actively productizing around this need: Samsung introduced a split-panel design for The Wall All-in-One at ISE 2026, while LG expanded its MAGNIT DVLED portfolio and added an ultra-wide 98-inch 32:9 AIO DVLED model (LUPA098) at InfoComm 2026 for public-space layouts that previously relied on tiled LCD or custom LED cabinets.
Premium, application-specific large-format deployments are also creating whitespace beyond traditional retail signage and corporate meeting rooms. Samsung introduced a 14-meter standard size for its Onyx Cinema LED at CinemaCon 2026, targeting premium large format theaters with a standardized offering that can accelerate procurement and integration. On the manufacturing and technology roadmap side, capacity investments underpin broader availability of next-generation display formats used in large-area professional environments; TCL CSOT reported a USD 4.34 billion investment and topping-out of its t8 Gen 8.6 inkjet-printed OLED line in Guangzhou (May 2026), while BOE commenced mass production at a new flexible AMOLED line in Chengdu with a 63 billion yuan investment (June 2026). These moves reinforce a pipeline of higher-performance panels and form factors that support immersive venues, virtual production, transportation hubs, and smart-city tenders, while keeping energy efficiency and compliance readiness central to product planning.
Recent Industry Developments in Large Format Display Market
- June 2026: LG Electronics USA expanded its LG MAGNIT DVLED lineup and launched a 98-inch All-in-One 32:9 Ultra Stretch Indoor DVLED display (LUPA098) at InfoComm 2026. The additions emphasize faster installation and simplified servicing for public-space and enterprise deployments, supporting integrators that package large format displays with recurring software and managed services.
- April 2026: Samsung introduced a 14-meter standard size for its Onyx Cinema LED display at CinemaCon 2026 for premium large format theaters. A standardized larger canvas helps cinema operators and integrators streamline auditorium design and procurement while extending direct-view LED deeper into large-venue installations.
- June 2024: The European Union adopted Regulation (EU) 2024/1781, the Ecodesign for Sustainable Products Regulation, expanding the policy framework beyond energy use toward durability, repairability, and broader sustainability requirements. This shift increases the importance of compliance documentation and lifecycle-oriented design for large format display vendors supplying European commercial and infrastructure projects.
Large Format Display Market Report Scope and Research Methodology
Market Definition and Coverage
The large format display market is defined as revenues generated from large digital screens used to deliver visual information in indoor and outdoor settings, across commercial, infrastructure, institutional, and industrial environments. Values are tracked in USD and reflect sales of large-format display systems within the defined scope.
Scope exclusions: This sizing excludes small consumer screens and non-display substitutes like projection-only setups when they are not sold as large format display hardware.
Segments Covered in This Report
- By Display Type
- Video Wall
- Stand-Alone Display
- By Display Size
- 32–40 inch
- 41–60 inch
- 61–80 inch
- Above 80 inch
- By Application
- Indoor
- Outdoor
- By End-User
- Commercial
- Infrastructural
- Institutional and Industrial
- By Geography
- North America
- United States
- Canada
- South America
- Brazil
- Mexico
- Argentina
- Rest of South America
- Europe
- Germany
- United Kingdom
- France
- Italy
- Rest of Europe
- Asia-Pacific
- China
- Japan
- India
- South Korea
- Rest of Asia-Pacific
- Middle East and Africa
- Middle East
- United Arab Emirates
- Saudi Arabia
- Rest of Middle East
- Africa
- South Africa
- Nigeria
- Rest of Africa
- Middle East
- North America
Data Sources, Market Sizing, and Validation
Desk Research
Desk research was used to set the market boundaries and to build a clean demand map before modeling started. We relied on public and official sources such as USITC trade statistics, UN Comtrade, OECD indicators, World Bank macro series, and regulator and standards references relevant to commercial display safety and installations, which helped anchor trade flow direction and spending cycles.
To tighten assumptions, we also reviewed annual reports, earnings decks, and product disclosures from major display ecosystem participants, along with reputable press coverage of retail and transport digital signage rollouts. Where needed, paid subscriptions for company financials and intelligence, patent databases, and an import or export shipment-level database were used to confirm product mix shifts and to cross-check the timing of major deployment waves. These examples are not exhaustive, and many other sources were also used for data collection, validation, and research clarification.
Primary Interviews and Surveys
Primary work focused on validating what gets counted as a large format display sale, and how pricing changes as screen size, brightness, and deployment setting vary. We spoke with display OEM-side roles, system integrators, installers, and large end users across APAC, EMEA, and the Americas, so regional procurement cycles and indoor versus outdoor deployment shares were not treated as the same across geographies.
Distribution of primary research fieldwork respondents
| Company type | Respondent position | Region |
|---|---|---|
| Top tier: 31% | CXOs: 17% | APAC: 46% |
| Mid tier: 48% | Functional/Unit leaders: 33% | EMEA: 31% |
| Smaller Players: 21% | Managers: 50% | Americas: 23% |
Market-Sizing & Forecasting
Sizing starts with a top-down build where demand is reconstructed from installation activity and replacement cycles across major venues, then filtered by the share served by large format displays across indoor and outdoor use. Once the demand pool is set, results are checked using selective bottom-up approximations, such as sampled average selling price (ASP) by size band multiplied by estimated unit volumes for video walls and stand-alone displays, followed by an adjustment if gaps appear.
Inputs used in the model include screen size mix (32 to 40 inch through above 80 inch), video wall versus stand-alone adoption, indoor versus outdoor deployment ratio, tender and project timing for transport and public infrastructure, and regional commercial construction and retail refurbishment indicators. When data was thin for a country or a niche end user, proxy indicators were used first, then re-tested with interview feedback to avoid overstating smaller pockets.
For forecasting, we applied scenario analysis supported by a simple multivariate regression view, linking growth to macro spending cycles and rollout intensity in key end-user categories. Pricing progression is kept explicit by tracking expected ASP movement by size class and technology substitution patterns, rather than applying a single flat inflation factor.
Data Validation & Update Cycle
Validation is done through repeated cross-checks between the model output and independent signals, such as trade direction, project activity, and the implied unit-to-value relationship by size band. When a variance is large, the drivers are revisited and respondents are re-contacted to confirm whether it reflects a real shift, a timing issue, or a scope mismatch.
Before sign-off, the work is reviewed in steps, starting with logic checks on assumptions, followed by consistency checks across regions and end users, and then a final review to confirm the story matches the numbers. Reports are refreshed annually, with interim updates when major technology shifts or demand shocks occur, and a final pre-delivery pass to ensure the published view reflects the latest information available.
Mordor Intelligence's Large Format Display Market Size Compared Against Other Published Estimates
Published market sizes for large format displays can vary even when the topic name sounds identical, because each publisher sets different cutoffs for screen size, counts different parts of the system, and chooses a different current-year anchor for forecasting. Differences also show up when one estimate leans heavily on shipment proxies, while another leans on end-user spending, which can move in different directions during rollout-heavy years.
Key gaps usually come from whether controllers, mounts, and accessories are treated as part of the market, how video walls are valued versus stand-alone units, and whether indoor commercial signage is bundled with outdoor billboard-led spending. Currency timing and refresh cadence also matter, since a fast-moving LED price curve can change the value outcome even if units keep rising.
Benchmark comparison
| Source | Market Size | Gaps in Research Methodology |
|---|---|---|
| Mordor Intelligence | USD 18.63 B (2026) | |
| Global Consultancy A | USD 15.09 B (2024) | Uses a component-led scope that can pull in controllers and accessories, and it anchors the current value in 2024, which can understate later-year demand uplift from large venue rollouts. |
| Industry Publisher B | USD 15.97 B (2024) | Anchors sizing in 2024 and applies a longer horizon, and its technology framing can include adjacent display classes, which shifts the value mix when pricing assumptions differ by format. |
The spread is mainly explained by year anchoring and what is counted around the display hardware, and those choices flow through into ASP and mix assumptions. By keeping the scope tied to video walls and stand-alone displays across the defined size bands, then stress-testing indoor and outdoor shares with channel feedback, the estimate stays traceable to clear demand drivers and refreshable inputs, which is the approach applied by Mordor Intelligence.
Key Questions Answered in the Report
What is the current value of the large format display market?
The large format display market size reached USD 18.63 billion in 2026.
How fast is the sector expected to grow?
Revenue is forecast to expand at a 6.12% CAGR, hitting USD 25.07 billion by 2031.
Which display type holds the largest share?
Video walls dominate, accounting for 52.02% of 2025 revenue.
Which screen size is expanding the quickest?
Panels larger than 80 inches show the fastest growth, advancing at a 6.53% CAGR through 2031.
Which region is projected to outpace others?
Asia-Pacific is expected to post the highest regional CAGR at 6.68% to 2031.