
Laboratory Robotics Market Size and Share
Market Overview
| Study Period | 2020 - 2031 |
|---|---|
| Market Size (2026) | USD 2.64 Billion |
| Market Size (2031) | USD 3.5 Billion |
| Growth Rate (2026 - 2031) | 5.76 % |
| Fastest Growing Market | Asia Pacific |
| Largest Market | North America |
| Market Concentration | Medium |
Major Players *Disclaimer: Major Players sorted in no particular order Image © Mordor Intelligence. Reuse requires attribution under CC BY 4.0. | |
Laboratory Robotics Market Analysis by Mordor Intelligence
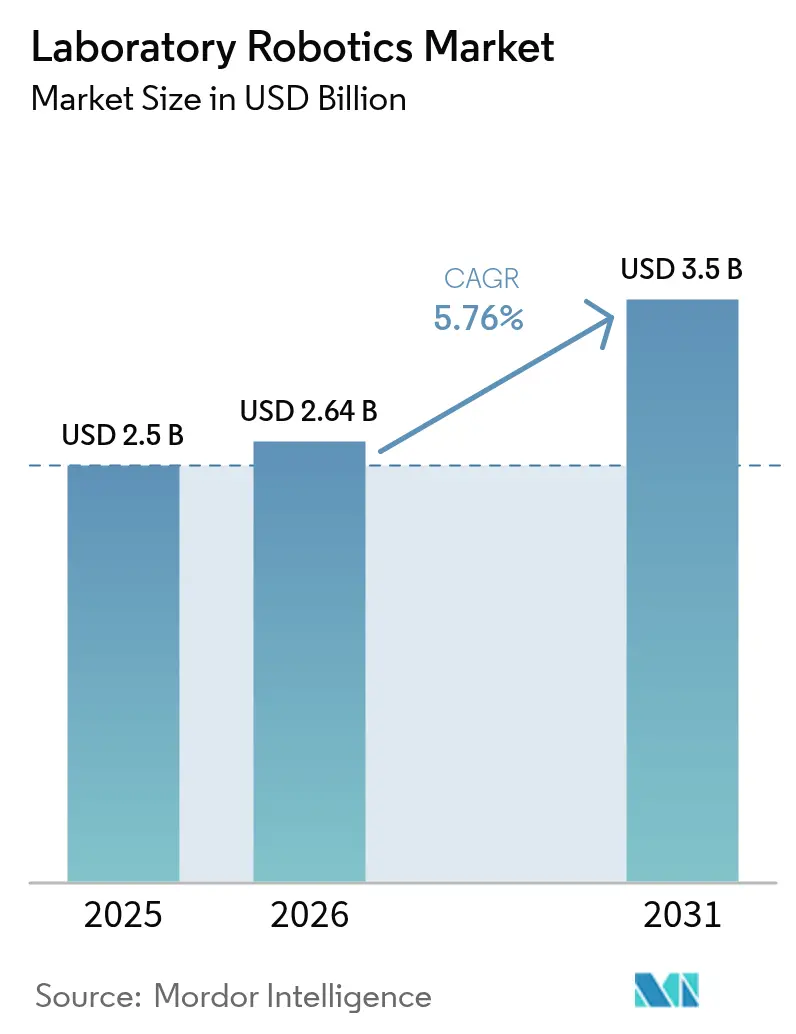
The laboratory robotics market size was valued at USD 2.5 billion in 2025 and estimated to grow from USD 2.64 billion in 2026 to reach USD 3.5 billion by 2031, at a CAGR of 5.76% during the forecast period (2026-2031). The measured trajectory signals a shift from emergency-driven procurement toward disciplined, long-term automation roadmaps. Demand for FDA-ready systems grows as the Laboratory Developed Tests final rule comes into force in 2025, pushing laboratories toward ISO-15189-compliant robotics. Precision medicine pipelines, sustainability mandates, and modular robotic ecosystems further reinforce investment decisions. Vendors that bundle software, instruments, and validation support continue to capture wallet share, while emerging competitors focus on acoustic dispensing, mobile manipulation, and AI integration to differentiate in the laboratory robotics market. [1]
Key Report Takeaways
- By application, clinical diagnostics held 40.70% of the laboratory robotics market share in 2025, whereas genomics solutions are set to grow at 11.05% CAGR through 2031.
- By end-user, pharmaceutical and biotechnology companies led with 38.05% revenue share in 2025; contract research organizations will expand at a 9.67% CAGR to 2031.
- By robot type, liquid-handling platforms accounted for 54.30% of the laboratory robotics market size in 2025; collaborative mobile lab robots are projected to register 13.22% CAGR to 2031.
- By workflow stage, analytical and assay execution dominated with 46.60% share of the laboratory robotics market size in 2025, while pre-analytical sample preparation is forecast to rise at 10.25% CAGR between 2026-2031.
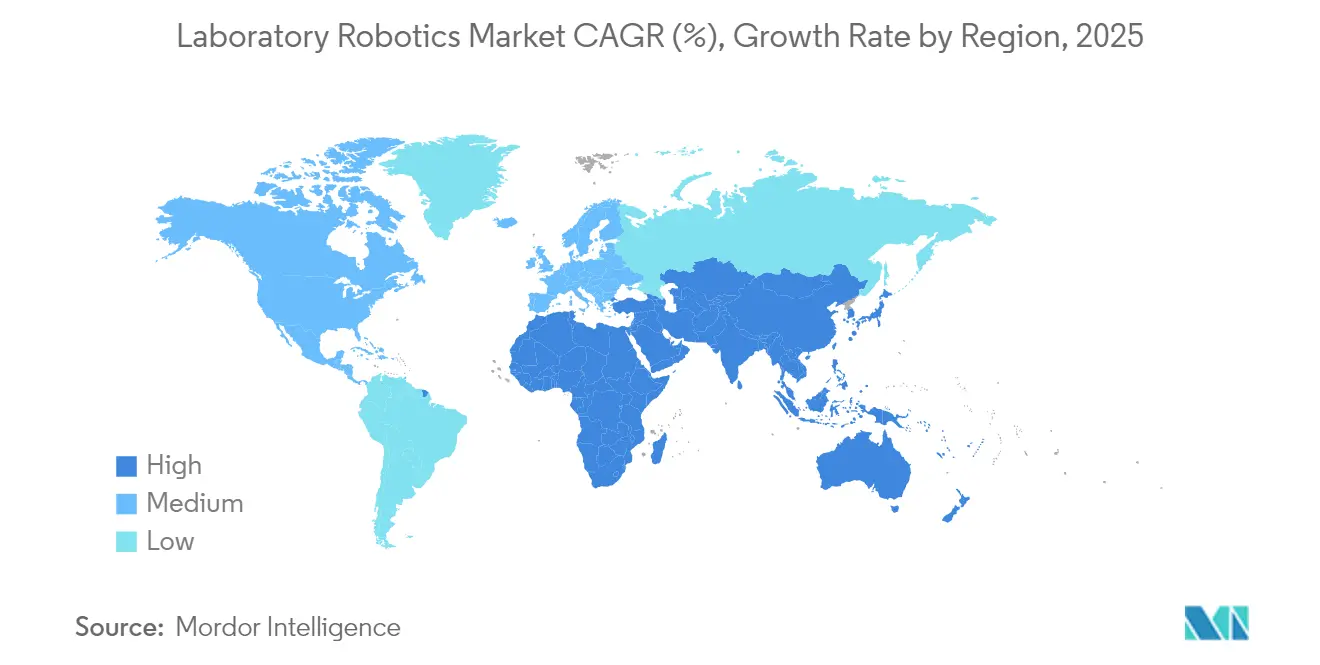
- By geography, North America captured 40.25% of the laboratory robotics market share in 2025; Asia-Pacific is poised for an 8.18% CAGR on the back of government-backed modernization programs.
Note: Market size and forecast figures in this report are generated using Mordor Intelligence’s proprietary estimation framework, updated with the latest available data and insights as of 2026.
Market Trends and Insights
Drivers Impact Analysis of Laboratory Robotics Market*
| Driver | (~) % Impact on CAGR Forecast | Geographic Relevance | Impact Timeline |
|---|---|---|---|
| Rising demand for biosafety & error-free high-throughput screening | 1.80% | Global, with concentration in North America & EU | Medium term (2-4 years) |
| Acceleration of pandemic-preparedness programs (e.g., CEPI, BARDA funding) | 1.20% | North America & EU core, spill-over to APAC | Short term (≤ 2 years) |
| Growth of personalized medicine requiring flexible low-volume liquid handling | 1.50% | Global, early adoption in North America & EU | Long term (≥ 4 years) |
| Adoption of AI-enabled self-optimizing "lab of the future" cells | 0.90% | APAC core, expanding to North America & EU | Long term (≥ 4 years) |
| Corporate net-zero roadmaps favouring energy-efficient cobots | 0.70% | EU & North America, emerging in APAC | Medium term (2-4 years) |
| Integration of robotic micro-factories inside CDMOs | 0.60% | Global, with early gains in North America, EU, Asia | Medium term (2-4 years) |
| Source: Mordor Intelligence | |||
Rising Demand for Biosafety & Error-Free High-Throughput Screening
Bio-risk mitigation policies now require BSL-3 and BSL-4 facilities to eliminate manual contact with infectious samples. Automated lines at Mayo Clinic process more than 6 million assays annually while halving blood-draw volumes, demonstrating how robotics improve both safety and specimen stewardship. Integrated vision and AI modules flag pipetting anomalies in real time, satisfying data-integrity audits. Vendors add ultraviolet decontamination cycles that run between batches, allowing around-the-clock operation without compromising operator safety. These capabilities underpin steady demand within the laboratory robotics market, especially in reference labs and vaccine-testing centers.
Acceleration of Pandemic-Preparedness Programs
Public-health agencies allocate multibillion-dollar budgets that expressly call for surge-ready automation. CEPI and BARDA grants stipulate platforms that scale from research to mass testing within weeks. The University of Sheffield’s self-driving chemistry lab cut polymer discovery timelines by orders of magnitude through closed-loop AI-robot workflows. Manufacturers now design modular carts that laboratories can reconfigure for virology, serology, or vaccine potency assays on short notice. Preparedness funding thus acts as a tailwind for flexible systems across the laboratory robotics market. [2]
Growth of Personalized Medicine Requiring Flexible Low-Volume Liquid Handling
Next-generation sequencing and single-cell omics often need sub-microliter transfers that standard pipettes cannot replicate. Beckman Coulter’s Echo acoustic platform dispenses viscous or volatile reagents without tips, eliminating cross-contamination and consumable waste. As companion diagnostics gain regulatory clearance, oncology labs adopt robots that verify droplet volumes in real time, ensuring reproducibility. Such precision workflows sustain double-digit growth for genomics solutions inside the laboratory robotics market.
Adoption of AI-Enabled Self-Optimizing “Lab of the Future” Cells
Autonomous labs couple machine-learning engines with robotic arms to iterate experiments continuously. North Carolina researchers showed AI-guided systems executing hypothesis generation, experimentation, and analysis without human intervention. Commercial systems now integrate predictive-maintenance dashboards that trigger protocol rerouting when wear is detected, preserving uptime. Early deployments in materials science and drug discovery illustrate the productivity lift that persuades CFOs to fund end-to-end automation, reinforcing expansion of the laboratory robotics market.
Restraints Impact Analysis of Laboratory Robotics Market*
| Restraint | (~) % Impact on CAGR Forecast | Geographic Relevance | Impact Timeline |
|---|---|---|---|
| High capital intensity for ISO-15189 compliant installations | -1.40% | Global, particularly acute in emerging markets | Short term (≤ 2 years) |
| Scarcity of robotics-literate lab personnel | -0.80% | Global, with concentration in APAC & emerging markets | Medium term (2-4 years) |
| Legacy LIMS interoperability gaps | -0.60% | North America & EU primarily | Short term (≤ 2 years) |
| Cyber-security vulnerability of networked lab robots | -0.50% | Global, heightened in regulated industries | Medium term (2-4 years) |
| Source: Mordor Intelligence | |||
High Capital Intensity for ISO-15189 Compliant Installations
ISO 15189:2022 demands rigorous validation and documentation. A2LA accredited the first U.S. lab under the new standard in 2024, highlighting the extensive audit trail required for clinical-grade robotics. Life-science fitouts now average USD 837 per square foot, owing to redundant power, clean-room HVAC, and secure data backbones. Smaller facilities in Latin America and Africa often postpone purchases, tempering near-term uptake within the laboratory robotics market.
Scarcity of Robotics-Literate Lab Personnel
High-mix labs need staff who can script workflows, align vision systems, and troubleshoot electro-mechanical faults. Academia still teaches biology and mechanical engineering in silos, creating a pipeline gap noted by university researchers developing AI-robot testbeds. Vendors counter with drag-and-drop software and certification courses, yet talent scarcity continues to dampen broader deployment across the laboratory robotics market.
*Our forecasts treat driver/restraint impacts as directional, not additive. The impact forecasts reflect baseline growth, mix effects, and variable interactions.
Laboratory Robotics Market Segment Analysis
By Application:
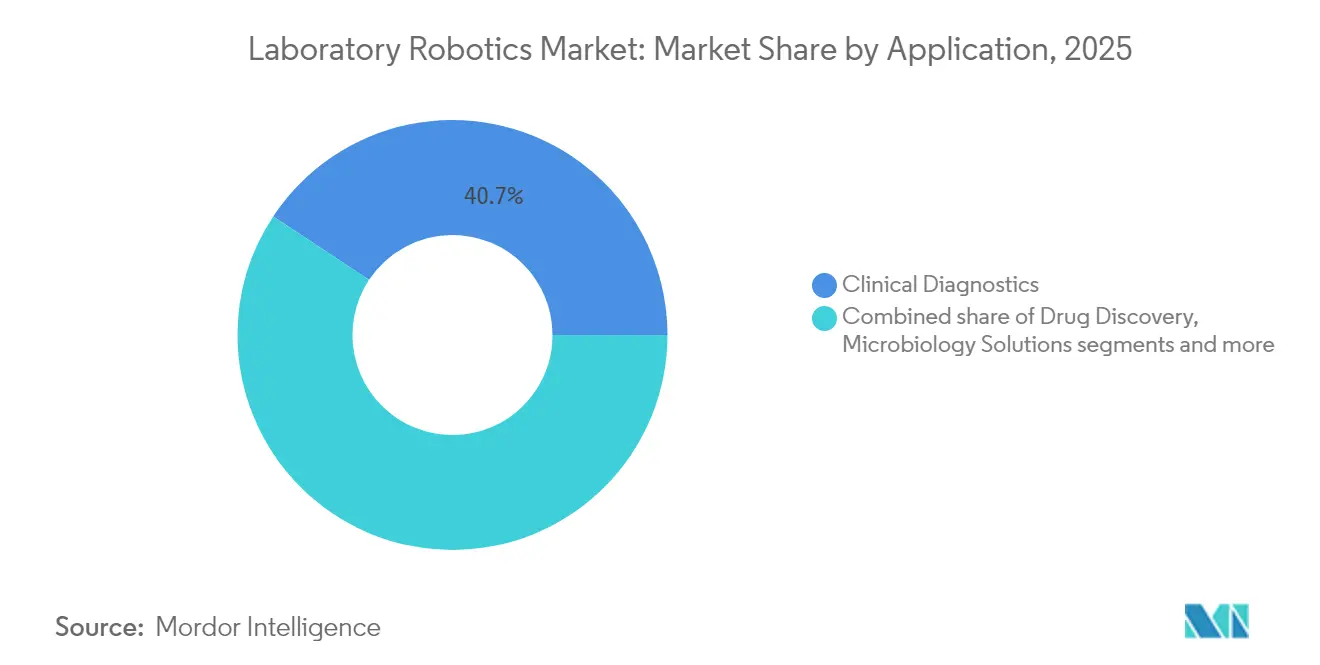
Genomics Solutions Drive Precision Medicine TransformationClinical diagnostics contributed the largest 40.70% share to the laboratory robotics market in 2025 as hospitals consolidated sample processing under high-throughput lines. Genomics solutions, however, are charted for 11.05% CAGR through 2031, outperforming all other applications. Robotic liquid handlers ensure uniform library prep, a prerequisite for reliable variant calling in oncology and rare-disease panels. Microbiology labs deploy automated pathogen-identification cells that cut turnaround to under three hours, supporting antimicrobial stewardship initiatives. Drug-discovery platforms integrate imaging stages with plate movers for phenotypic screening at scale, while proteomics workflows gain traction as robots couple with high-resolution mass-spectrometers for biomarker discovery.
The laboratory robotics market size tied to genomics workflows will grow in lockstep with falling sequencing costs and rising test volumes. Systems that combine acoustic transfer, environmental controls, and barcode-verified traceability now appear on capital-budget shortlists at national genome centers. Pharmaceutical pipelines lean on these flexible robots to accelerate clinical biomarker validation, reinforcing genomics as the fastest-advancing slice of the laboratory robotics industry.

By End-User:
Contract Research Organizations Accelerate AdoptionPharmaceutical and biotechnology companies accounted for 38.05% of laboratory robotics market revenue in 2025 because R&D spends prioritize validated, closed-loop platforms. Contract research organizations, meanwhile, are on pace for 9.67% CAGR, reflecting sponsor outsourcing trends. CROs invest in cloud-controlled labs where clients trigger robotic protocols remotely, shortening project cycles and freeing internal capacity. Academic institutes pair grants with vendor partnerships to access state-of-the-art automation without full ownership costs. Clinical labs automate to curb staffing shortages, using robots to load analysers overnight and speed patient results.
As trial designs shift toward decentralized and patient-centric formats, CROs embrace mobile robots that can redirect plates among assay stations while documenting custody in real time. The laboratory robotics market benefits because fee-for-service models spread capital expenditure across many sponsors, encouraging continued fleet expansion.
By Robot Type:
Collaborative Mobile Systems Reshape Laboratory WorkflowsLiquid-handling robots retained 54.30% leadership of laboratory robotics market share in 2025, anchored by entrenched microplate and tube workflows. Emerging collaborative mobile platforms, though, promise 13.22% CAGR to 2031. Mounted on autonomous carts, these systems transport plates between incubators, imagers, and freezers, eliminating conveyor belts and fixed rails. Sample-handling gantries remain vital in medium-throughput labs, while fully-integrated total automation cells—complete with de-cappers, centrifuges, and analytics—represent the pinnacle of end-to-end solutions.
The laboratory robotics market size associated with collaborative mobile units will climb as facilities retrofit existing footprints rather than build green-field suites. Energy-saving grippers based on shape-memory alloys lower operating costs by up to 90%, aligning with corporate net-zero pledges. Vendors add proximity sensors and force-limiting joints so robots can work beside technicians without cages, accelerating floor-space optimization projects.

By Workflow Stage:
Pre-Analytical Automation Gains Strategic ImportanceAnalytical and assay execution dominated 46.60% of laboratory robotics market size in 2025, yet pre-analytical sample preparation is growing fastest at 10.25% CAGR. Barcode verification, aliquoting, and centrifugation steps contribute nearly half of all lab errors when performed manually. Robotic benches equipped with vision systems reduce mis-labelling incidents to near zero, boosting diagnostic confidence. Post-analytical data management now mate’s robot QC outputs with laboratory information systems, enabling automatic result release or reflex testing.
Regulators increasingly audit sample-handling chains under the updated ISO standard, prompting labs to extend automation upstream. Vendors respond with modular modules—tube openers, decappers, and sealers—that snap into unified control software. The laboratory robotics industry therefore broadens its scope from high-visibility pipetting islands to holistic, cradle-to-result orchestration.
Geography Analysis
North America Laboratory Robotics Market
North America captured 40.25% of laboratory robotics market share in 2025 due to mature biopharma pipelines and early adoption of FDA-compliant automation. Hospital networks accelerate spending to counter staff attrition, while venture-backed biotech hubs in Boston and San Diego install self-optimizing discovery cells. Federal funding via the NIH’s Advanced Research Projects Agency for Health further underwrites purchase orders for precision-medicine labs.
APAC Laboratory Robotics Market
Asia-Pacific is projected for 8.18% CAGR through 2031, the highest worldwide. China’s Five-Year Plan directs USD 45.2 million into robotics R&D, Japan’s New Robot Strategy adds USD 440 million, and Korea earmarks USD 128 million for intelligent systems, catalysing domestic suppliers. Pharmaceutical manufacturers scale quality-control labs alongside production lines to meet ICH and PIC/S standards, driving pull-through for flexible robots. Academic mega-labs focused on population genetics install acoustic handlers and mobile robots to process large-scale biobank specimens.
EMEA and South America Laboratory Robotics Market
Europe maintains steady momentum supported by Horizon Europe’s USD 183.5 million robotics call. Sustainability statutes nudge laboratories toward energy-efficient robots that reduce compressed-air dependence. German automation firms export modular work cells across the EU, reinforcing intra-regional supply chains. The Middle East and Africa register nascent yet accelerating demand as health-tourism hubs and vaccine-fill-finish plants modernize pathology and QC laboratories. South America benefits from technology-transfer programs paired with local reagent manufacturing, yet broader uptake hinges on credit availability and engineer training pipelines.
Regulatory Landscape
Regulation for laboratory robotics is tightening around patient-safety, software assurance, and traceability, especially where robots touch clinical diagnostics and IVD-adjacent workflows. In the United States, FDA expectations for electronic records and validated automation continue to steer procurement toward systems with audit trails and configurable access controls. The agency issued Computer Software Assurance (CSA) guidance on February 3, 2026 for production and quality system software, which affects how laboratories validate robotics control software, scheduling engines, and connected middleware.
In Europe, MDR/IVDR implementation mechanics remain a key constraint and planning variable for vendors selling robotics-enabled IVD workflows. Commission Implementing Regulation (EU) 2026/977 entered into force on May 24, 2026, setting common operational rules and maximum timelines for conformity assessments by Notified Bodies. On June 17, 2026, the European Commission updated harmonised standards via Decisions (EU) 2026/1231 and (EU) 2026/1313, triggering documentation and presumption-of-conformity reviews for systems marketed into regulated clinical environments. Across regions, laboratory accreditation and safety frameworks, including ISO 15189:2022 and robot safety standards such as ISO 10218-1:2025, continue to push vendors toward packaged validation services and safety-by-design architectures for collaborative workcells and mobile robots.
Value Chain Analysis
The laboratory robotics value chain starts with key components and sub-assemblies (actuators, bearings, motors, sensors, embedded controllers, and safety-rated I/O), then moves to robot OEMs and lab-automation integrators that pair liquid handling, plate logistics, and sample preparation modules with instruments (analyzers, mass spectrometers, and readers) and a software backbone (workflow design, scheduling, device drivers, and data capture). Distribution splits between direct enterprise sales to biopharma, clinical labs, and CROs, and channel-led configurations for standardized benchtop systems, while validation, installation, and service contracts (preventive maintenance, re-qualification, and software updates) form an increasingly important downstream layer for regulated laboratories.
Recent 2026 partnerships point to value being reallocated toward orchestration and compute-linked stacks. Opentrons integrated NVIDIA Isaac and NVIDIA Cosmos across a deployed base of more than 10,000 robotic systems (announced February 2026). Tecan announced a collaboration with NVIDIA (March 2026) to embed GPU-accelerated models into lab instrumentation, further reinforcing the software and orchestration layer as a differentiator. At the same time, supply-side risk is moving upstream, with 2026 bottlenecks linked to availability and qualification of mechanical components and custom parts. Vendors and large labs are responding with resilience tactics such as dual sourcing, safety stock for critical components, and structured supplier qualification, alongside multimodal logistics planning for time-sensitive consumables and spares.
Competitive Landscape
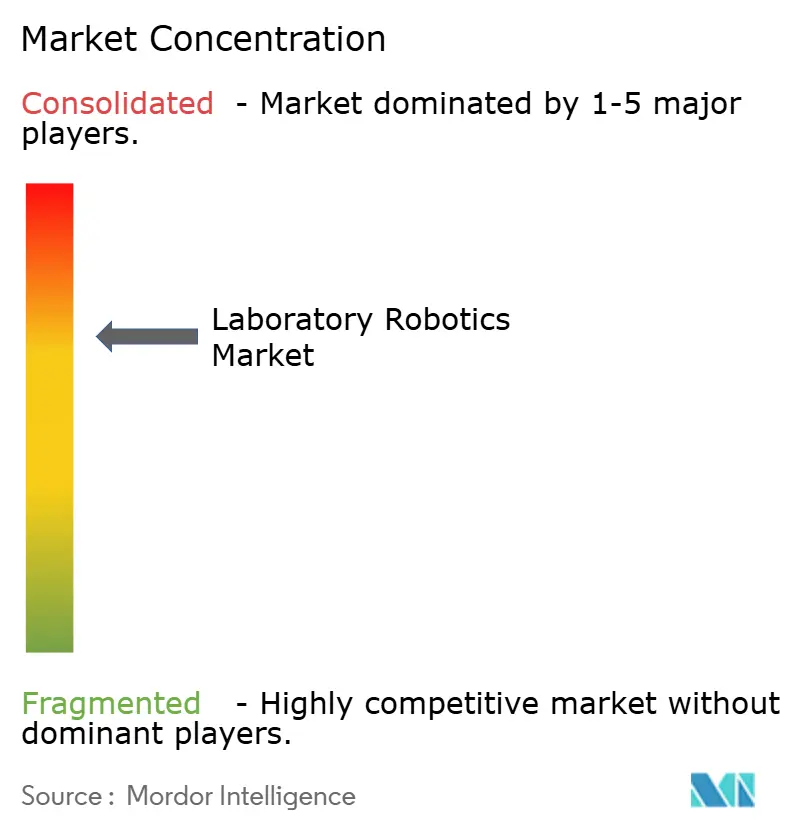
The laboratory robotics market shows moderate concentration, with a core of vendors integrating hardware, software, and validation services. Thermo Fisher, Beckman Coulter Life Sciences, and Hamilton Company bundle platforms with reagent kits, creating lock-in through workflow-specific chemistries. ABB and Agilent collaborate to marry articulated arms with chromatography instruments, offering one-throat-to-choke support. Proprietary scheduling engines that adjust tasks on the fly add further differentiation.
New entrants emphasize niche strengths. Acoustic-only transfer specialists target genomics, while cloud-native orchestration firms sell subscription-based control layers compatible with multiple robot brands. Large pharmaceutical companies such as Daiichi Sankyo now develop smart labs in-house, pressuring suppliers to open APIs for seamless integration. Energy-efficiency modules that place idle robots into standby reduce power by up to 30%, aligning with ESG scorecards and becoming a deciding factor during request-for-proposal cycles.
Intellectual-property filings in force-sensing grippers and contamination-free liquid-transfer channels keep barriers to entry high. Nonetheless, open-source micro-robots attract academic users that later scale to commercial deployments, broadening the addressable base. Service contracts—predictive maintenance, software updates, and GMP re-qualification—represent growing annuity streams, reinforcing competitive moats for incumbents that can staff global support teams. [4]
Laboratory Robotics Industry Leaders
-
Thermo Fisher Scientific Inc.
-
Hamilton Company
-
Tecan Group Ltd.
-
PerkinElmer Inc.
-
Beckman Coulter Life Sciences
- *Disclaimer: Major Players sorted in no particular order
Laboratory Robotics Market Companies Covered in this Report
- Thermo Fisher Scientific Inc.
- Hamilton Company
- Tecan Group Ltd.
- PerkinElmer Inc.
- Beckman Coulter Life Sciences
- Siemens Healthineers AG
- Anton Paar GmbH
- Agilent Technologies Inc.
- Hudson Robotics Inc.
- Peak Analysis and Automation Ltd.
- Qiagen N.V.
- Abbott Laboratories
- Danaher Corporation (Molecular Devices)
- Biosero Inc.
- Roche Diagnostics
Market Opportunities and Future Outlook
A key whitespace sits at the intersection of regulated workflows and AI-enabled automation. Laboratories want higher autonomy without losing auditability, data integrity, and validation discipline. FDA attention on software assurance, reinforced by CSA guidance issued February 3, 2026, increases the value of vendors that can package robotics, orchestration software, and validation documentation into a single compliance-ready offering, especially for ISO 15189:2022-aligned clinical environments where pre-analytical chain-of-custody and error reduction face tighter scrutiny.
A second opportunity is the shift from deterministic scripts toward data-driven, adaptive orchestration that can coordinate mixed fleets of devices and robots. Recent activity supports this direction: Opentrons integrated NVIDIA Isaac and NVIDIA Cosmos across its installed fleet (February 2026), and Tecan announced a collaboration with NVIDIA to build data-driven labs (March 2026), indicating demand for GPU-accelerated perception, scheduling optimization, and closed-loop execution. Larger-scale autonomous experimentation has also become more visible in drug discovery settings, including facilities such as Recursion operating at multi-million experiments-per-week throughput, which raises the importance of reliable plate logistics, imaging integration, and data pipelines. Together, these dynamics create room for vendor-agnostic control layers, standardized integration patterns with LIMS/ELN, and services that harden cyber-security and interoperability for networked lab robots while reducing deployment friction for CROs and mid-sized laboratories with limited in-house robotics engineering depth.
Recent Industry Developments in Laboratory Robotics Market
- July 2026: Roche and ABB Robotics announced a global partnership to develop industrial robotic solutions for clinical laboratories, focusing on sample handling and connectivity. The collaboration links ABB robotics capabilities with Roche laboratory workflows, strengthening end-to-end automation for high-throughput environments. It also raises the bar for integration between robotics, instruments, and informatics, a recurring procurement requirement for large clinical networks.
- May 2026: Hamilton Company announced a strategic combination with Cerillo to integrate compact microplate readers with Hamilton liquid handling systems. The move tightens the workflow loop between liquid handling and detection, reducing integration work for labs building modular assay cells. It also supports vendors competing on complete workcells rather than standalone pipetting platforms.
- January 2026: Beckman Coulter Life Sciences partnered with Automata to integrate Beckman liquid handling with the Automata LINQ automation platform positioned for AI-ready orchestration. This expands interoperability options for laboratories combining multiple instruments and robotics modules under one scheduling and control layer. The partnership underscores the shift in differentiation toward orchestration software and scalable integration across heterogeneous lab footprints.
Laboratory Robotics Market Report Scope and Research Methodology
Market Definition and Coverage
For this study, the laboratory robotics market covers robotic systems and robot-enabled automation used to move, prepare, process, and analyze samples inside laboratory workflows, and the related control software that lets these systems operate as a repeatable process.
Scope exclusions: We exclude general-purpose industrial robots that are not deployed for laboratory workflows, along with non-robotic lab consumables and standalone analyzers that do not automate handling steps.
Segments Covered in This Report
- By Application
- Drug Discovery
- Clinical Diagnostics
- Microbiology Solutions
- Genomics Solutions
- Proteomics Solutions
- By End-user
- Clinical Laboratories
- Research and Academic Labs
- Pharmaceutical and Biotechnology Companies
- Contract Research Organizations
- By Robot Type
- Liquid-Handling Robots
- Sample-Handling / Plate Movers
- Collaborative Mobile Lab Robots
- Fully-Integrated Total Lab Automation Cells
- By Workflow Stage
- Pre-analytical Sample Preparation
- Analytical / Assay Execution
- Post-analytical Data Management
- By Geography
- North America
- United States
- Canada
- Mexico
- South America
- Brazil
- Argentina
- Rest of South America
- Europe
- Germany
- United Kingdom
- France
- Italy
- Spain
- Rest of Europe
- Asia-Pacific
- India
- China
- Japan
- Rest of Asia-Pacific
- Middle East and Africa
- South Africa
- Saudi Arabia
- Bahrain
- United Arab Emirates
- Egypt
- Rest of Middle East and Africa
- North America
Data Sources, Market Sizing, and Validation
Desk Research
Desk work was used to set the boundaries of what counts as laboratory robotics, and to build the first set of demand and supply signals before we spoke with the market. Public sources helped us understand lab testing volumes, life science R&D intensity, and adoption barriers that shape buying cycles.
Sources included items such as US FDA and NIH publications for life science activity markers, CDC reporting for testing and surveillance context, OECD health and R&D statistics for cross-country comparisons, and UN Comtrade for trade patterns in relevant automation equipment categories. We also reviewed company annual reports, investor presentations, and patent databases for robotics and lab automation filings, plus association and journal articles that describe lab throughput and automation practices. Where helpful, we used a paid subscription database for company financials, news, and patent intelligence to verify revenue exposure and track product launches. These examples are not exhaustive, and many other public sources were also referenced for data collection, validation, and clarification.
Primary Interviews and Surveys
Primary work was done through expert interviews and structured surveys with lab automation buyers, robotics integrators, distributors, and product specialists who see pricing, procurement timing, and real deployment constraints. Coverage was kept global, with inputs taken across mature and emerging lab markets so assumptions like utilization, replacement timing, and workflow fit could be checked and adjusted before finalizing the model.
Distribution of primary research fieldwork respondents
| Company type | Respondent position | Region |
|---|---|---|
| Top tier: 31% | CXOs: 15% | APAC: 41% |
| Mid tier: 48% | Functional/Unit leaders: 41% | EMEA: 33% |
| Smaller Players: 21% | Managers: 44% | Americas: 26% |
Market-Sizing & Forecasting
Sizing started with a top-down build that reconstructs the addressable demand pool using laboratory automation adoption by workflow stage, mapped to end-user lab counts and activity intensity, which is then converted into annual spending. To avoid relying on one angle, the totals were corroborated with selective bottom-up approximations, such as sampling typical system pricing and volumes across common robot types and cross-checking distributor and integrator channel signals.
Key inputs used in the model included indicators like lab testing throughput trends, life science and pharma R&D spending direction, automation penetration in pre-analytical and analytical steps, average system selling prices by robot type, and replacement or upgrade cycles tied to reliability and compliance needs. When data coverage was thin for a country or niche workflow, we filled gaps using proxy ratios from comparable markets, and then adjusted those ratios after expert review so they matched realistic buying behavior.
For forecasting, scenario analysis was applied around the most sensitive variables, mainly adoption speed in clinical and research labs, pricing progression as systems move from custom setups to more standardized platforms, and regional investment momentum. Assumptions were kept measurable and were revised when primary respondents pointed to changes in funding, regulation, or lab capacity expansion plans.
Data Validation & Update Cycle
Outputs were checked against independent signals, including trade movement for automation equipment, public funding direction in life sciences, and reported lab automation adoption patterns in major regions. Large variances were flagged, and then the drivers were re-checked through a second pass of assumptions, followed by an internal analyst review before sign-off.
The model is refreshed on an annual schedule, and it is also revisited when material events occur, such as major regulatory shifts, large lab build-outs, or meaningful product changes that alter pricing and adoption. Before a client deliverable is finalized, we do a last validation pass so the market view reflects the most recent information available.
Mordor Intelligence's Laboratory Robotics Market Size Compared Against Other Published Estimates
Published market sizes for laboratory robotics can vary because research teams do not always count the same workflows, the same robot types, or the same end-users in their totals. Differences also come from how pricing is treated over time, and whether a study uses a single broad growth rate or ties the forecast to real demand indicators.
By tracking workflow-stage adoption and refreshing ASP bands with regional channel checks, Mordor Intelligence keeps the total tied to what labs actually automate today, rather than expanding the scope into adjacent lab automation equipment that is not robot-led.
Benchmark comparison
| Source | Market Size | Gaps in Research Methodology |
|---|---|---|
| Mordor Intelligence | USD 2.64 B (2026) | |
| Global Consultancy A | USD 2.73 B (2025) | Uses an earlier base year and a longer forecast window, and the scope appears to mix broader lab automation elements with robotics in some end-use views, which can lift the current-year total versus a robotics-only boundary. |
| Industry Publisher B | USD 2.35 B (2023) | Starts from an older baseline year and may apply generalized growth assumptions across product types, which can understate the current size if recent adoption in high-throughput and clinical workflows is not fully reflected. |
Across the three estimates, the spread is mainly explained by base-year choice and what gets counted as robotics versus wider automation. When the scope is kept consistent and the pricing and adoption assumptions are checked against field inputs, the resulting market size becomes easier to trace, reproduce, and update year to year.
Key Questions Answered in the Report
What is the current size of the laboratory robotics market?
The laboratory robotics market stands at USD 2.64 billion in 2026 and is projected to grow to USD 3.5 billion by 2031.
Which application area is expanding fastest?
Genomics solutions lead growth with an expected 11.05% CAGR as automated next-generation sequencing workflows scale in precision-medicine programs.
Why are contract research organizations investing heavily in laboratory robotics?
CROs adopt flexible, cloud-controlled robotic platforms to meet outsourced assay demand, driving a 9.67% CAGR through 2031.
What robot type is seeing the highest growth rate?
Collaborative mobile lab robots are forecast to rise at 13.22% CAGR because they retrofit existing labs and support modular workflows.
How will new ISO-15189 requirements influence market spending?
Compliance adds validation and infrastructure costs that temporarily slow adoption, particularly for smaller labs, yet ultimately favours vendors with turnkey, standards-ready systems.
Which region will contribute most to future market expansion?
Asia-Pacific will post the fastest 8.18% CAGR as government robotics grants and pharmaceutical capacity growth spur widespread automation uptake.