
Laboratory Mixer Market Size and Share
Market Overview
| Study Period | 2020 - 2031 |
|---|---|
| Market Size (2026) | USD 2.31 Billion |
| Market Size (2031) | USD 2.76 Billion |
| Growth Rate (2026 - 2031) | 3.62 % |
| Fastest Growing Market | Asia Pacific |
| Largest Market | North America |
| Market Concentration | Medium |
Major Players *Disclaimer: Major Players sorted in no particular order Image © Mordor Intelligence. Reuse requires attribution under CC BY 4.0. | |
Laboratory Mixer Market Analysis by Mordor Intelligence
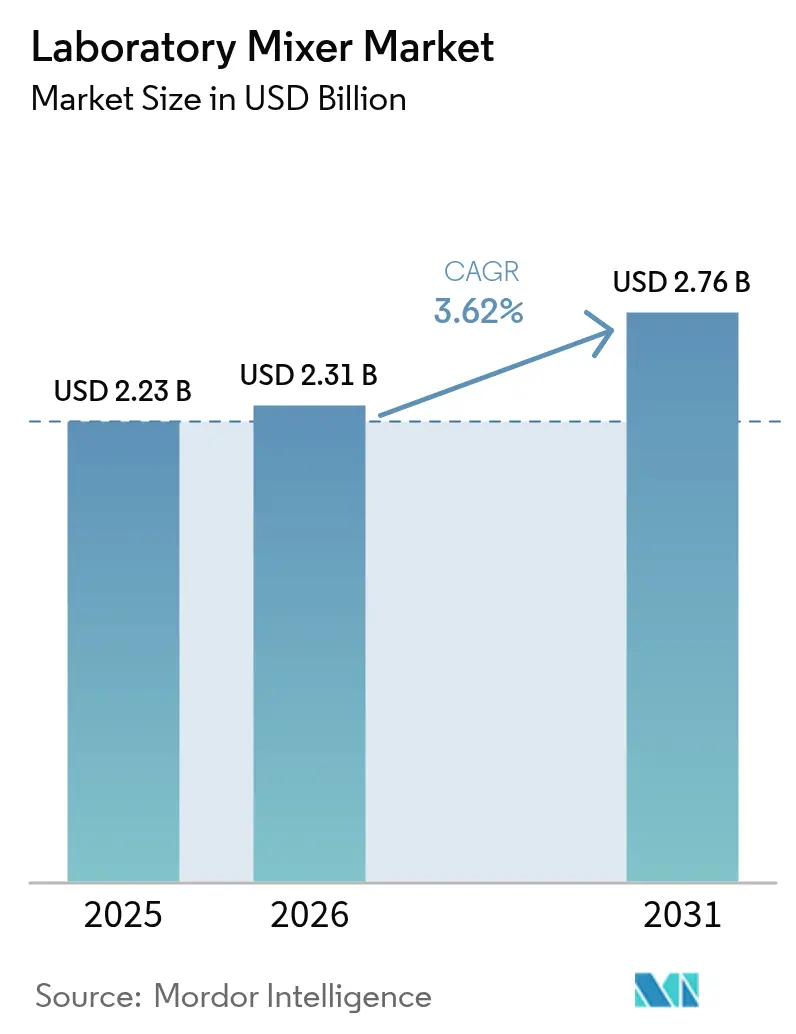
The laboratory mixer market size is expected to grow from USD 2.23 billion in 2025 to USD 2.31 billion in 2026 and is forecast to reach USD 2.76 billion by 2031 at 3.62% CAGR over 2026-2031. Continued demand from pharmaceutical, biotechnology and clinical diagnostic laboratories sustains equipment purchases, with precision mixing now integral to drug discovery, cell therapy process development and high-throughput diagnostic workflows. Investments in R&D remain resilient—global pharma R&D outlays climbed to almost USD 288 billion in 2024—so buyers continue to modernize laboratory infrastructure and favor digital or automated systems that improve reproducibility and reduce human error. The laboratory mixer market also benefits from CRO and CDMO capacity additions; outsourced development partners require scalable mixing solutions that support parallel client projects. Regionally, North America retains leadership yet Asia-Pacific posts the fastest growth as local governments channel funds into life-sciences clusters and clinical trial activity escalates. Sustainability considerations are beginning to influence procurement as laboratories shift toward energy-efficient, oil-free and reusable-component designs that lower utility bills and waste streams.
Key Report Takeaways
- By product type, shakers captured 38.02% of the laboratory mixer market share in 2025; magnetic stirrers are projected to grow at a 4.72% CAGR through 2031.
- By mixing technology, digital and programmable systems accounted for 56.10% share of the laboratory mixer market size in 2025, while automated robotic integrated systems are set to expand at a 5.18% CAGR.
- By capacity range, the 1–5 L segment commanded 43.05% share of the laboratory mixer market size in 2025; units above 5 L represent the fastest-growing capacity band at a 4.33% CAGR.
- By end user, clinical and diagnostic laboratories held 40.70% revenue in 2025, whereas pharmaceutical and biotechnology companies exhibit the highest forecast CAGR at 4.61% to 2031.
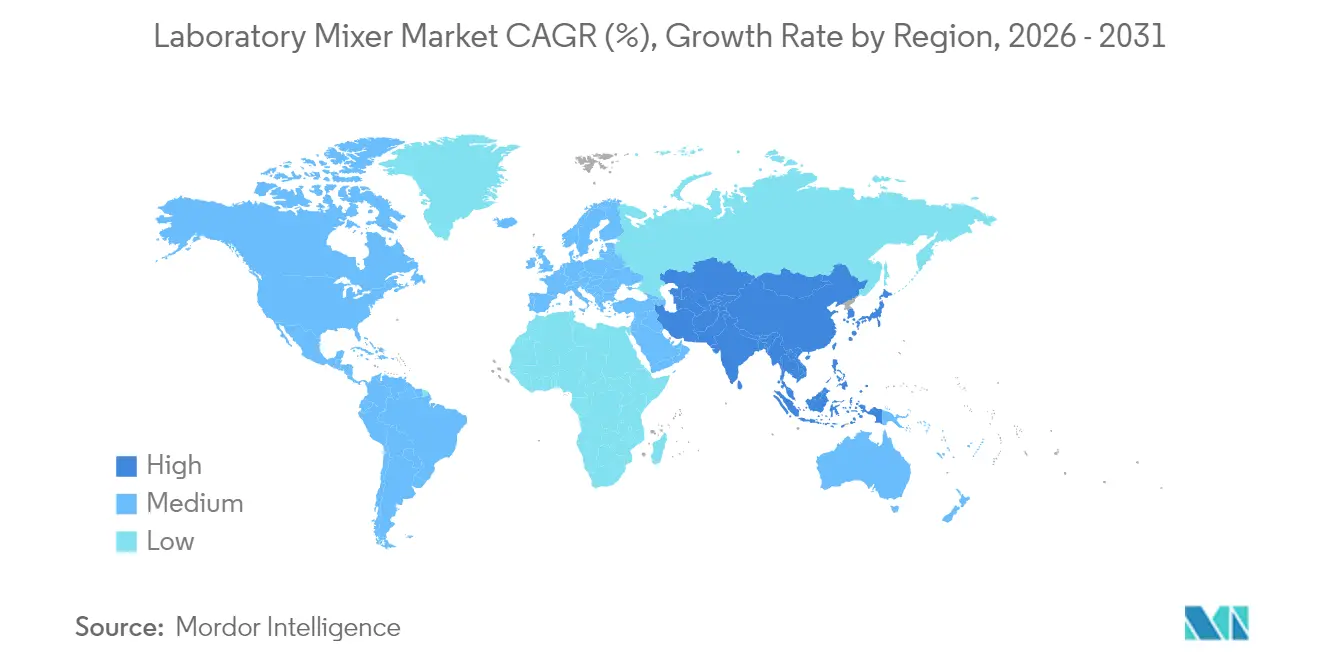
- By geography, North America led with 41.85% revenue share in 2025; Asia-Pacific is projected to grow at a 4.98% CAGR, the quickest pace among all regions.
Note: Market size and forecast figures in this report are generated using Mordor Intelligence’s proprietary estimation framework, updated with the latest available data and insights as of 2026.
Market Trends and Insights
Drivers Impact Analysis of Laboratory Mixer Market*
| Driver | ( ~ ) % Impact on CAGR Forecast | Geographic Relevance | Impact Timeline |
|---|---|---|---|
| Increased pharma-biotech R&D expenditure | +1.2% | North America & Europe, global spill-over | Medium term (2-4 years) |
| Rapid technological advancements in mixer design | +0.8% | North America & Asia-Pacific | Long term (≥ 4 years) |
| Growth of CRO/CDMO outsourcing | +0.9% | Strong in Asia-Pacific, worldwide adoption | Medium term (2-4 years) |
| Rising clinical diagnostics workload | +0.7% | Global, faster in emerging markets | Short term (≤ 2 years) |
| Gentle-mixing demand from cell & gene therapy | +0.4% | North America & Europe, spreading to Asia-Pacific | Long term (≥ 4 years) |
| Sustainability-driven procurement | +0.3% | Europe & North America, moving global | Medium term (2-4 years) |
| Source: Mordor Intelligence | |||
Increased Pharma-Biotech R&D Expenditure
Global pharmaceutical companies held firm on innovation budgets even during economic turbulence; Merck allocated USD 17.9 billion and Johnson & Johnson USD 17.2 billion to R&D in 2024. Surveyed executives plan 4% higher overall R&D outlays for 2025, with laboratory instrument lines expected to tick up 4-6%. Biologics, antibody-drug conjugates and mRNA platforms require gentle, contamination-free agitation in discovery and scale-up, pushing laboratories to adopt programmable shakers and low-shear magnetic stirrers. Production investments reinforce the link; new pilot plants often mirror manufacturing conditions, so every expansion indirectly raises demand for compliant mixers that document temperature, speed and torque. As pipelines tilt further toward cell-based therapeutics, the laboratory mixer market gains structural support from long-cycle R&D programs that need robust, validated equipment. Vendors that align product roadmaps with GMP and data-integrity requirements stand to capture sustained replacement revenues.
Rapid Technological Advancements in Mixer Design
Suppliers continue to embed sensors, connectivity and automation in 2025 product launches. Asynt’s DrySyn Vortex offers simultaneous temperature-controlled overhead stirring up to 150 °C without an oil bath, reducing mess and energy use. The University of Warwick’s Smart Stirrer integrates Bluetooth monitoring so chemists adjust speed from outside fume hoods, improving safety. ABB Robotics’ alliances with Agilent and Mettler-Toledo marry benchtop instruments to collaborative robots that swap flasks and initiate runs autonomously.[1]ABB Ltd., “ABB and Agilent Unite to Automate the Lab,” abb.com Research at UNC-Chapel Hill charts a five-level path from “assistive” to “full” automation, guiding labs toward fleet purchases of integrated mixer-robot cells. Energy-efficiency gains also matter; Miele demonstrated 25% lower power draw on its new circulation pump versus the prior generation. Collectively, these advances shorten experiment cycles, boost reproducibility and keep the laboratory mixer market on a steady innovation cadence.
Growth of CRO/CDMO Outsourcing
The CRO/CDMO sphere recorded record plant announcements: Samsung Biologics is spending USD 1.46 billion to expand Songdo capacity, Fujifilm Diosynth earmarked USD 1.6 billion for Denmark, and Lonza bought a California biologics site for USD 1.2 billion. Such greenfield or brownfield projects order pilot-scale mixers for process development, QC labs and small-batch clinical production. Revenue tables show IQVIA at USD 14.984 billion and Thermo Fisher’s PPD unit at USD 13.292 billion in 2023, signaling buyer depth for standardized equipment that can move from one client molecule to the next without revalidation. China’s domestic CRO revenue hit CNY 64.77 billion in 2021, 13.2% of the global pie and rising, creating further geographic pull for the laboratory mixer market. Automated systems that store recipes and issue audit trails fit CDMO quality systems, positioning vendors that offer GMP-ready software as preferred partners.
Sustainability-Driven Procurement
European procurement guidelines increasingly weigh energy and water consumption when awarding tenders; institutions can gain Green Public Procurement credits by choosing oil-free drives or heat-recovery chillers. Miele’s 25% lower energy and 4% water savings persuaded several German hospitals to replace legacy shakers in 2024.[2]Miele Professional, “Energy Efficient Lab Equipment Fact Sheet 2024,” miele.com Universities in the United Kingdom published open-source LCA models showing that switching from single-use plastic to glass beakers plus stainless-steel stir bars cuts carbon footprints by 105.92 kg CO₂e per researcher per decade. As carbon-audit requirements expand to the United States and Japan, laboratories recast total-cost-of-ownership models to favor long-life, rebuildable mixers. Vendors offering energy calculators and take-back services gain tender advantages, accelerating sustainable upgrades across the laboratory mixer market.
Restraints Impact Analysis of Laboratory Mixer Market*
| Restraint | ( ~ ) % Impact on CAGR Forecast | Geographic Relevance | Impact Timeline |
|---|---|---|---|
| High upfront cost & long replacement cycles | -0.6% | Emerging markets most sensitive | Short term (≤ 2 years) |
| Long service life delaying repeat purchases | -0.5% | Mature markets | Medium term (2-4 years) |
| Scrutiny of plastic contamination | -0.4% | North America & Europe, expanding outward | Medium term (2-4 years) |
| Rare-earth magnet price volatility | -0.3% | Global supply chain centered in Asia | Short term (≤ 2 years) |
| Source: Mordor Intelligence | |||
High Upfront Cost and Long Replacement Cycles
Inflation pushed price tags up sharply in 2024; one UK lab reported a dry-bath incubator quote that doubled within six months, forcing re-budgeting. Researchers increasingly pool grants or scour certified pre-owned marketplaces such as EquipNet, where refurbished GC-MS units list for USD 14,000-85,000.[3]Pharmaceutical Technology, “Certified Pre-Owned Laboratory Equipment Trend,” pharmaceutical-technology.com Despite sticker shock, mixers often last 10-15 years, so procurement officers delay replacements until critical failures occur, dampening near-term sales. Academic and government labs feel the squeeze most acutely because fiscal-year allocations reset slowly. Tariffs on electronics and metals further complicate forecasts; sudden duties on Chinese motors raised landed costs in 2025 bids, prompting some buyers to postpone orders. While vendors extend leasing and service-inclusion offers, budget-limited institutions remain cautious, limiting a portion of the laboratory mixer market’s upside.
Scrutiny of Plastic Contamination Favoring Alternative Methods
Studies found some polypropylene microcentrifuge tubes leach compounds that mimic lipids and confound mass-spectrometry assays. Short-chain PFAS adhere more to plastic than borosilicate glass, influencing vessel selection in environmental analysis labs. The TidyTron initiative validates wash-and-reuse protocols that could reduce 5.5 million tons of biotech plastic waste annually, challenging single-use consumables tied to certain mixers. Researchers designing phthalate-free labs show contamination drops by two orders of magnitude when stainless steel dominates bench surfaces. Rising awareness persuades some labs to revert to glass vessels stirred by overhead paddles rather than disposable microplates agitated on orbital shakers, slightly tempering consumable-linked revenue in the laboratory mixer market.
*Our forecasts treat driver/restraint impacts as directional, not additive. The impact forecasts reflect baseline growth, mix effects, and variable interactions.
Laboratory Mixer Market Segment Analysis
By Product Type:
Shakers Maintain Dominance While Magnetic Stirrers AccelerateShakers generated 38.02% revenue in 2025 and retain the broadest application base across cell culture, plasmid extraction and ELISA plate agitation. Wide platforms enable concurrent processing of dozens of vessels, which fits screening protocols in pharma discovery. Recent launches add programmable ramp rates and CO₂-resistant motors for incubated shakers, ensuring viability for mammalian cells. Magnetic stirrers, though smaller in absolute sales, are slated for a 4.72% CAGR through 2031 as smart sensors and induction heating broaden their use in medicinal chemistry and green solvents work. Vendors pair magnetic drives with PTFE-coated bars that withstand aggressive reagents, lowering contamination risk. Vortex mixers keep niche relevance for rapid resuspension of pellets in PCR workflows; typical labs still allocate at least one vortex per bench, securing steady if unspectacular demand. Homogenizers, ultrasonicators and high-shear overhead stirrers anchor specialty needs—liposome dispersion, nanoparticle emulsification—often bundled into process-development suites at CDMOs. Accessories remain a recurring revenue pillar; silicone platforms, sealing mats and disposable paddles require periodic replacement, ensuring aftermarket stability within the laboratory mixer market.
Smart-equipment telemetry advances product differentiation. Manufacturers embed torque feedback and temperature probes that feed live data to LIMS dashboards, meeting FDA data-integrity criteria. Firmware pushes via Ethernet reduce service calls and extend uptime, a feature applauded by budget-strapped academic cores. Sustainability adds another dimension; oil-free direct drives slash maintenance and energy draw, aligning with institutional decarbonization pledges. Consequently, the laboratory mixer market sees rising bid specifications that score vendors on both performance and environmental metrics. Shakers will likely hold the lion’s share, yet magnetic stirrer innovation—compact, silent, IoT-ready—positions the segment for above-market growth.


By Capacity Range:
Mid-Range Units Anchor Demand, Large-Volume Mixers Gain Ground1-5 L models represented 43.05% of 2025 shipments owing to their compatibility with standard glassware and moderate bench footprints. Academic groups rely on this range for day-to-day synthesis and protein purification, while CROs use it for method development. Vendors bundle quick-change clamps that secure Erlenmeyer flasks, media bottles or single-use bags, maximizing flexibility. Sub-1 L micro-reactor mixers support fragment-based drug discovery and HTS; automation arms can load 200 mL flasks in rapid succession, although overall revenue remains smaller. Units above 5 L are tracking a 4.33% CAGR as gene-therapy developers scale suspension cell cultures and CDMOs build pilot plants linking lab results to 2,000 L bioreactors. Thermo Fisher’s Rotea and Sartorius’ Ambr systems straddle lab and production, giving process scientists precise control plus transferability to GMP suites. Stainless-steel overhead stirrers compete with single-use bag shakers where cleaning validation time outweighs consumable cost. As customers pursue continuous manufacturing, demand for 10-50 L feed vessels with real-time analytics could rise, expanding the laboratory mixer market size for higher-volume platforms.
In parallel, capacity hybridization emerges: modular skids hold 5 L glass reactors for early development beside 20 L single-use mixers for tox-batch production, sharing common drives and control panels, reducing training burden. Such configurability attracts CDMOs juggling multiple client scales. Sustainability again plays: large vessels with magnetically levitated impellers consume less power at equivalent tip speed, a spec now cited in European grants. Overall, mid-range products should preserve core volume, but the high-capacity slot offers the fastest incremental dollars.
By Mixing Technology:
Digital Platforms Lead as Robotics Gains TractionDigital and programmable units controlled 56.10% of 2025 sales, reflecting buyer preference for recipe storage, real-time display and password-protected access logs. These mixers integrate seamlessly with ELN and MES software, simplifying GMP documentation. Scientists preload RPM, temperature and time segments, cutting manual touchpoints and ensuring lot-to-lot consistency. Analog dials still populate teaching labs where budgets trump feature sets, but their share continues to slip as price gaps narrow. The automated robotic category, forecast at a 5.18% CAGR, leverages cobots that swap flasks under HEPA hoods, ideal for high-throughput screening or 24/7 synthesis. ABB-Agilent demo cells can complete a 96-condition solvent optimization overnight without human presence. As UNC-Chapel Hill’s automation maturity model circulates, procurement committees set roadmaps that migrate from assistive to autonomous operations by decade’s end, underpinning sustained investment.
Edge analytics further differentiates offerings: AI modules flag cavitation, viscosity changes or bearing wear before failure, trimming downtime. Vendors market cloud dashboards that benchmark fleet utilization across global sites, helping multinationals right-size inventories—a service resonating in the laboratory mixer industry. Cyber-security, once overlooked, becomes design-in; Ethernet/IP mixers now ship with secure-boot firmware and encrypted protocols, easing IT approvals. Collectively, these trends confirm digital’s hold while carving space for robotics-enabled gains.

By End User:
Diagnostics Lead, Pharma-Biotech AccelerateClinical laboratories generated 40.70% of 2025 revenue as rising cardiometabolic, infectious and genetic test volumes accelerated sample-prep automation. Orbital shakers married to ELISA washers ensure consistent antigen binding, while vortexers expedite tube mixing in hematology analyzers. Staffing shortages make reliability critical; downtime penalties in hospital labs push buyers toward service-inclusive contracts. The laboratory mixer market earns steady recurring revenues from this risk-averse customer set. Pharmaceutical and biotechnology companies, however, register the fastest CAGR at 4.61% to 2031, propelled by record pipeline counts and capital expansion. Merck and Johnson & Johnson’s combined USD 35 billion 2024 R&D spend underscores enduring appetite for advanced mixers that handle shear-sensitive biologics. CDMOs amplify pull-through; Samsung Biologics’ new suites require mirrored lab and QC gear, effectively doubling orders relative to traditional single-tenant plants.
Academic institutes remain price-conscious yet influential in setting technology trends; early adoption of IoT mixers for open-lab data sharing often seeds future corporate standards. Environmental testing, food safety and materials science round out the “Others” bracket; while smaller, they adopt specialty ultrasonicators or high-shear devices for nanomaterial dispersion, contributing niche growth. Across segments, procurement increasingly integrates cross-functional teams—scientists, facilities, sustainability officers—so vendors that articulate performance, compliance and environmental value together gain share in the laboratory mixer market.
Geography Analysis
North America Laboratory Mixer Market
North America accounted for 41.85% of 2025 revenue, anchored by the United States’ dense pharmaceutical pipeline and diagnostic testing infrastructure. FDA expectations around data integrity propel purchases of digital mixers that maintain audit trails. Major suppliers such as Thermo Fisher budget USD 2 billion between 2024-2027 to upgrade U.S. production and R&D sites, guaranteeing local demand for compatible laboratory mixers. Canada’s biologics clusters around Toronto and Montréal add incremental sales, while Mexico’s contract-manufacturing parks incorporate mixers in QC labs serving export lines. Robust venture-capital funding for cell-therapy startups further underwrites replacement cycles, keeping the laboratory mixer market resilient.
APAC Laboratory Mixer Market
Asia-Pacific is the fastest-growing territory at a projected 4.98% CAGR, buoyed by government incentives and outsourcing waves. China’s CRO segment scaled to CNY 64.77 billion by 2021 and continues climbing, driving bulk orders for standardized mixers that meet multinational audit criteria. South Korea’s Samsung Biologics and Lotte Biologics collectively pledged more than USD 4.8 billion for new campuses, each housing development and QC labs that mirror GMP lines. India’s vaccine and biosimilar expansions in Hyderabad and Pune require gentle-mixing technologies for suspension cultures, while Australia’s regenerative-medicine hubs in Melbourne adopt low-shear overhead stirrers for stem-cell protocols. Regional buyers often bundle service contracts to mitigate skill gaps, favoring multinational vendors with local engineering teams, which stimulates competitive activity across the laboratory mixer market.
EMEA and South America Laboratory Mixer Market
Europe posts steady, sustainability-driven growth. Institutions leverage EU Green Procurement rules to favor energy-efficient equipment; Germany’s Max-Planck Society replaced legacy shakers with oil-free drives citing 25% power savings. The United Kingdom’s post-Brexit regulatory environment maintains EMA alignment for lab devices, smoothing imports. France incentivizes on-shore biologics production, spurring demand for GMP-grade mixers. Eastern European CROs in Poland and Czechia win oncology trials, opening a fresh channel for mid-capacity digital mixers. Meanwhile, Middle East & Africa and South America present emerging opportunities: Saudi Arabia’s National Biotech Strategy earmarks funds for diagnostic lab build-outs, and Brazil’s ANVISA accelerates review timelines, prompting local pharma plants to add modern QC suites. Although smaller today, these regions heighten the laboratory mixer market’s long-term addressable base.

Regulatory Landscape
Laboratory mixers are largely regulated as general laboratory equipment, but requirements tighten when they are supplied as part of regulated medical device or IVD workflows (for example, sample preparation systems with validated mixing steps and software audit trails). In the United States, manufacturers supplying mixers into regulated lab environments align quality systems with FDA medical device expectations. The FDA Quality Management System Regulation (QMSR) became effective on February 2, 2026, accelerating harmonization with ISO 13485:2016 practices for design controls, supplier controls, and documentation. This compliance emphasis supports demand for programmable mixers that can support qualification and data-integrity expectations in GMP and clinical settings.
In Europe, equipment that supports medical and IVD device workflows operates alongside the EU MDR (Regulation (EU) 2017/745) and IVDR (Regulation (EU) 2017/746) framework, with ongoing transitional provisions and dated compliance milestones around May 26, 2026 for certain conformity assessment-related deadlines. In parallel, safety and laboratory practice standards remain procurement anchors, including IEC 61010-2-051 for mechanical mixing and stirring equipment and ISO 15190 for safe practices in medical laboratories. These standards influence product design, testing, and documentation demanded by institutional buyers.
Value Chain Analysis
The value chain runs from component suppliers (motors, drives, magnets, bearings, and increasingly digital control electronics such as sensors and connectivity modules) to mixer OEMs that integrate mechanical platforms with firmware and user interfaces. Downstream channels include direct sales to large pharma, biotech, and diagnostic networks, along with specialized laboratory equipment distributors plus leasing or refurbished-equipment intermediaries. For regulated end users, documented equipment qualification (IQ/OQ/PQ) and traceable calibration are common requirements, which pulls service organizations, validation partners, and software support into the chain alongside the physical instrument sale.
Key bottlenecks concentrate around advanced electronics and sensor supply, where reliance on a limited supplier base can constrain production schedules for digital and programmable systems. On the demand side, growth in single-use and contamination-controlled bioprocessing workflows adds complementary suppliers for sterile fluid-contact assemblies and compatible mixing platforms, illustrated by offerings such as Sartorius Flexsafe Pro Mixer. OEMs and distributors also differentiate through service reach, spare-parts availability, and compliance documentation tailored to GMP and clinical laboratory procurement.
Competitive Landscape
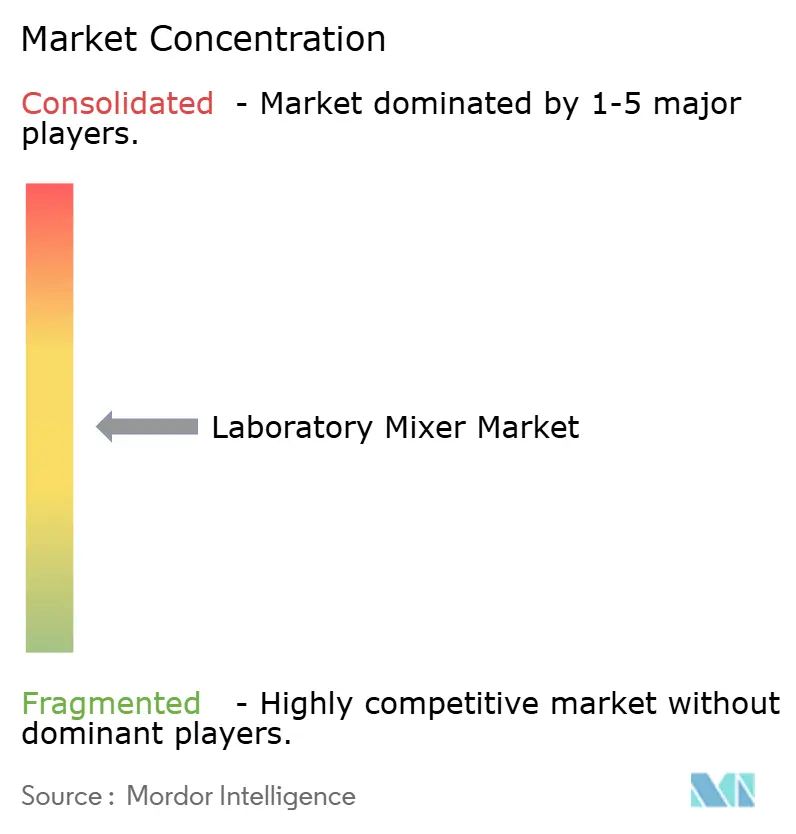
The laboratory mixer market is moderately fragmented; the top five suppliers together control roughly half of global sales, while numerous regional firms service niche applications. Thermo Fisher Scientific, Eppendorf and IKA-Werke lead through broad portfolios that span entry-level magnetic stirrers to fully robotic systems. Thermo Fisher’s USD 4.1 billion acquisition of Solventum’s purification business in 2025 underscores its strategy of bolting on adjacent technologies that enrich integrated bioprocess solutions. Eppendorf invests in smart-capable cloud dashboards that let facility managers track RPM logs across multiple labs, differentiating on data services. IKA-Werke launched an energy-optimized rocker series rewarded by German Blue-Angel certification, appealing to sustainability-focused buyers.
Strategic partnerships proliferate: ABB Robotics links its GoFa cobot with Agilent’s LC-MS platforms so a single arm can pipette, vortex and inject samples, reducing night-shift labor. Beckman Coulter’s Biomek Echo One couples acoustic dispensing with orbital shaking to cut NGS library prep from six hours to 45 minutes. Sartorius integrates Ambr bioreactors with gentle impeller mixers for cell-therapy micro-batch runs, capturing a fast-growth corner of the laboratory mixer industry. Mid-tier players such as Heidolph and Grant Instruments carve space with application-specific models—e.g., titration-ready overhead stirrers or compact dry-block vortexers—targeting university or food-safety labs intolerant of large footprints.
Competitive factors center on reliability, validation software, service reach and sustainability metrics. Vendors tout predictive-maintenance algorithms that slash unscheduled downtime by 30% and extend mean-time-between-service, an edge for high-volume clinical labs. Regional upstarts in China and India offer cost-effective shakers but often lack ISO 17025-accredited service networks, limiting penetration into GMP environments. Consequently, multinationals maintain premium price points yet fend off low-cost entrants by bundling calibration, documentation and 24/7 remote diagnostics, reinforcing their share of the laboratory mixer market.
Laboratory Mixer Industry Leaders
Thermo Fisher Scientific
Shuanglong Group Co., Ltd
IKA-Werke
Eppendorf AG
Bio-Rad Laboratories Inc.
- *Disclaimer: Major Players sorted in no particular order
Laboratory Mixer Market Companies Covered in this Report
- Thermo Fisher Scientific
- Eppendorf
- IKA-Werke GmbH & Co. KG
- Corning
- Bio-Rad Laboratories
- Benchmark Scientific
- Heidolph Instruments GmbH & Co. KG
- Grant Instruments (Cambridge) Ltd
- Ohaus Corporation
- REMI Group
- Silverson Machines Ltd
- Sarstedt
- Cole-Parmer (Antylia Scientific)
- Avantor Inc.
- Labstac
- Scilogex LLC
- Admix Inc.
- SP Scienceware (Bel-Art & H-B Instrument)
- Silverson Machines
- Labnet International

Market Opportunities and Future Outlook
White-space is emerging at the intersection of compliance-ready digital traceability and lab automation, where buyers want mixers that integrate with ELN/LIMS and support standardized, auditable protocols across sites. The FDA QMSR effective February 2, 2026 increases the importance of harmonized quality-system documentation and supplier controls for equipment used in regulated environments, reinforcing demand for programmable systems that can be qualified and supported through robust service and calibration packages. Separately, robotics-linked lab workflows highlighted in the market context, including ABB Robotics alliances with instrument providers, create an opportunity for mixer suppliers to package connectivity, remote monitoring, and device-to-cobot interoperability as a purchasable capability rather than one-off integration work.
Regional capacity build-outs in biopharma and diagnostics also provide tangible pull-through for laboratory mixing hardware in development, QC, and sample-prep labs. In May 2026, Sartorius opened a 140 million euro competence center in Freiburg focused on cell and gene therapy components, and in May 2026 bioMerieeux announced an investment of over 250 million euros for a new BIOFIRE PCR test manufacturing facility in La Balme-les-Grottes. These announcements support continued scaling of regulated workflows that typically require standardized mixing and documentation practices. Expansion in emerging manufacturing hubs broadens the install base as well: Lord's Mark Industries commissioned a new IVD manufacturing facility in Vasai, Maharashtra in June 2026, and Thermo Fisher commenced construction of a biological research media manufacturing plant in Barueri, Sao Paulo state in July 2026, which strengthens localized supply chains and service needs that favor vendors with regional support footprints.
Recent Industry Developments in Laboratory Mixer Market
- June 2026: IKA-Werke introduced the IKA HUB and updated its magnetic stirring portfolio, enabling centralized control of multiple connected lab devices via wireless interfaces and adding enhanced control features for routine stirring applications. The update reinforces the shift toward digitally networked, recipe-driven workflows where mixers operate as part of a broader automated bench rather than as standalone tools.
- April 2025: Asynt expanded its DrySyn Vortex line with an oil-free, temperature-controlled overhead stirring module designed for parallel synthesis setups. This adds options for laboratories trying to improve reproducibility while reducing the energy and cleanup burdens associated with traditional oil-bath heating and stirring.
- September 2024: Agilent Technologies acquired AI start-up Sigsense Technologies to enhance CrossLab Connect with smarter utilization analytics across lab instrument fleets. Improved usage and performance visibility supports tighter scheduling and standardization, influencing purchasing decisions for connected mixers and other programmable benchtop equipment.


Laboratory Mixer Market Report Scope and Research Methodology
Market Definition and Coverage
For this study, the market covers benchtop instruments used in laboratories to agitate, blend, or keep samples suspended during routine and research workflows. The sizing includes common lab mixer formats such as shakers, vortex mixers, and stirrers, along with dedicated accessories sold for these units.
Scope exclusions: Pilot-scale and production mixers with working volumes above 20 liters are excluded.
Segments Covered in This Report
- By Product Type
- Shakers
- Orbital Shakers
- Rockers/Rollers/Rotators
- Platform & Incubator Shakers
- Vortex Mixers
- Magnetic Stirrers
- Overhead & High-Shear Stirrers
- Homogenizers & Ultrasonic Mixers
- Accessories & Consumables
- Shakers
- By Mixing Technology
- Analog/Manual
- Digital/Programmable
- Automated Robotic Integrated Systems
- By Capacity Range
- ≤1 L
- 1–5 L
- Above 5 L
- By End User
- Pharmaceutical & Biotechnology Companies
- Contract Research & Manufacturing Organizations
- Academic & Research Institutes
- Clinical & Diagnostic Laboratories
- Others
- By Geography
- North America
- United States
- Canada
- Mexico
- Europe
- Germany
- United Kingdom
- France
- Italy
- Spain
- Rest of Europe
- Asia-Pacific
- China
- Japan
- India
- Australia
- South Korea
- Rest of Asia-Pacific
- Middle East and Africa
- GCC
- South Africa
- Rest of Middle East and Africa
- South America
- Brazil
- Argentina
- Rest of South America
- North America
Data Sources, Market Sizing, and Validation
Desk Research
Desk research is used to set boundaries and build the first pass of demand signals behind laboratory mixing equipment. We lean on public sources such as the US FDA database for registered manufacturing sites, USPTO patent filings to see where mixing technology is being improved, and OECD and World Bank indicators as proxies for lab activity and funding cycles.
We also review sources such as UN Comtrade trade statistics for relevant lab equipment movements, association websites for lab and life science updates, and peer-reviewed journals that describe sample prep workflows and mixing performance needs. In parallel, we use company filings, investor presentations, and reputable press to understand product positioning and pricing direction. A paid subscription is selectively used for company financials and intelligence, news and financials, and patent databases, mainly to cross-check revenue exposure and track product introductions. These sources are not exhaustive, and many other public references were used to collect data, validate assumptions, and clarify open questions.
Primary Interviews and Surveys
Primary work is used to pressure-test the desk view and fill gaps around how labs choose mixer types, replacement cycles, and typical pricing by capacity and control features. We speak with a mix of manufacturers, channel partners, and end users across academic, clinical, contract, and industrial labs, and the inputs are then used to confirm adoption rates and realistic ASP movements across regions.
Distribution of primary research fieldwork respondents
| Company type | Respondent position | Region |
|---|---|---|
| Top tier: 31% | CXOs: 16% | APAC: 47% |
| Mid tier: 51% | Functional/Unit leaders: 24% | EMEA: 31% |
| Smaller Players: 18% | Managers: 60% | Americas: 22% |
Market-Sizing & Forecasting
Sizing starts with a top-down build where lab activity and installed-base signals are translated into an addressable demand pool for benchtop mixers, then filtered by the penetration of mixer types used in sample preparation. We corroborate the totals with selective bottom-up checks, where sampled price points and observed shipment patterns are used to sanity-check the final revenue number and adjust where the top-down view looks stretched.
Key inputs in the model include the count of active labs and lab expansions, R&D and healthcare spending direction, replacement and upgrade cycles for benchtop equipment, average selling prices by mixer category and capacity band, and mix shift toward digital and programmable controls. Since data is not equally visible across every country, gaps are handled by using region-level proxies that are validated in interviews, followed by conservative assumptions on conversion and duty impacts where relevant. Forecasting is run using scenario analysis supported by a light multivariate regression, where the drivers are budget cycles, lab growth, and price progression confirmed by expert feedback before the forward curve is finalized.
Data Validation & Update Cycle
Model outputs are checked against independent signals such as equipment procurement activity, trade trends for related lab instruments, and implied revenue per active lab. This helps catch values that do not fit the real operating environment. When variances appear, the assumptions are re-opened, and follow-up calls are triggered with relevant respondents to confirm whether the change is due to pricing, mix shift, or timing.
A multi-step review is followed before sign-off, including peer checks of calculations and reasonableness tests across regions and product categories. Reports are refreshed annually, and interim updates are added when major events materially affect demand or pricing. Before delivery, the latest public updates are re-checked so clients receive a current view rather than an older snapshot.
Mordor Intelligence's Laboratory Mixer Market Size Compared Against Other Published Estimates
Published numbers for the laboratory mixer space do not always line up because each source draws the market boundary differently and also uses different pricing and timing assumptions. The biggest swings usually come from what is counted as a laboratory unit versus adjacent light industrial equipment, and from whether accessories and service items are included in the revenue pool.
By tracking mixer-format inclusion rules, refreshing currency conversion timing, and running variance checks across demand signals, Mordor Intelligence keeps the 2025 total tied to benchtop laboratory use cases and avoids pulling in larger pilot-scale equipment that can inflate the addressable value.
Benchmark comparison
| Source | Market Size | Gaps in Research Methodology |
|---|---|---|
| Mordor Intelligence | USD 2.23 B (2025) | |
| Global Consultancy A | USD 2.46 B (2025) | This estimate appears to use a broader definition that can fold in a wider set of lab mixing tools and bundled accessories, and it may apply a higher average price assumption across digital systems without separating capacity limits. |
| Industry Publisher B | USD 2.30 B (2025) | This estimate is close, but the gap can come from using a narrower end-user base and more conservative replacement cycle assumptions, which reduces the implied unit turnover in academic and clinical labs. |
Overall, the spread in published values is explained by practical modeling choices, mainly around product boundaries, accessory treatment, and how ASP progression is carried forward. When the demand pool is built from observable lab activity signals and then cross-checked with interview-led adoption and pricing ranges, the resulting market size stays transparent and repeatable year to year.


Key Questions Answered in the Report
What is the current value of the laboratory mixer market?
The laboratory mixer market stands at USD 2.31 billion in 2026 and is projected to reach USD 2.76 billion by 2031 at a 3.62% CAGR.
Which segment holds the largest share within the laboratory mixer market?
Shakers lead by product type, controlling 38.02% revenue in 2025 thanks to their versatility across cell-culture and assay workflows.
Why is Asia-Pacific the fastest-growing region for laboratory mixers?
Rapid pharmaceutical manufacturing expansion, surging CRO/CDMO activity and sizeable government investments in life-sciences infrastructure are driving a 4.98% regional CAGR.
Which region has the biggest share in Laboratory Mixer Market?
In 2025, the North America accounts for the largest market share in Laboratory Mixer Market.
How are automation trends influencing laboratory mixer purchases?
Digital mixers with programmable recipes dominate today, and automated robotic systems are the fastest-growing technology segment at a 5.18% CAGR as labs seek 24/7 throughput and error reduction.
Page last updated on:


 Your data is secure and never sold or shared.


