Laboratory Informatics Market Size and Share
Market Overview
| Study Period | 2020 - 2031 |
|---|---|
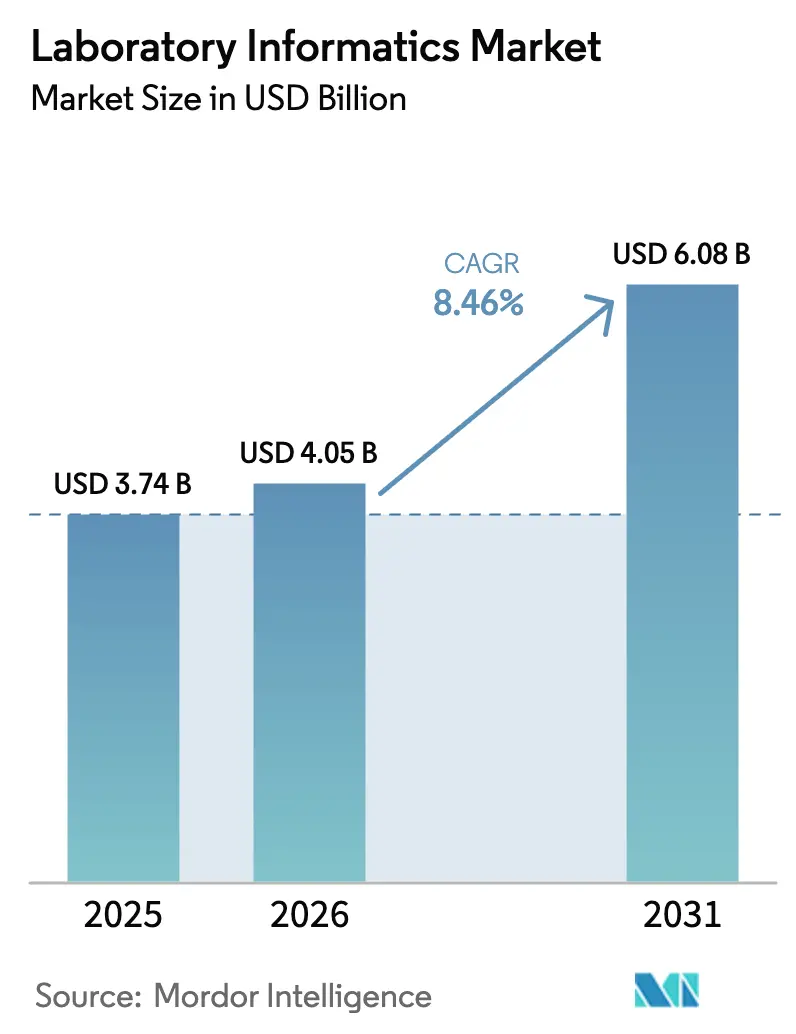
| Market Size (2026) | USD 4.05 Billion |
| Market Size (2031) | USD 6.08 Billion |
| Growth Rate (2026 - 2031) | 8.46% CAGR |
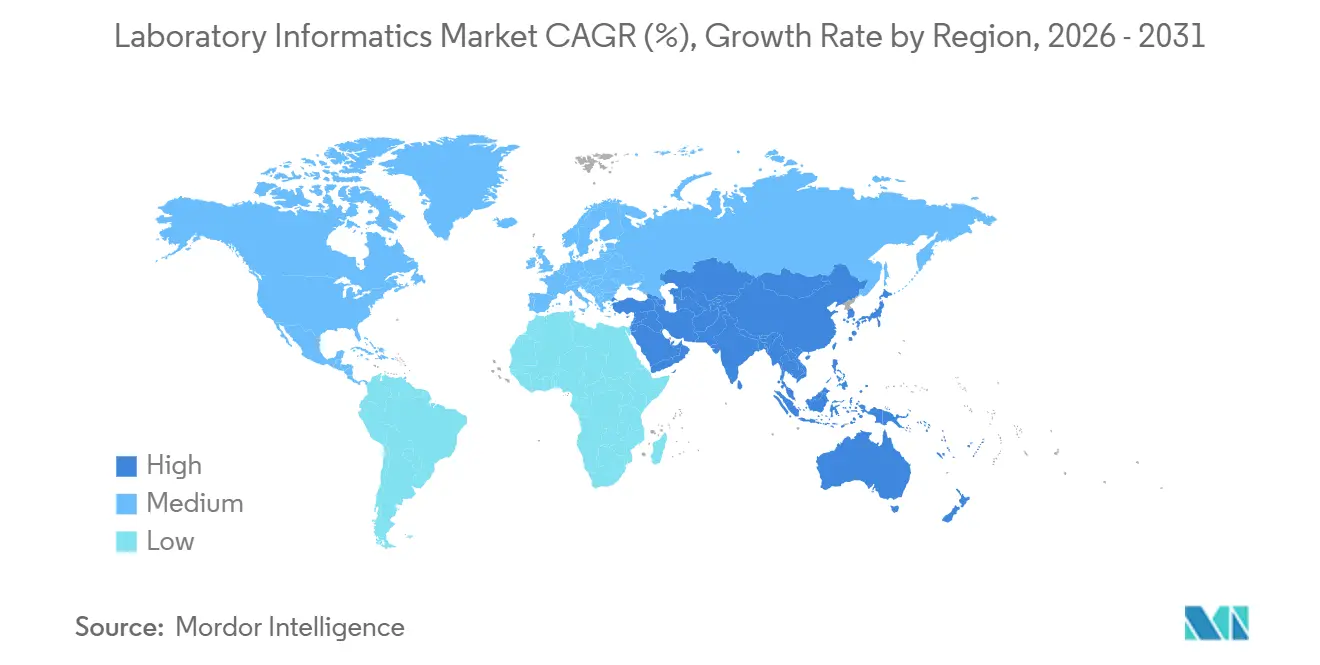
| Fastest Growing Market | Asia Pacific |
| Largest Market | North America |
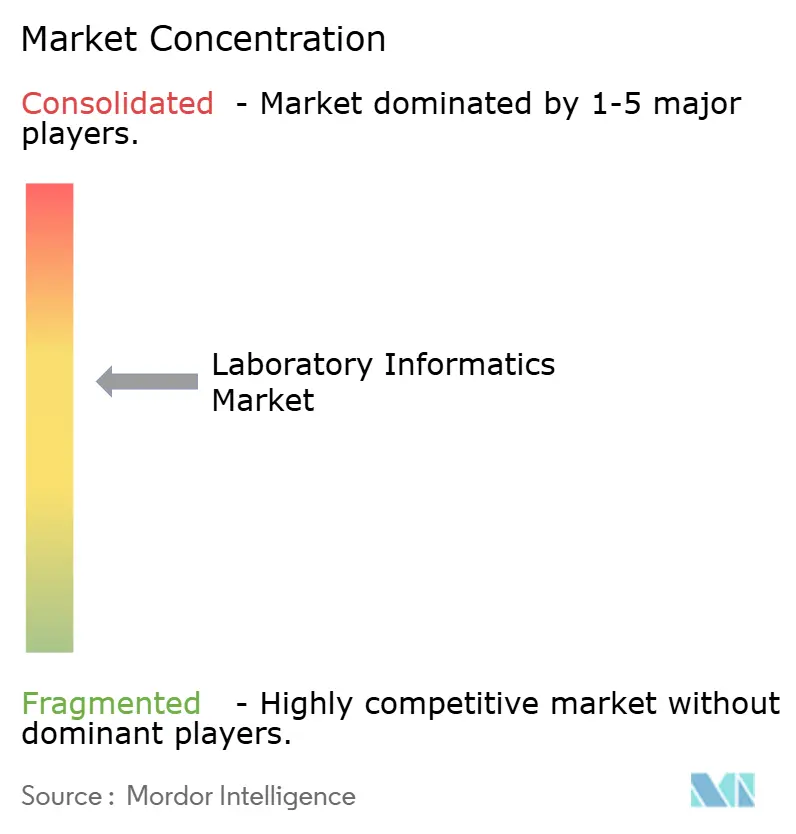
| Market Concentration | Medium |
Major Players *Disclaimer: Major Players sorted in no particular order Image © Mordor Intelligence. Reuse requires attribution under CC BY 4.0. | |
Laboratory Informatics Market Analysis by Mordor Intelligence
The Laboratory Informatics Market size is projected to be USD 3.74 billion in 2025, USD 4.05 billion in 2026, and reach USD 6.08 billion by 2031, growing at a CAGR of 8.46% from 2026 to 2031.
This expansion is rooted in a structural shift from paper records to cloud-native platforms, which incorporate artificial intelligence and real-time analytics to meet increasingly stringent regulatory demands. FDA 21 CFR Part 11, EMA Annex 11, and ISO 17025 requirements make validated electronic systems a prerequisite for market authorization, pushing life-science organizations to phase out legacy workflows. Precision-medicine programs that rely on multi-omics datasets further elevate the need for interoperable informatics, while a steady rise in outsourced R&D places contract research organizations (CROs) at the center of new deployments. Cybersecurity incidents, such as the June 2024 Synnovis ransomware attack, intensify focus on hardened cloud architectures and 24-hour backup cycles.
Key Report Takeaways
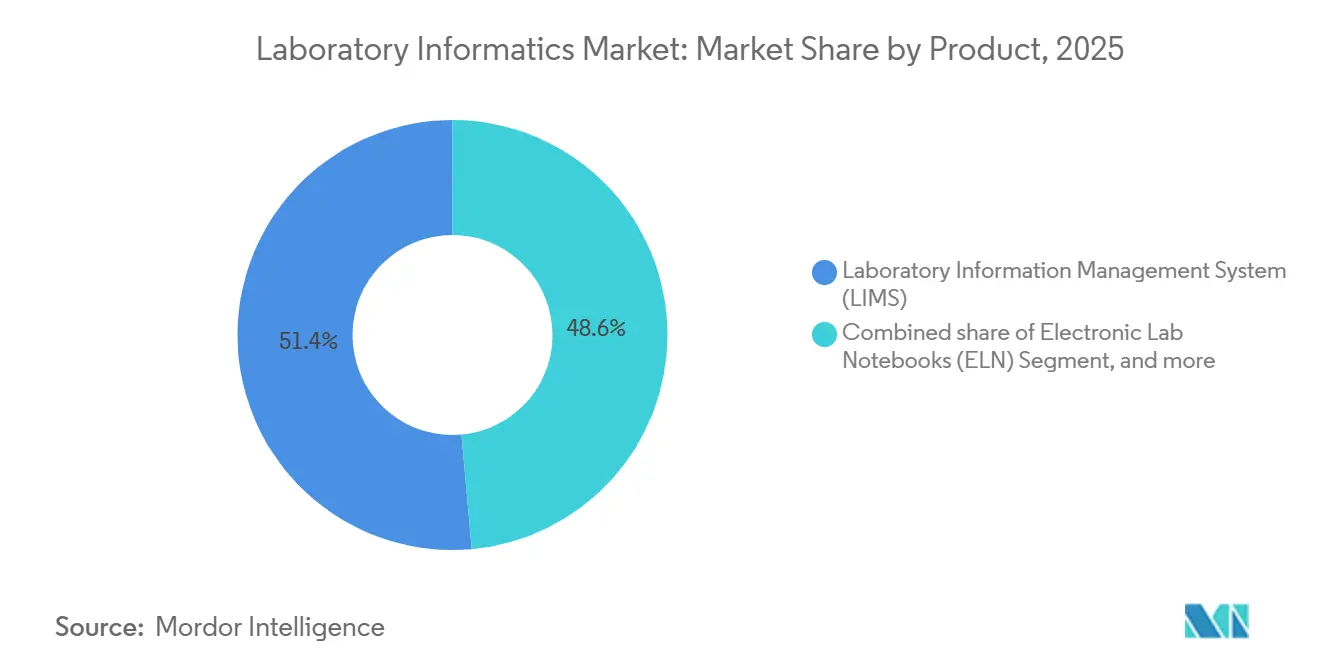
- By product, laboratory information management systems accounted for 51.42% laboratory informatics market share in 2025, while Electronic Lab Notebooks are on track for a 9.81% CAGR through 2031.
- By component, services, accounting for 58.67% of the laboratory informatics market size in 2025, are set to grow at an 8.95% CAGR from 2026 to 2031.
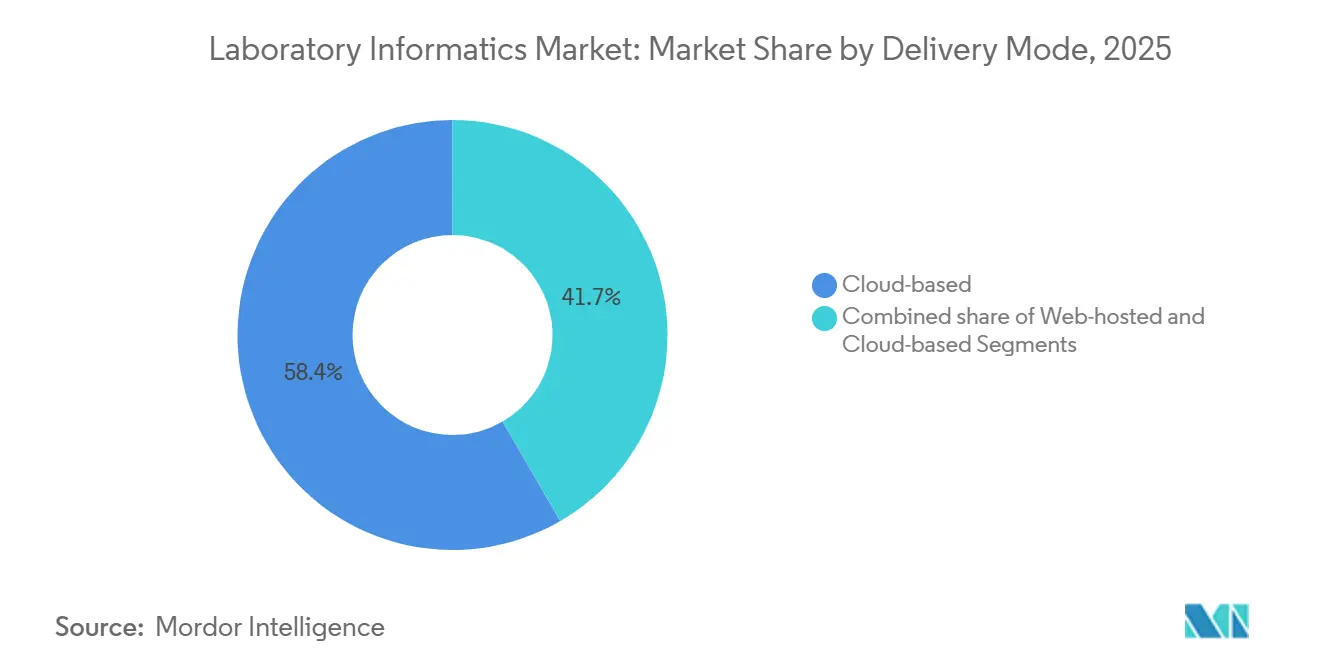
- By delivery mode, cloud-based platforms captured a 58.35% share in 2025 and are projected to accelerate at a 9.07% CAGR through 2031.
- By end user, pharmaceutical and biotechnology companies held 53.14% share in 2025; contract research organizations are forecast to register a 8.98% CAGR during 2026-2031.
- By geography, North America led with a 48.72% share in 2025, while Asia-Pacific is poised for a 9.43% CAGR to 2031.
Note: Market size and forecast figures in this report are generated using Mordor Intelligence’s proprietary estimation framework, updated with the latest available data and insights as of January 2026.
Global Laboratory Informatics Market Trends and Insights
Drivers Impact Analysis*
| Driver | (~) % Impact on CAGR Forecast | Geographic Relevance | Impact Timeline |
|---|---|---|---|
| Growing regulatory emphasis on data integrity and compliance | +1.8% | Global, strongest in North America & Europe | Medium term (2-4 years) |
| Rising adoption of cloud-based laboratory informatics platforms | +2.1% | Global, led by North America, APAC acceleration | Short term (≤ 2 years) |
| Expansion of precision medicine and genomics research | +1.5% | North America & Europe core, APAC emerging | Long term (≥ 4 years) |
| Integration of artificial intelligence and advanced analytics | +1.3% | Global, concentrated in North America & EU | Medium term (2-4 years) |
| Increasing outsourcing of R&D to contract organizations | +1.0% | Global, APAC & Eastern Europe hubs growing | Short term (≤ 2 years) |
| Pandemic-led shift toward remote and digital laboratory workflows | +0.8% | Global | Short term (≤ 2 years) |
| Source: Mordor Intelligence | |||
Growing Regulatory Emphasis on Data Integrity and Compliance
Regulators tightened electronic-record enforcement, making validated informatics indispensable for submissions. In 2024, FDA warning letters cited inadequate audit trails, prompting widespread adoption of LIMS across QC laboratories. EMA Annex 11 and the finalized ICH Q2(R2)/Q14 guidelines extend similar expectations in Europe. ISO 17025 revisions now reference electronic data management, prompting smaller testing labs to favor subscription-based, cloud-hosted solutions that embed validation artifacts and eliminate capital expense[1]ISO, “ISO 17025:2017 General requirements for the competence of testing and calibration laboratories,” iso.org. Collectively, these mandates accelerate enterprise transitions away from paper logbooks toward platforms offering role-based access, version control, and automated deviation alerts.
Rising Adoption of Cloud-Based Laboratory Informatics Platforms
Cloud deployments commanded 53.24% share in 2025 and are expanding at a 13.21% CAGR, as life-science firms scale capacity during trial surges without procuring new servers. Waters Empower 4 synchronizes chromatography data to AWS or Azure within minutes, empowering remote QA review and round-the-clock operations. European laboratory societies now recommend the use of geographically distributed data centers and 24-hour backups to counter ransomware threats. Upload latency for terabyte-scale NGS files remains a hurdle; vendors are embedding edge computing to trim bandwidth by nearly 40%. The validation scope broadens in the cloud era, compelling routine audits of underlying infrastructure to meet FDA guidance published in 2024.
Expansion Of Precision Medicine and Genomics Research
Precision-medicine projects drive demand for informatics that merge genomic, proteomic, and clinical data. The U.S. National Human Genome Research Institute awarded USD 50.3 million in 2024 to a multi-omics consortium that requires an interoperable LIMS capable of ingesting VCF files and aligning them to ClinVar for ACMG-compliant reporting[2]National Human Genome Research Institute, “NHGRI Awards for Multi-Omics Consortium,” genome.gov. Illumina’s TruSight Oncology 500 ctDNA assay links directly to oncology EHRs via HL7 FHIR, erasing manual transcription errors and shortening turnaround time. Talent shortages loom: The WHO forecasts a 10 million-person gap in healthcare workers by 2030, with bioinformaticians among the most scarce specialties, underscoring the value of turnkey analytics that minimize human intervention.
Integration Of Artificial Intelligence and Advanced Analytics
AI-driven modules automate anomaly detection and schedule instrument maintenance. LabVantage LIMS v8.8 predicts downtime by analyzing failure patterns, cutting unplanned maintenance by 25%. Agilent OpenLab CDS 2.7 utilizes neural networks for peak integration, flagging co-elution events that are often missed in manual review. Benchling’s R&D Cloud leverages generative AI to propose experimental protocols, reducing design time by up to 40%. Despite clear productivity gains, high validation costs—frequently surpassing USD 500,000 per algorithm—limit adoption among mid-sized labs.
Restraints Impact Analysis*
| Restraint | (~) % Impact on CAGR Forecast | Geographic Relevance | Impact Timeline |
|---|---|---|---|
| High upfront implementation and validation costs | -1.2% | Global, acute in emerging markets (India, Southeast Asia, South America) | Short term (≤ 2 years) |
| Data security and privacy concerns in cloud deployment | -0.9% | Global, heightened in EU (GDPR) & North America (FDA scrutiny) | Medium term (2-4 years) |
| Legacy instrument integration challenges | -0.8% | Global, more acute in North America & Europe with older instrument estates | Medium term (2-4 years) |
| Shortage of skilled bioinformatics and IT personnel | -0.7% | Global, particularly acute in APAC and emerging markets | Long term (≥ 4 years) |
| Source: Mordor Intelligence | |||
High Upfront Implementation and Validation Costs
A single LIMS roll-out in a pharmaceutical QC lab can cost USD 500,000 to USD 2 million, with validation consuming as much as 40% of the budget. Thermo Fisher estimates 3,000-5,000 consulting hours per deployment, a barrier for mid-tier organizations. While SaaS subscriptions remove server outlays, annual fees often exceed USD 100,000 for a 50-user license. Payback periods extend beyond three years, deterring labs that face uncertain revenue streams.
Data Security and Privacy Concerns in Cloud Deployment
Healthcare experienced the highest average data-breach cost in 2024 at USD 9.77 million, amplifying scrutiny on cloud providers. GDPR fines can reach 4% of global revenue, obligating European labs to undertake data-protection impact assessments before migration. Pharmaceutical firms restrict the storage of trade-secret molecular structures on shared infrastructure, prompting vendors to offer private-cloud deployments within customer-controlled virtual networks, which sacrifice some cost advantages.
*Our forecasts treat driver/restraint impacts as directional, not additive. The impact forecasts reflect baseline growth, mix effects, and variable interactions.
Segment Analysis
By Product: LIMS Dominance, ELN Acceleration
Laboratory information management systems accounted for 51.42% of the laboratory informatics market share in 2025, anchoring global QC and diagnostic workflows. Electronic Lab Notebooks, benefiting from remote-work norms, are set for a 9.81% CAGR, the swiftest among product types. AI-enabled CDS and LES modules offer premium analytics, while enterprise content-management systems are facing commoditization due to the availability of inexpensive cloud storage.
LIMS remain the backbone because regulatory inspections increasingly demand electronic audit trails. Meanwhile, ELNs are expanding across discovery teams, seeking structured, searchable data. Hybrid platforms that unify LIMS and ELN capabilities are emerging, positioning vendors for upsell opportunities as customers consolidate software estates.

By Component: Services Lead, Software Gains
Services accounted for 58.67% of the laboratory informatics market size in 2025, primarily due to the labor-intensive nature of validation and integration. Software revenue is expected to grow at an 7.73% CAGR through 2031 as vendors shift to subscription licensing, integrate modular AI analytics, and offer mobile access. Regulatory consulting and managed services command high margins; however, self-service configuration tools are starting to reduce the need for engagement hours in straightforward deployments.
SaaS delivery enables continuous feature upgrades, encouraging customers to adopt new modules, such as predictive maintenance, without requiring new capital approvals. Over time, growing in-house expertise should narrow the services-to-software ratio; however, complex legacy instrument estates will keep professional services relevant.
By Delivery Mode: Cloud Ascendancy Reshapes Infrastructure
Cloud solutions captured 58.35% share in 2025, benefiting from elastic scaling and global availability zones that satisfy follow-the-sun QC operations. Hybrid designs keep instrument control local while mirroring data to AWS or Azure within minutes, balancing latency and compliance. On-premise installations persist in data-sovereign jurisdictions, though vendors are certifying regional data centers to unblock adoption.
In 2024, the FDA released guidance clarifying that sponsors remain accountable for data integrity, even when using third-party clouds, which drives routine audits of infrastructure controls. Vendors now ship ISO 27001-certified templates to reduce the scope of user validation, thereby accelerating the go-live of new sites.
By End User: CROs Outpace Pharma Growth
Pharmaceutical and biotechnology enterprises held 53.14% share in 2025, but CROs are projected to expand at a 8.98% CAGR as outsourcing intensifies. CROs demand multi-tenant LIMS with sponsor-segregated data views, accelerating uptake of cloud-native architectures. Academic consortia and government labs often adopt open-source platforms to avoid license fees; however, integrating with commercial instruments can be challenging.
Precision-medicine clinics and hospital labs prioritize EHR interoperability via HL7 FHIR, pulling LIS and LIMS vendors into healthcare IT standards that historically sat outside pure research environments.
Geography Analysis
North America retained a 48.72% share in 2025, largely due to rigorous FDA enforcement and the presence of dense biopharma clusters. The FDA issued 18 data-integrity warning letters in 2024 alone, catalyzing rapid system upgrades. Canada adopted ICH Q2(R2) in 2024, prompting CAD 2.8 billion (USD 2.1 billion) in laboratory digitalization projects[3]. Growth moderates as the installed base matures and replacement cycles lengthen to nearly a decade.
Asia-Pacific is forecast to record a 9.21% CAGR through 2031, propelled by India’s ambitions to double its pharmaceutical market to USD 130 billion by 2030. China’s NMPA mandated electronic batch records with audit trails in 2024, accelerating local demand for compliant LIMS solutions. Japan’s digital health expansion, projected to grow at an 11.9% CAGR through 2032, further underpins the regional upside.
Europe maintains steady adoption, buoyed by GDPR and Annex 11. Germany invested EUR 1.9 billion (USD 2.1 billion) in 2024 to modernize pharmaceutical labs, with AI-enhanced LIMS deployed at BASF and Bayer. The June 2024 Synnovis ransomware event prompted UK authorities to mandate endpoint detection across all laboratory IT systems. Middle Eastern laboratories pursue ISO 17025 accreditation to enhance export credibility, while South American uptake remains preliminary, pending national e-record mandates.
Mordor Intelligence provides coverage of the laboratory informatics market across other key regional markets. Detailed country-level analysis extends to United States incorporating local coverage and market participation, as required.


Competitive Landscape
Thermo Fisher Scientific, Danaher, and Agilent Technologies collectively command roughly 35% of the laboratory informatics market, shaping a moderately concentrated field. Thermo Fisher’s USD 3.1 billion purchase of Olink Proteomics in July 2024 and USD 4.1 billion acquisition of Solventum in February 2025 extend SampleManager LIMS into proteomics and infection-control domains. Danaher’s IDBS integrates seamlessly with Cytiva bioprocess equipment, strengthening an end-to-end cell-therapy workflow. Agilent’s April 2025 acquisition of Genohm broadens OpenLab’s reach into next-generation sequencing data management.
Challengers such as Benchling and Dotmatics offer cloud-native suites that reduce deployment time from 12 months to under 10 weeks, appealing to fast-moving biotech startups. AI modules represent a battleground; LabVantage and Agilent embed predictive maintenance and anomaly detection, yet validation costs remain steep. Standards initiatives, such as the Allotrope Data Format, enhance interoperability, curbing vendor lock-in and fostering best-of-breed ecosystems.
Laboratory Informatics Industry Leaders
Thermo Fisher Scientific Inc.
LabWare
Abbott (STARLIMS Corporation)
LabVantage Solutions Inc.
Agilent Technologies Inc.
- *Disclaimer: Major Players sorted in no particular order

Recent Industry Developments
- December 2025: Lab Thread Ltd announced the beta launch of its flagship unified lab software platform on April 27, 2024. The platform is designed to be user-friendly and enhances collaboration among researchers, lab operations, and scientific data teams. This development aims to accelerate scientific discovery by uniting various lab functions in one integrated system.
- September 2025: LabWare, Inc., a global player in Laboratory Information Management Systems (LIMS), announced the release of Clinical Health Solution 5.06. This update enhances capabilities for managing clinical diagnostics and public health laboratory operations. The announcement highlights the company's ongoing commitment to supporting laboratory efficiency and innovation.
- September 2025: Sapio Sciences launched Sapio ELaiN, the world's first 3rd-generation Electronic Lab Notebook (ELN). This AI-powered platform acts as a co-scientist, actively assisting in planning, designing, and analyzing experiments. It aims to accelerate biopharma R&D by transforming passive record-keeping into an intelligent research partner.


Research Methodology Framework and Report Scope
Market Definitions and Key Coverage
According to Mordor Intelligence, the laboratory informatics market covers every commercial or open-source software platform and associated service that captures, stores, analyzes, and transmits scientific or quality-control data generated inside research, clinical, and industrial laboratories. Revenue streams counted in our model include perpetual and subscription licenses, cloud hosting, implementation, validation, and ongoing managed services across LIMS, ELN, SDMS, LES, CDS, ECM, and closely allied modules.
Scope Exclusion: Stand-alone analytical instruments, middleware sold without informatics licenses, and in-house tools coded by end users are not valued.
Segmentation Overview
- By Product
- Laboratory Information Management System (LIMS)
- Electronic Lab Notebooks (ELN)
- Enterprise Content Management (ECM)
- Laboratory Execution System (LES)
- Chromatography Data System (CDS)
- Other Products
- By Component
- Services
- Software
- By Delivery Mode
- On-Premise
- Web-Hosted
- Cloud-Based
- By End User
- Pharmaceutical & Biotechnology Companies
- Contract Research Organizations (CROs)
- Other End Users
- Geography
- North America
- United States
- Canada
- Mexico
- Europe
- Germany
- United Kingdom
- France
- Italy
- Spain
- Rest of Europe
- Asia-Pacific
- China
- Japan
- India
- Australia
- South Korea
- Rest of Asia-Pacific
- Middle East & Africa
- GCC
- South Africa
- Rest of Middle East & Africa
- South America
- Brazil
- Argentina
- Rest of South America
- North America
Detailed Research Methodology and Data Validation
Primary Research
Mordor analysts next interview lab IT managers, quality heads at pharmaceutical and CRO facilities, and regional system integrators across North America, Europe, and Asia. These conversations validate license renewal cycles, typical service ratios, and cloud-migration timelines, filling any gaps left by secondary sources.
Desk Research
Our analysts first sweep freely available tier-one sources such as the U.S. FDA 510(k) database, European Medicines Agency guidance notes, OECD GLP inspection reports, and national statistics on laboratory counts to size the potential user base. Trade association white papers from bodies such as the International Society for Pharmaceutical Engineering and the Clinical & Laboratory Standards Institute, together with peer-reviewed articles in journals like Nature Biotechnology, refine adoption rates for cloud and AI modules.
Financial filings, investor decks, and SEC 10-Ks of leading platform vendors supply pricing brackets, service mix, and regional revenue splits, which are then matched with shipment traces from Volza and news flow archived on Dow Jones Factiva. This desk work offers the baseline; many other public and paid sources were also referenced for cross-checks and clarifications.
Market-Sizing & Forecasting
We employ a top-down build that starts with accredited lab counts and average spend per lab by type, supported by bottom-up supplier roll-ups for spot validation. Key variables tracked include regulated lab site growth, biopharma R&D outlays, cloud deployment penetration, regional compliance deadlines, average service-to-software ratios, and prevailing exchange rates. Multivariate regression and scenario analysis project each driver forward, while missing service revenues in fragmented regions are imputed using peer pricing and capacity-utilization analogs.
Data Validation & Update Cycle
Outputs pass three-layer reviews: automated variance flags, senior-analyst reconciliation, and a final sign-off before release. The model refreshes annually; material events such as a major regulatory change trigger interim updates so clients always receive our latest view.
Why Mordor's Laboratory Informatics Baseline Commands Reliability
Published estimates often diverge because firms choose different product spreads, service inclusions, and currency conversions. Our disciplined scoping, yearly refresh, and transparent source tagging keep the baseline tight and reproducible.
Key gap drivers center on whether services are fully counted, how cloud fees are annualized, and the rigor applied to validating vendor disclosures against regulated lab footprints.
Benchmark comparison
| Market Size | Anonymized source | Primary gap driver |
|---|---|---|
| USD 3.82 B | Mordor Intelligence | |
| USD 3.90 B | Global Consultancy A | Excludes validation and managed-service revenue, lowering totals |
| USD 5.30 B | Industry Association B | Adds adjacent middleware and laboratory automation software, inflating scope |
| USD 3.83 B | Regional Consultancy C | Uses constant 2023 exchange rates without adjusting for 2024 currency shifts |
In short, our balanced mix of audited public data, direct stakeholder insight, and clearly declared scope gives decision-makers a dependable, middle-ground figure that can be traced back to observable variables and repeated with limited resources.


Key Questions Answered in the Report
What is the projected value of the laboratory informatics market in 2031?
The market is forecast to reach USD 6.08 billion by 2031, expanding at an 8.46% CAGR.
Which segment is expected to grow fastest through 2031?
Electronic Lab Notebooks are projected to log a 9.81% CAGR, the highest among product categories.
Why are CROs important to future demand?
Outsourcing trends compel CROs to deploy multi-tenant LIMS, driving a 8.98% CAGR within this end-user group.
How significant is cloud deployment in upcoming investments?
Cloud platforms already hold 53.24% share and are growing at 9.07% CAGR, eclipsing on-premise alternatives.
Which region offers the highest growth potential?
Asia-Pacific is poised for a 9.43% CAGR to 2031, buoyed by India's expanding pharmaceutical base and regulatory reforms.
What are key risks when adopting AI-driven informatics?
Validation costs can top USD 500,000 per algorithm, and organizations remain responsible for data-integrity compliance even when using third-party clouds.
Page last updated on:


