
Laboratory Gas Generators Market Size and Share
Market Overview
| Study Period | 2020 - 2031 |
|---|---|
| Market Size (2026) | USD 567.34 Million |
| Market Size (2031) | USD 781.73 Million |
| Growth Rate (2026 - 2031) | 6.62 % |
| Fastest Growing Market | Asia-Pacific |
| Largest Market | North America |
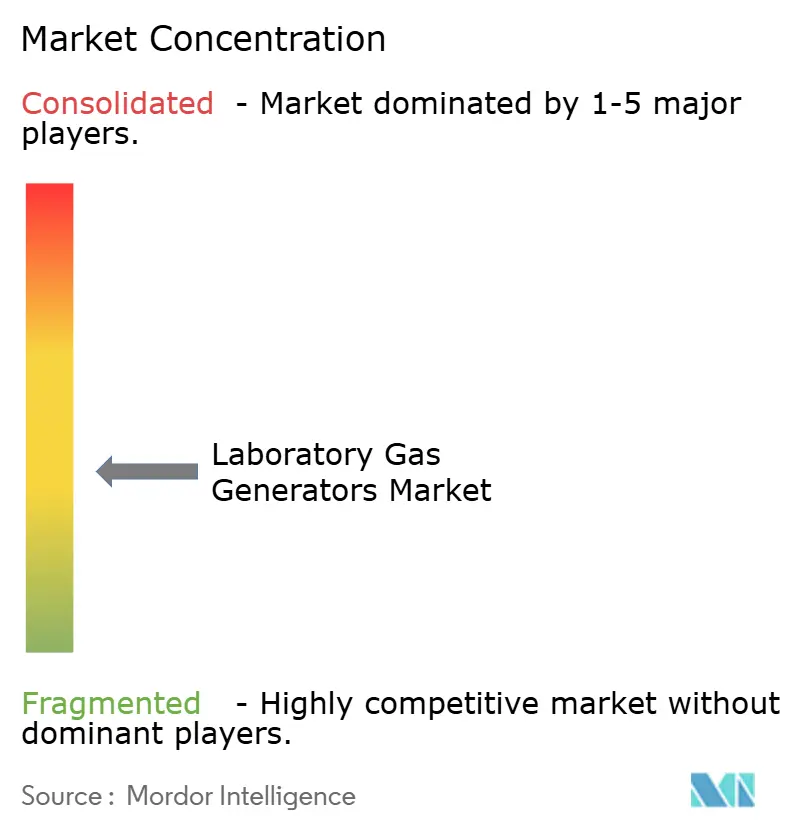
| Market Concentration | Medium |
Major Players *Disclaimer: Major Players sorted in no particular order Image © Mordor Intelligence. Reuse requires attribution under CC BY 4.0. | |
Laboratory Gas Generators Market Analysis by Mordor Intelligence
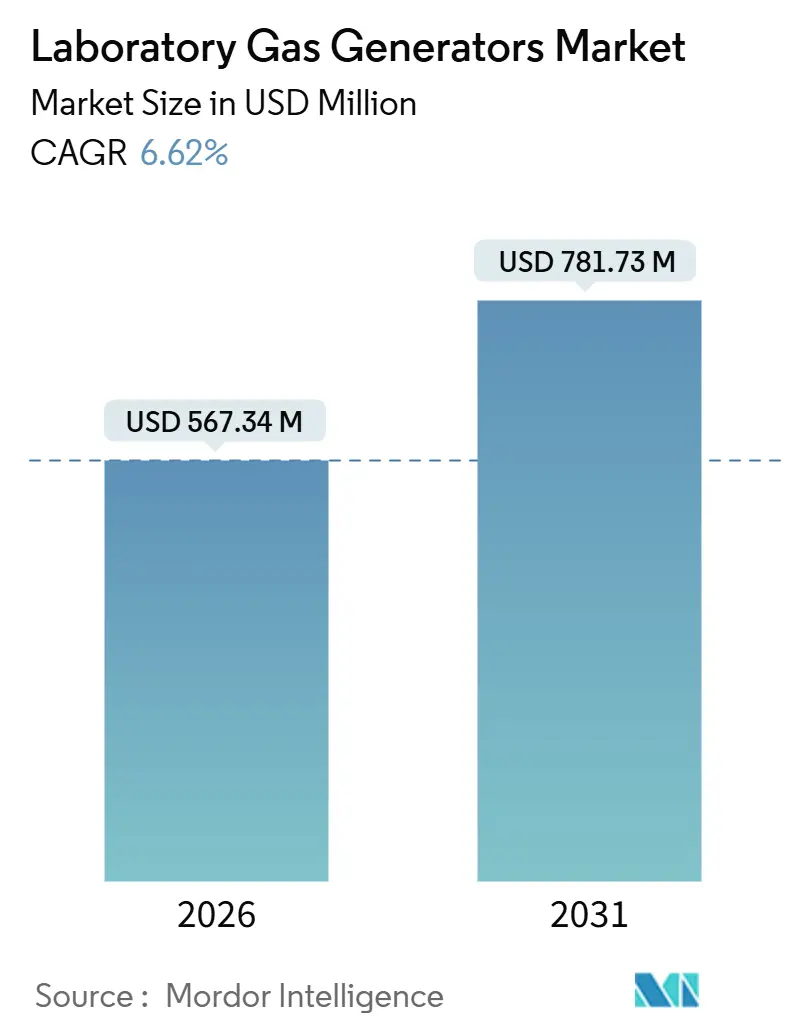
The Laboratory Gas Generators Market size is estimated at USD 567.34 million in 2026, and is expected to reach USD 781.73 million by 2031, at a CAGR of 6.62% during the forecast period (2026-2031).
The transition from cylinder supply to on-site generation is accelerating as analytical methods become more stringent, semiconductor capital spending exceeds USD 100 billion, and helium prices rise above USD 14 per cubic meter. Demand is concentrated in nitrogen systems that support LC-MS workflows; however, hydrogen generators are setting the pace as chromatography laboratories switch from helium carrier gas to improve supply-chain resilience. The push toward predictive maintenance, evident in IoT-enabled platforms that reduce the total cost of ownership by 12%, is reshaping procurement criteria. Growth opportunities are coalescing around modular skid-mounted units for academic institutions and semiconductor fabs, which are now receiving generous incentives under the CHIPS Act.
Key Report Takeaways
- By gas type, nitrogen accounted for 42.81% of the laboratory gas generators market share in 2025, while hydrogen is projected to register a 7.86% CAGR through 2031.
- By application, gas chromatography led with a 33.73% revenue share in 2025; GC-MS is forecast to advance at an 8.38% CAGR from 2026 to 2031.
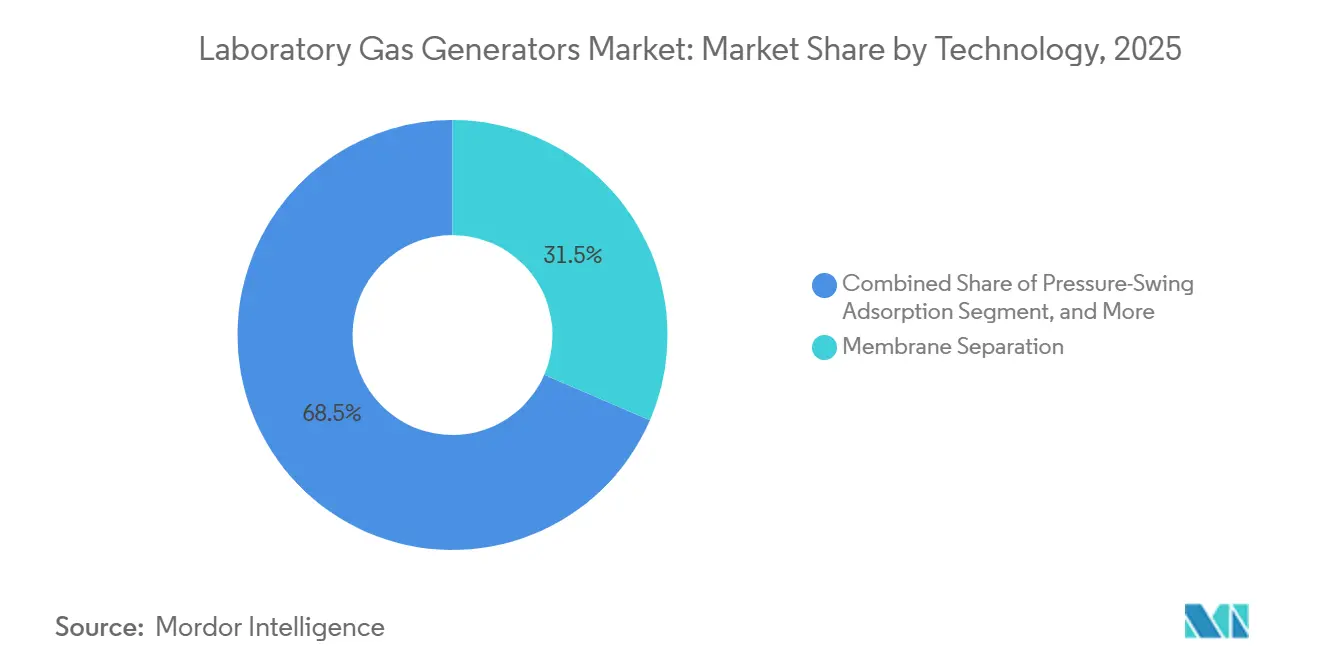
- By technology, membrane separation captured 31.48% of 2025 installations, whereas pressure-swing adsorption is poised to grow at a 6.87% CAGR to 2031.
- By end user, pharmaceutical and biotechnology companies held 40.16% in 2025; food and beverage laboratories are expected to climb at a 9.92% CAGR through 2031.
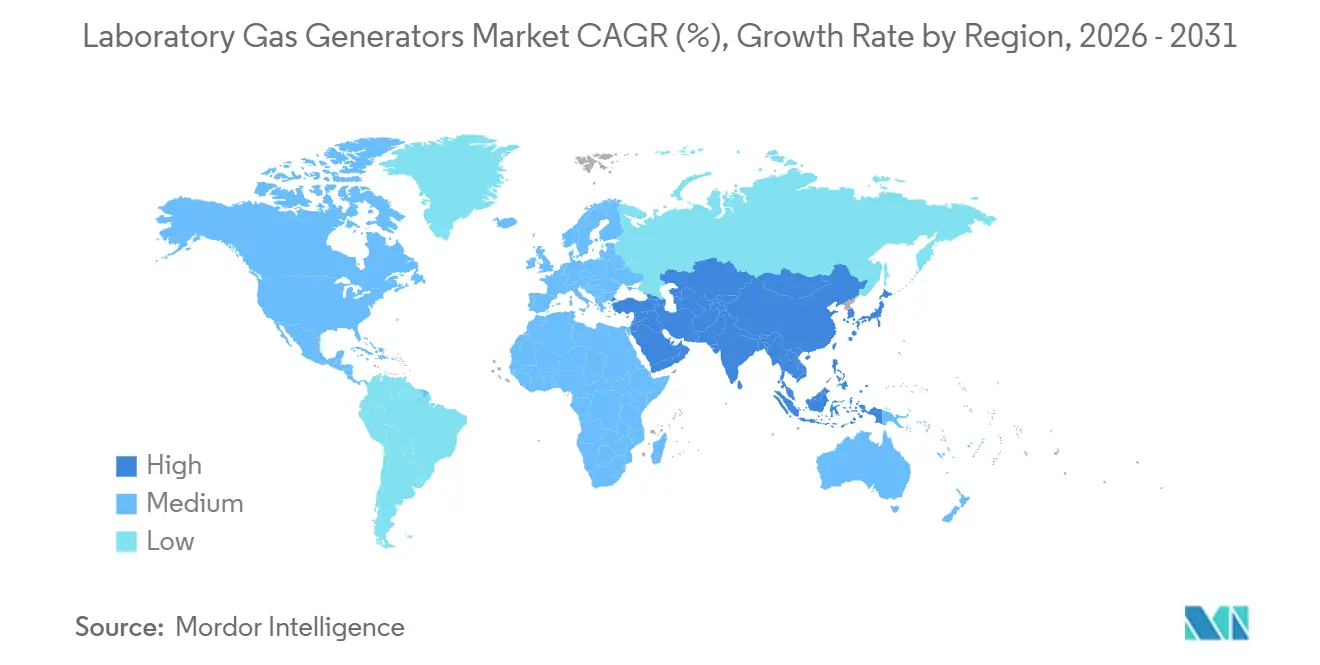
- By geography, North America accounted for 36.26% of 2025 revenue; the Asia-Pacific region is projected to expand at a 9.01% CAGR from 2026 to 2031.
Note: Market size and forecast figures in this report are generated using Mordor Intelligence’s proprietary estimation framework, updated with the latest available data and insights as of January 2026.
Market Trends and Insights
Drivers Impact Analysis of Laboratory Gas Generators Market*
| Driver | (~) % Impact on CAGR Forecast | Geographic Relevance | Impact Timeline |
|---|---|---|---|
| Rising Safety Concerns Over Conventional Gas Cylinders | +1.2% | Global, heightened in North America & EU | Short term (≤ 2 years) |
| Growing Adoption of Analytical Techniques in Drug & Food Approvals | +1.5% | Global, led by North America, EU, Asia-Pacific pharma hubs | Medium term (2-4 years) |
| Escalating R&D Spending Among Life-Science & Semiconductor Fabs | +1.8% | North America (CHIPS Act), Asia-Pacific (TSMC, Samsung), EU (Horizon) | Long term (≥ 4 years) |
| Surging Demand for On-Site Hydrogen as Helium Substitute | +0.9% | Global, acute in regions with helium dependency | Medium term (2-4 years) |
| AI-Enabled Predictive Maintenance Lowering TCO | +0.7% | North America & EU early adopters, spreading to Asia-Pacific | Medium term (2-4 years) |
| Growing Technological Advancement Boosting Demand | +0.5% | Global, concentrated in high-throughput analytical labs | Long term (≥ 4 years) |
| Source: Mordor Intelligence | |||
Rising Safety Concerns Over Conventional Gas Cylinders
Laboratory incidents involving high-pressure cylinders have intensified regulatory attention, and OSHA 1910.101 compliance adds USD 2,000-USD 5,000 per cylinder each year.[1] Frequent inspections mandated by NIST and NIH inflate operating budgets by 22% relative to on-site units that avoid handling risk. Insurance premiums rise 15-30% for facilities storing more than 50 cylinders. Nitrogen and hydrogen generators operate below 10 bar, reducing the probability of catastrophic failure by an order of magnitude. Because generators are considered fixed assets, they are exempt from Department of Transportation placarding, which simplifies logistics and accelerates the acceptance process.
Growing Adoption of Analytical Techniques in Drug & Food Approvals
FDA’s Laboratory Flexible Funding Model makes chromatography and mass spectrometry mandatory in pharmaceutical quality control, pushing demand for continuous nitrogen streams.[2] Agilent booked USD 513 million in LC/MS revenue in Q4 2024, while Waters logged USD 265 million in LC system sales in Q3 2024, indicating sustained growth in instrumentation. EFSA’s updated validation guide similarly compels European food labs to deploy chromatography. Each LC-MS platform consumes up to 25 L min⁻¹ of nitrogen, resulting in annual cylinder costs exceeding USD 12,000, which on-site systems recoup within 18 months. The result is a pronounced shift toward the adoption of generators across regulated environments.
Escalating R&D Spending Among Life-Science & Semiconductor Fabs
CHIPS Act incentives of USD 38.22 billion in grants plus USD 75 billion in loans drive new fabs requiring nitrogen flows exceeding 50,000 m³ h⁻¹.[3] TSMC’s Arizona project alone is valued at over USD 65 billion, featuring large-scale generator installations within cleanrooms. Biogen’s 2023 contract manufacturing revenue of USD 848.2 million highlights biologics output that depends on GC-MS and LC-MS testing. Total pharmaceutical R&D topped USD 200 billion in 2024, sustaining double-digit installation rates. Federal support for 250 kW PEM prototypes indicates a broader commitment to distributed hydrogen generation.
Surging Demand for On-Site Hydrogen as Helium Substitute
Laboratory-grade helium exceeded USD 14 per m³ in 2025, prompting chromatographers to adopt hydrogen as a carrier gas. Hydrogen generators that integrate palladium membranes deliver 99.9995% purity suitable for trace-level analysis, a specification met by Parker Hannifin’s ChromGas H2F line. Faster diffusion permits shorter run times, a productivity gain valued in high-throughput pharmaceutical labs. Semiconductor fabs also deploy hydrogen for forming-gas anneals, bundling the gas with nitrogen packages to simplify procurement. Supply resilience motivations therefore complement cost advantages, accelerating uptake.
Restraints Impact Analysis of Laboratory Gas Generators Market*
| Restraint | (~) % Impact on CAGR Forecast | Geographic Relevance | Impact Timeline |
|---|---|---|---|
| Reluctance To Replace Established Cylinder Infrastructure | -0.8% | Global, pronounced in academic and government labs | Short term (≤ 2 years) |
| Raw-Material Supply Risk for PEM Catalyst Metals | -0.6% | Global, acute for iridium-dependent systems | Long term (≥ 4 years) |
| Shortage Of Skilled Service Engineers | -0.5% | Emerging Asia-Pacific, Middle East & Africa | Medium term (2-4 years) |
| Grid-Power Instability in Emerging Markets | -0.4% | Asia-Pacific, Middle East & South America | Medium term (2-4 years) |
| Source: Mordor Intelligence | |||
Reluctance To Replace Established Gas-Cylinder Infrastructure
Capital outlays of USD 25,000-80,000 per generator deter switchovers when existing cylinder contracts include multiyear price locks. Volume rebates and deferred billing from cylinder suppliers conceal lifecycle economics, while generator vendors often demand upfront commitments. Legacy laboratories usually lack sufficient electrical capacity or floor space for PSA or PEM units, making upgrades costly and complex. Analytical method revalidation, as required by FDA 21 CFR Part 11 and ISO 17025, can consume 400 labor hours, further delaying payback. Risk-averse quality teams frequently postpone adoption, sustaining cylinder demand despite higher per-liter costs.
Raw-Material Supply Risk for PEM Catalyst Metals
Global iridium output is roughly 8.17 tonnes per year, yet projected PEM demand by 2030 requires ten times that volume. Platinum demand also rises, with WPIC estimating 229,000 troy oz needed for electrolyzers by 2030. Toshiba has demonstrated nanostructured iridium catalysts that reduce loading by 90%, but field durability remains uncertain. Producers, therefore, embed 6–12 months of lead time into procurement, exposing projects to price swings. Until recycling and substitution options scale, raw-material scarcity tempers growth in hydrogen units.
*Our forecasts treat driver/restraint impacts as directional, not additive. The impact forecasts reflect baseline growth, mix effects, and variable interactions.
Laboratory Gas Generators Market Segment Analysis
By Gas Type:
Hydrogen Displaces Helium in Carrier-Gas RolesNitrogen systems generated 42.81% of 2025 revenue, reflecting their ubiquity in LC-MS workflows across pharmaceutical quality control and food safety. Hydrogen units are expected to be the fastest risers, with a 7.86% CAGR through 2031, as chromatographers switch to carrier gas in response to helium scarcity. Zero-air generators serve flame-ionization detectors that require hydrocarbon levels below 0.1 ppm, ensuring compliance with EPA Method 8015. TOC and oxygen generators address water system validation and cell culture demands in biologics production. Each technology presents a distinct purity-versus-cost profile that laboratories align with instrument specifications.
Helium market volatility continues to elevate total operating costs, strengthening the case for hydrogen. Palladium-membrane designs such as Parker Hannifin ChromGas H2F achieve 99.9995% purity, satisfying trace detection limits in pesticide or pharmaceutical impurity assays. Nitrogen remains dominant in regulated LC-MS environments that prioritize reliability, while hydrogen gains a share in academic and environmental labs seeking lower operating expenses. Zero-air and TOC oxygen systems remain smaller niches but are growing as food-safety frameworks expand.


By Application:
GC-MS Adoption Accelerates in Pharmaceutical QCGas chromatography accounted for 33.73% of 2025 revenue due to its entrenched usage in petrochemical, environmental, and food laboratories. GC-MS is forecasted to advance at an annual rate of 8.38% through 2031, driven by ICH Q3D, which promotes pharmaceutical impurity profiling. LC-MS setups, which each consume up to 25 L min⁻¹ of nitrogen, double gas demand compared with stand-alone LC instruments. Gas analyzers and spectroscopy systems extend the use of generators into process analytical technology arenas.
Waters Corporation’s USD 265 million in LC sales in Q3 2024 underscores the momentum behind ultra-high-performance platforms. Food-safety laboratories are accelerating the adoption of GC-MS because EFSA now mandates chromatography for pesticide and mycotoxin screening. Each GC-MS requires a sustained hydrogen carrier gas and zero air for FID detection, making on-site generation an attractive option. Process analyzers in bioprocessing rely on nitrogen purges to prevent oxidation artifacts, creating additional pull for high-flow PSA units.
By Technology:
PSA Gains Ground Through Energy EfficiencyMembrane separation accounted for 31.48% of 2025 installations, thanks to its compact form and minimal maintenance requirements. PSA is projected to increase by 6.87% annually through 2031 as carbon molecular sieve innovations reduce power draw by 18% in high-throughput labs. Electrolytic systems dominate hydrogen production, although iridium bottlenecks elevate material risk. Catalytic reforming remains prevalent in petrochemical settings but is being challenged by the decline in electrolyzer costs, driven by the increasing availability of renewable power.
PSA units achieve 99.999% nitrogen purity and now deploy IoT sensors that anticipate bed saturation, boosting uptime. Membrane systems trade purity for ease of use, with nitrogen purity of 95–99.5% acceptable in many food-safety assays. Toshiba’s iridium-light PEM advances remain in pilot stages, so most labs still rely on conventional catalyst loadings. Technology selection depends on a balance between purity, flow, and lifecycle cost, variables that differ across pharmaceutical, academic, and semiconductor facilities.
By End User:
Food & Beverage Labs Outpace Pharma GrowthPharmaceutical and biotechnology firms commanded 40.16% of demand in 2025, supported by Biogen’s USD 848.2 million contract manufacturing revenue and the heavy reliance on LC-MS and GC-MS testing. Food and beverage laboratories are expected to grow at a rate of 9.92% annually through 2031, driven by the FDA’s flexible funding and EFSA rules, which require chromatographic screening. Academic institutes leverage DOE grants for PEM prototypes, diffusing hydrogen technology into research settings.
Food labs favor generators that ensure a continuous gas supply around the clock during contaminant surveillance. Pharmaceutical QC labs prioritize uptime and regulatory compliance, resulting in the adoption of predictive-maintenance platforms that extend service intervals to 12 months. Academic budgets are tight, yet modular generators shared across departments improve capital utilization. Environmental and forensic labs form a smaller tail but still require high-purity gases for VOC or toxicology assays, supporting broad demand diversity.
Geography Analysis
North America Laboratory Gas Generators Market
North America accounted for 36.26% of 2025 revenue, primarily driven by CHIPS incentives that fund nitrogen infrastructure for new semiconductor fabs requiring flows exceeding 50,000 m³ h⁻¹. TSMC’s USD 65 billion Arizona complex features multiple PSA trains that replace cylinder logistics, resulting in a 40% reduction in Scope 1 carbon emissions. Pharmaceutical hubs in Massachusetts and California installed more than 200 LC-MS units in 2025, each drawing up to 25 L min⁻¹ of nitrogen, further bolstering generator uptake. Canada leverages National Research Council grants, while Mexico’s near-shoring boom raises food-safety testing needs that require zero-air and hydrogen units.
APAC Laboratory Gas Generators Market
Asia-Pacific will post a 9.01% CAGR through 2031, led by Shimadzu’s Suzhou expansion for biopharma instruments and Thermo Fisher’s new analytical factories in India. China’s USD 40 billion in pharmaceutical R&D in 2024 drove double-digit LC-MS installations, while domestic PSA vendors undercut imports by 30% on price. South Korea’s fabs operated by Samsung adopt redundant PSA systems to guarantee five-nines uptime. India’s tier-2 cities install generators to meet the Food Safety and Standards Authority's requirements, thereby bypassing fragile cylinder supply chains.
EMEA, APAC and South America Laboratory Gas Generators Market
Europe’s share slips as ISO 8573 compliance elevates cylinder costs, nudging labs toward on-site generation. The Middle East experiences grid instability, which led to a 220 million-person blackout in Pakistan in 2023; therefore, laboratories pair generators with UPS systems. South American food exporters add hydrogen and zero-air units to comply with pesticide limits in destination markets. African adoption remains nascent; however, South African pharmaceutical producers are beginning to specify PSA nitrogen systems for biosimilar quality control.
Regulatory Landscape
Laboratory gas generators are governed by laboratory electrical-safety and equipment standards, with many systems aligning to IEC 61010-1 and IEC 61010-2-081 for automatic and semi-automatic laboratory equipment; equipment intended for in vitro diagnostic (IVD) examination is also associated with IEC 61010-2-101. In North America, equivalent national adoptions such as UL 61010-2-081 are used in product safety and certification workflows, shaping design controls around electrical safety, temperature, pressure, and automated functions.
Regulatory obligations can also shift based on intended use and claims. In the United States, a gas generating device for microbiological use is listed under 21 CFR 866.2580 as Class I (product code KZJ) and may be exempt from 510(k) subject to limitations, while medical gas manufacturing and handling are covered under CGMP in 21 CFR Part 213. In Europe, the European Commission guidance on borderline and classification under MDR/IVDR reinforces that classification depends on intended clinical purpose, and gases (and related systems) can fall under MDR 2017/745 when marketed for medical use, raising the bar on documentation and conformity assessment compared with general laboratory equipment.
Competitive Landscape
The laboratory gas generators market is moderately fragmented. Global industrial-gas majors Linde and Air Products leverage their on-site gas expertise to penetrate the laboratory segment. Linde’s Q3 2024 revenue reached USD 8.35 billion, and the firm partnered with Samsung on clean hydrogen projects that include laboratory-scale PEM models. Air Products reported USD 2.9 billion in Q4 2024 revenue and allocated USD 9 billion for a Texas clean hydrogen venture that informs its generator product lines. Peak Scientific, Parker Hannifin, and Atlas Copco specialize in application-specific systems and maintain regional service teams for rapid support.
Nel ASA reported NOK 381 million (USD 35 million) revenue in Q3 2024 and secured USD 10 million in DOE funding for a 250 kW PEM prototype, positioning it for research and academic installations. Peak Scientific’s GENIUS XE features IoT diagnostics that reduce downtime by 28%, a valuable asset in nonstop QC labs. Parker’s ChromGas portfolio offers 99.9995% hydrogen purity via palladium membranes, enabling the detection of trace impurities. Atlas Copco now sells OGP+ oxygen generators to pharmaceutical water systems, leveraging its expertise in compressors.
Chinese PSA vendors offer 30% price discounts but struggle with validation documentation and service reach, limiting penetration in regulated pharma and semiconductor accounts. White-space growth is clearest in modular skid-mounted solutions for multi-site contract research organizations that require centralized monitoring across dispersed labs. Predictive maintenance, catalyst lifecycle management, and energy efficiency remain primary axes of competition.
Laboratory Gas Generators Industry Leaders
-
Parker-Hannifin Corporation
-
Peak Scientific Instruments, Ltd.
-
Linde Plc (Praxair Technology Inc.)
-
Valco Instruments Company, Inc (VICI DBS SRL)
-
Claind S.r.l.
- *Disclaimer: Major Players sorted in no particular order
Laboratory Gas Generators Market Companies Covered in this Report
- Air Products & Chemicals Inc.
- Angstrom Advanced
- Atlas Copco
- Claind
- ErreDue
- F-DGSi
- Generon LLC
- Isolcell
- LabTech S.R.L.
- Linde plc (Praxair Technology Inc.)
- LNI Swissgas
- MVS Engineering
- Nel
- On Site Gas Systems Inc.
- Oxymat
- Parker Hannifin
- PCI Gases
- Peak Scientific Instruments
- South-Tek Systems
- Valco Instruments Company
Market Opportunities and Future Outlook
Cylinder-to-generator substitution reduces recurring cylinder handling burdens and supply-chain risk, with OSHA 1910.101 highlighted as a benchmark for cylinder management in the market context. Helium price pressures persist, with prices observed above USD 14 per m3 in 2025, reinforcing the case for on-site nitrogen generation for high-throughput LC-MS workflows and adjacent applications that require continuous flows up to 25 L min-1 per LC-MS platform. The software-enabled, connected diagnostics trend supports service models that minimize lab downtime and extend maintenance intervals. Product and portfolio activity in 2026 shows a shift toward higher-efficiency, lower-noise, and digitally monitored systems for mass spectrometry and chromatography environments. The Peak Scientific Genius NEO nitrogen generator launch at ASMS 2026 anchors investment in performance and sustainability features that align with lab procurement criteria beyond gas cost. A parallel opportunity sits in hydrogen carrier-gas generation for GC and GC-MS labs as they pursue supply resilience, especially where modular, stackable footprints and optional remote monitoring reduce retrofit friction in space-constrained laboratories.
Recent Industry Developments in Laboratory Gas Generators Market
- July 2026: Parker Hannifin announced the ChromGas H2C hydrogen generator for gas chromatography applications, highlighting a stackable form factor, advanced controls, and options for remote monitoring. The release strengthens competition around modular hydrogen platforms as chromatography labs standardize on on-site carrier-gas generation to reduce reliance on delivered cylinders.
- June 2026: Peak Scientific launched the Genius NEO laboratory nitrogen gas generator and showcased it at ASMS 2026 in San Diego with emphasis on enhanced purity, lower noise, and improved energy efficiency. The launch signals ongoing product refresh cycles targeting LC-MS-centric labs where uptime and operating costs increasingly drive generator selection.
- June 2024: Peak Scientific introduced the Solaris 1010A nitrogen generator designed for ELSD and compact mass spectrometer applications, integrating a built-in air compressor. This integrated design supports smaller labs and decentralized instrument clusters that want simpler installation and fewer external utilities.
Laboratory Gas Generators Market Report Scope and Research Methodology
Market Definition and Coverage
For this study, the market counts revenue generated from laboratory gas generator systems that produce purified gases on site for lab instruments and workflows, including the associated equipment sold as part of the generator system.
Scope exclusions: Bulk and packaged industrial gas supply (cylinders, dewars, and pipeline gas delivery) is excluded from the market totals.
Segments Covered in This Report
- By Gas Type
- Nitrogen Gas Generators
- Hydrogen Gas Generators
- Zero-Air Generators
- TOC/Oxygen & Other Gas Generators
- By Application
- Gas Chromatography
- LC-MS
- GC-MS
- Gas Analyzers & Spectroscopy
- By Technology
- Pressure-Swing Adsorption (PSA)
- Membrane Separation
- Electrolytic (PEM / Alkaline)
- Catalytic Reforming & Others
- By End User
- Pharmaceutical & Biotechnology Companies
- Food & Beverage Companies
- Academic & Research Institutes
- Other End Users
- By Geography
- North America
- United States
- Canada
- Mexico
- Europe
- Germany
- United Kingdom
- France
- Italy
- Spain
- Rest of Europe
- Asia-Pacific
- China
- Japan
- India
- Australia
- South Korea
- Rest of Asia-Pacific
- Middle East & Africa
- GCC
- South Africa
- Rest of Middle East & Africa
- South America
- Brazil
- Argentina
- Rest of South America
- North America
Data Sources, Market Sizing, and Validation
Desk Research
Desk research started with mapping where lab gas generators are used and what drives replenishment and new installations, before we built the country and regional demand pool. Public sources were used to anchor model inputs, including US FDA and EMA updates tied to regulated labs, OECD and World Bank indicators for R and D intensity, and UN Comtrade trade codes used to sense import patterns for related equipment.
We also referenced peer reviewed journals for chromatography and mass spectrometry usage patterns, plus university and national lab procurement notes that can indicate generator adoption. We reviewed association and standards body material focused on lab safety and gas handling. Company filings, annual reports, and investor decks were used to extract product mix signals, geographic exposure, and channel structure, which were then compared against a paid subscription used for company financials and a patent database to understand technology direction. The desk sources listed here are not exhaustive, and many other public and subscription sources were reviewed to collect data, validate assumptions, and clarify open questions.
Primary Interviews and Surveys
Primary work focused on cross checking adoption, pricing movement, and replacement cycles for nitrogen, hydrogen, and zero air generators across common lab settings. We spoke with a mix of equipment makers, distributors, lab managers, and instrument users so assumptions such as average selling price bands and service attachment could be corrected when they did not match observed buying behavior. For a global view, coverage was balanced across mature lab markets and faster growing install bases, so regional splits remained realistic.
Distribution of primary research fieldwork respondents
| Company type | Respondent position | Region |
|---|---|---|
| Top tier: 27% | CXOs: 12% | APAC: 47% |
| Mid tier: 53% | Functional/Unit leaders: 34% | EMEA: 31% |
| Smaller Players: 20% | Managers: 54% | Americas: 22% |
Market-Sizing & Forecasting
Sizing was built using a top down demand pool, where the installed base of relevant analytical instruments and lab sites by country is reconstructed and then filtered through typical generator penetration for each gas need. The totals were then checked using selective bottom-up approximations, including sampled price per unit by generator type and channel checks on annual unit volumes, which helped reduce noise in smaller countries.
Key inputs used in the model included the installed base growth for GC, GC-MS, and LC-MS platforms, average generator replacement cycles and service life, average selling price ranges by gas type and purity class, and the share of labs shifting from cylinders to on-site generation because of handling and uptime needs. We tracked regional R and D spending direction, pharma and biotech lab capacity additions, and import signals for lab equipment as practical indicators of where demand tends to shift first.
For forecasting, scenario analysis was used so the model could reflect how adoption changes under different assumptions for instrument placements, lab funding, and price progression. Where country data was thin, gaps were handled by borrowing ratios from similar markets (based on lab intensity and instrument mix), and then confirming those ratios with interviews before they were applied.
Data Validation & Update Cycle
Validation was done through multi-step checks that compare modeled results against independent signals such as instrument shipment direction, lab spending indicators, and observed price bands from channel feedback. When a country result appeared too high or too low, the assumptions were rechecked and follow-up calls were triggered to confirm what changed, including procurement slowdowns or a faster shift to on-site generation.
Before sign-off, the model and the written insights go through peer review so calculation logic, conversions, and year alignment stay consistent across regions. Reports are refreshed annually, with interim updates added when material events occur, followed by a final pre-delivery review so clients receive the latest updated view.
Mordor Intelligence's Laboratory Gas Generators Market Size Compared Against Other Published Estimates
Published market sizes for laboratory gas generators can differ widely because the counted revenue stream is not always the same, and because base years and exchange rate timing vary across publishers. Additional spread can come from how much each model relies on shipment proxies versus end-user spending patterns.
Gas cylinder and bulk gas delivery revenues sit outside Mordor Intelligence's scope, which is why some broader laboratory gas numbers can come out higher even when they cite similar end users. Differences also stem from how pricing is treated over time, since some estimates assume faster ASP inflation across all generator types. Adoption timing assumptions also affect outputs, particularly the pace at which demand moves from regulated pharma labs into academic and industrial labs in APAC and EMEA.
Benchmark comparison
| Source | Market Size | Gaps in Research Methodology |
|---|---|---|
| Mordor Intelligence | USD 567.34 M (2026) | |
| Global Consultancy A | USD 448.60 M (2023) | Uses an earlier base year and a different forecast window, and the scope emphasis can lean toward on-site generation tied to select lab applications, which can shift the mix of generator types and ASP assumptions. |
| Industry Research Publisher B | USD 465.98 M (2025) | Starts from a 2025 base with a longer horizon to 2035, and the growth path appears to assume quicker penetration gains and higher price progression, which lifts the modeled trajectory versus shorter-cycle demand checks. |
The comparison shows that year alignment and what revenue streams are counted drive most of the spread, followed by how fast adoption and pricing are assumed to move. By keeping the scope tied to on-site generator system revenue and checking outputs against practical demand indicators, the final number stays traceable to clear inputs that can be revisited each refresh cycle.
Key Questions Answered in the Report
How large is the laboratory gas generators market in 2026?
The laboratory gas generators market size stands at USD 567.34 million in 2026 and is projected to reach USD 781.73 million by 2031.
Which gas type is growing fastest?
Hydrogen generators are expanding at a 7.86% CAGR to 2031 as laboratories replace helium carrier gas.
Why are semiconductor fabs important to demand?
New fabs funded under the CHIPS Act consume nitrogen flows exceeding 50,000 m³ h⁻¹, anchoring large PSA installations.
What is driving GC-MS adoption?
Pharmaceutical impurity regulations and food-safety mandates are driving the installation of GC-MS systems, which require continuous hydrogen and zero-air supply.
Which region will grow the quickest?
Asia-Pacific will advance at a 9.01% CAGR through 2031, propelled by pharmaceutical R&D and semiconductor expansion.