
Label-free Array Systems Market Size and Share
Market Overview
| Study Period | 2020 - 2031 |
|---|---|
| Market Size (2026) | USD 610.33 Million |
| Market Size (2031) | USD 874.12 Million |
| Growth Rate (2026 - 2031) | 7.44 % |
| Fastest Growing Market | Asia Pacific |
| Largest Market | North America |
| Market Concentration | Medium |
Major Players *Disclaimer: Major Players sorted in no particular order Image © Mordor Intelligence. Reuse requires attribution under CC BY 4.0. | |
Label-free Array Systems Market Analysis by Mordor Intelligence
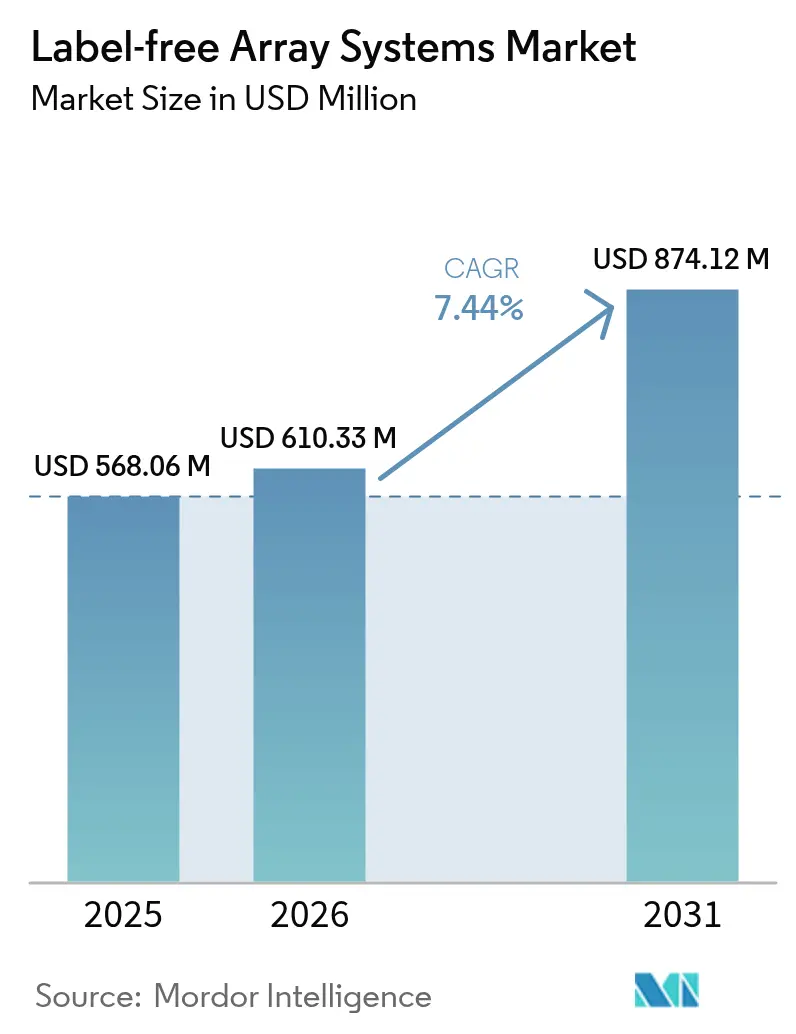
The label-free array systems market size is expected to grow from USD 568.06 million in 2025 to USD 610.33 million in 2026 and is forecast to reach USD 874.12 million by 2031 at 7.44% CAGR over 2026-2031. Escalating pharmaceutical R&D budgets, rising demand for real-time kinetic data, and the migration toward complex biologics are solidifying the technology’s role across discovery and development programs. Major sponsors now embed label-free detection early in hit-to-lead cascades to shorten project timelines and improve candidates’ success rates. Consolidation among instrument vendors, coupled with AI-enhanced analytics, is accelerating platform upgrades and lowering data-analysis barriers. Meanwhile, regional funding initiatives in North America, the European Union, China, and India are creating a fertile environment for new applications extending into point-of-care diagnostics and cell-therapy manufacturing. Persistent challenges—chiefly high capital outlays for flagship SPR and BLI platforms and a shortage of trained nano-optics personnel—continue to temper adoption in price-sensitive segments, yet shared-facility models and leasing schemes are starting to offset cost hurdles.
Key Report Takeaways
- By technology, Surface Plasmon Resonance led with 41.02% revenue share in 2025, whereas Localised Surface Plasmon Resonance is projected to expand at a 9.56% CAGR to 2031.
- By application, drug discovery accounted for 38.11% of the label-free array systems market share in 2025, while protein complex & cascade analysis advances at a 9.72% CAGR through 2031.
- By end user, pharmaceutical & biotechnology companies held 49.12% share of the label-free array systems market size in 2025; contract research organizations record the highest projected 10.18% CAGR to 2031.
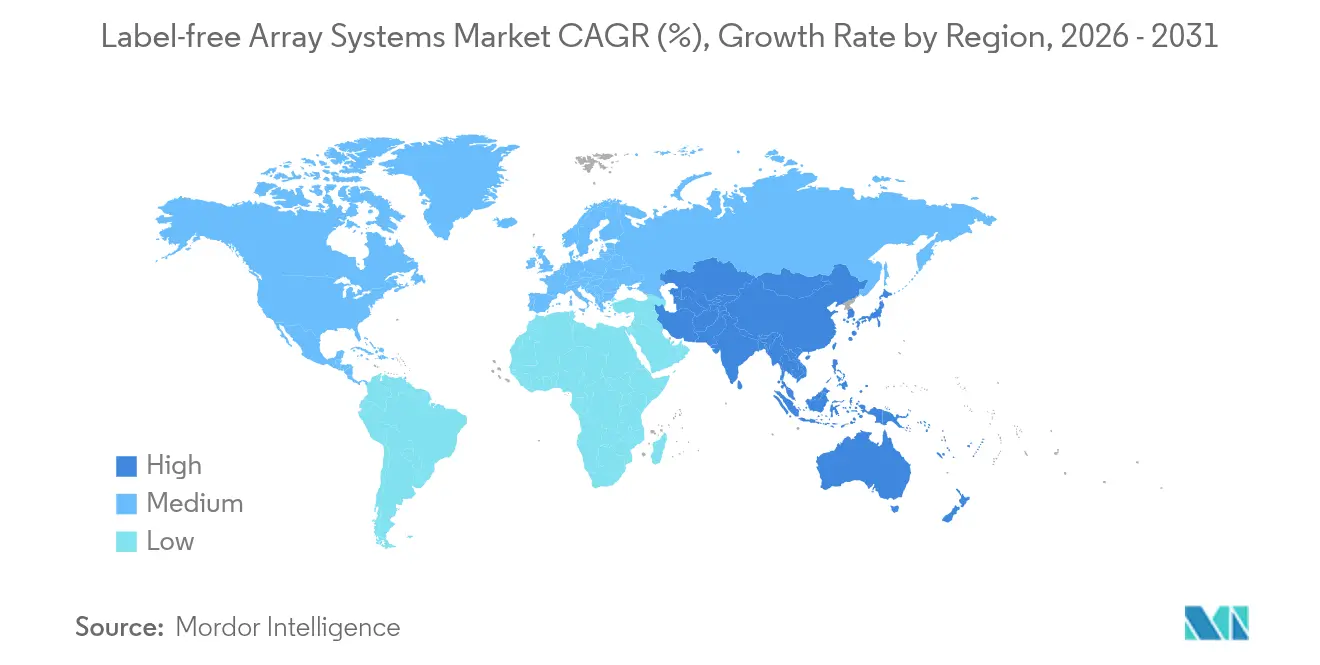
- By geography, North America commanded 44.09% of 2025 revenues, whereas Asia-Pacific is set to post an 8.51% CAGR over the forecast horizon.
Note: Market size and forecast figures in this report are generated using Mordor Intelligence’s proprietary estimation framework, updated with the latest available data and insights as of 2026.
Global Label-free Array Systems Market Trends and Insights
Drivers Impact Analysis*
| Driver | % Impact on CAGR Forecast | Geographic Relevance | Impact Timeline |
|---|---|---|---|
| Advantages Over Labeled Detection Techniques | +1.8% | Global – strongest uptake in North America & Europe | Medium term (2-4 years) |
| Increase in R&D Spending by Pharma & Biotech Firms | +2.1% | Global – concentrated in North America, Europe, China | Short term (≤2 years) |
| Rapid Technology Upgrades in SPR, BLI & CDS Platforms | +1.5% | North America & Europe, expanding to Asia-Pacific | Medium term (2-4 years) |
| Integration of AI Analytics with High-Throughput Label-Free Screens | +1.2% | Global – led by North America and select Asia-Pacific markets | Long term (≥4 years) |
| Adoption in Personalised-Medicine & Cell-Therapy Manufacturing | +0.9% | North America & Europe, emerging in China & Japan | Long term (≥4 years) |
| Nano-Plasmonic & Metasurface Miniaturisation for POC Diagnostics | +0.7% | Global – early adoption in developed markets | Long term (≥4 years) |
| Source: Mordor Intelligence | |||
Advantages over Labeled Detection Techniques
Label-free methods eliminate fluorescent or radioactive tags, thereby preventing steric hindrance and signal quenching that often distort binding kinetics[1]. Hit rates jump when fragment-based campaigns capitalize on unmodified ligands, as demonstrated by 12.4% primary hits with 92% crystallographic confirmation. Because no secondary reagents are required, assay development time drops 40-60%, freeing medicinal-chemistry teams to iterate rapidly. Stanford University’s SENSBIT platform further highlights durability gains by maintaining 70% signal after one month in serum against 11-hour lifespans for conventional sensors. Collectively, these performance premiums underpin the label-free array systems market’s swift pivot away from legacy labeled assays.
Increase in R&D Spending by Pharma & Biotech Firms
Global pharmaceutical R&D outlays reached USD 288 billion in 2024, up 1.5% year-on-year, and sizeable fractions are earmarked for advanced analytical platforms. Merck alone channelled USD 17.9 billion into discovery programs, explicitly prioritizing label-free screening capacity. As therapeutics portfolios tilt toward multispecific antibodies, gene editors, and cell therapies, high-content kinetic datasets become mission-critical for regulatory dossiers. Daiichi Sankyo’s robotics-enabled San Diego laboratory illustrates this shift, integrating automation and AI-driven label-free analytics to compress bench-to-IND timelines. The resulting uplift in Phase 1 success rates—from 60-70% with traditional screens to 80-90% on AI-paired label-free platforms—reinforces executive commitment to sustained investment.
Rapid Technology Upgrades in SPR, BLI & CDS Platforms
Instrument manufacturers are racing to out-innovate one another on sensitivity, throughput, and ease of use. Sartorius released the Octet R8e in May 2024, doubling sample capacity while boosting data fidelity for low-affinity interactions. Bruker, fresh off its Sierra Sensors acquisition, launched the 32-channel Sierra SPR-32 Pro, driving consolidated revenue to USD 795-800 million in Q1 2025[2]. Cellular dielectric spectroscopy systems now deliver label-free, non-invasive cell-quality metrics indispensable for GMP-compliant cell-therapy production. Meanwhile, microfluidic integration is shrinking complete workflows onto disposable chips, mitigating contamination risk and enabling single-use bioprocessing strategies.
Integration of AI Analytics with High-Throughput Label-Free Screens
Deep-learning models such as PAIRWISE from Weill Cornell Medicine and AstraZeneca predict efficacious drug combinations directly from label-free kinetic fingerprints, boasting 95% hit-prediction accuracy. Machine learning also prescribes optimal compound concentrations and flags anomalous curves before costly wet-lab follow-up. Charles River now embeds AI clustering across 1.4 million compounds, accelerating structure–activity insight for clients. Yet data-standardization gaps and talent shortages in chem-informatics limit widespread rollout, sustaining a long-term but gradual CAGR impact.
Restraints Impact Analysis*
| Restraints Impact Analysis | (~) % Impact on CAGR Forecast | Geographic Relevance | Impact Timeline |
|---|---|---|---|
| High Capital Cost of Instrumentation | -1.4% | Global – most acute in emerging markets & small enterprises | Short term (≤2 years) |
| Limited User-Side Awareness & Training | -0.8% | Emerging markets in Asia-Pacific, Latin America, parts of Europe | Medium term (2-4 years) |
| Data-Integration & Standardisation Hurdles for Phenotypic Assays | -0.6% | Global | Medium term (2-4 years) |
| Shortage of Nano-Optics Fabrication Talent | -0.5% | North America, Europe, and Asia-Pacific photonics hubs | Long term (≥4 years) |
| Source: Mordor Intelligence | |||
High Capital Cost of Instrumentation
Premium SPR systems list between USD 200,000 and USD 500,000, while fully featured BLI rigs exceed USD 300,000 before service contracts. Semiconductor labor shortages that could require 67,000 additional U.S. engineers by 2030 inflate optics-component prices. Export restrictions on gallium and germanium have lengthened lead times, and 75% of photonics manufacturers report hiring challenges. Consequently, smaller biotechs and academic centers defer purchases, nudging them toward shared-core facilities or vendor-financed leasing programs that spread cost over multi-year horizons.
Limited User-Side Awareness & Training
Mastering surface plasmon resonance or bio-layer interferometry can require weeks of hands-on instruction, which many fast-moving startups cannot spare. Asia-Pacific’s sprinting R&D growth has outpaced the region’s training pipeline, leaving gaps in experimental design and data interpretation. Universities rarely include label-free methodologies in core curricula, constraining entry-level talent pools. Japan’s JST initiative now funds workforce programs in multiplex sensing technologies to counteract skill shortages[3], yet near-term awareness remains uneven, restraining the label-free array systems market’s penetration rate in developing clusters.
*Our forecasts treat driver/restraint impacts as directional, not additive. The impact forecasts reflect baseline growth, mix effects, and variable interactions.
Segment Analysis
By Technology: SPR Dominance Faces LSPR Innovation
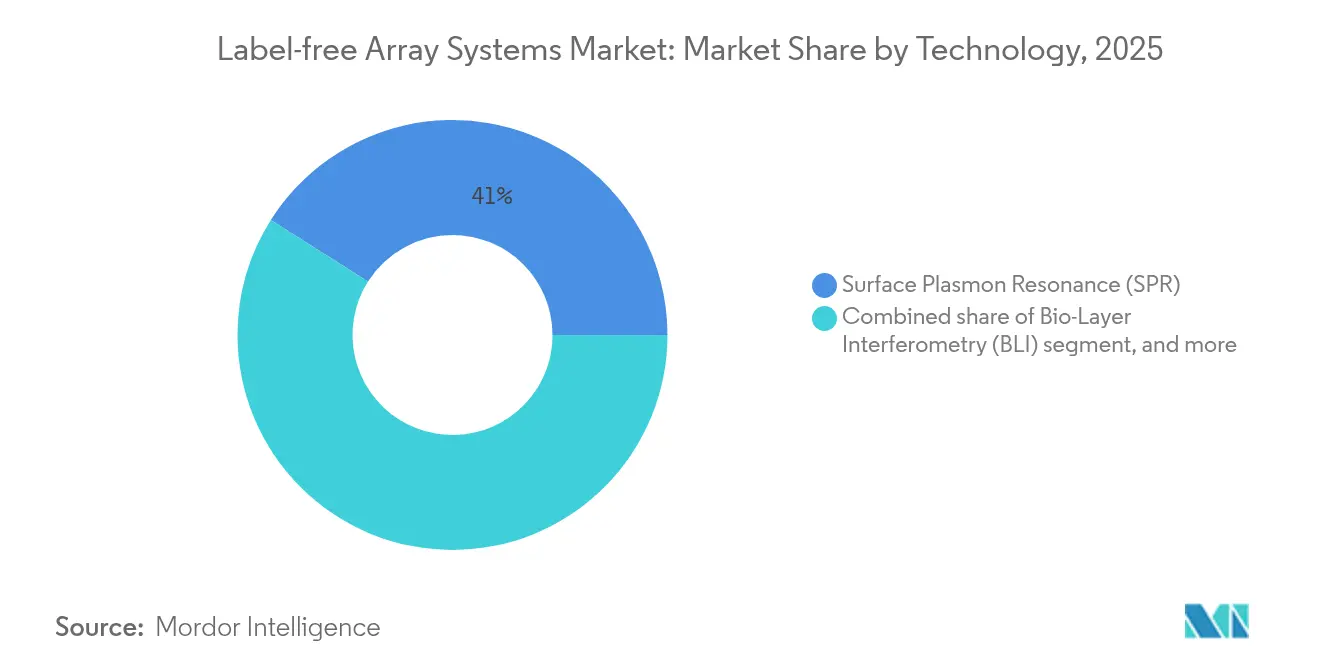
Surface Plasmon Resonance contributed 41.02% of 2025 revenue, making it the largest slice of the label-free array systems market. Vendors sustain leadership by pushing sub-nanomolar detection limits and adding multiplex cartridges that measure up to 32 interactions concurrently. The label-free array systems market size attributed to SPR platforms is expected to rise steadily at the overall industry CAGR as pharma customers modernize aging instruments. Localised SPR, however, promises the fastest growth at a 9.56% CAGR because nano-plasmonic metasurfaces deliver superior small-molecule sensitivity and suit portable diagnostics.
National Taiwan University’s pH-responsive DNA nanoswitches achieved 0.57 pM microRNA limits of detection, nudging LSPR closer to clinic-ready assays. Parallel advances in whispering-gallery-mode microlasers offer amplified evanescent fields suited to early cancer biomarker panels. The competition is spurring incumbents to incorporate nano-fabricated chips into next-gen SPR lines, blurring boundaries between bulk-optic SPR and chip-based LSPR. As price differentials narrow, procurement decisions will hinge on throughput, service footprint, and AI-analytics plug-ins rather than on raw sensitivity alone.

By Application: Drug Discovery Leads Complex Analysis Growth
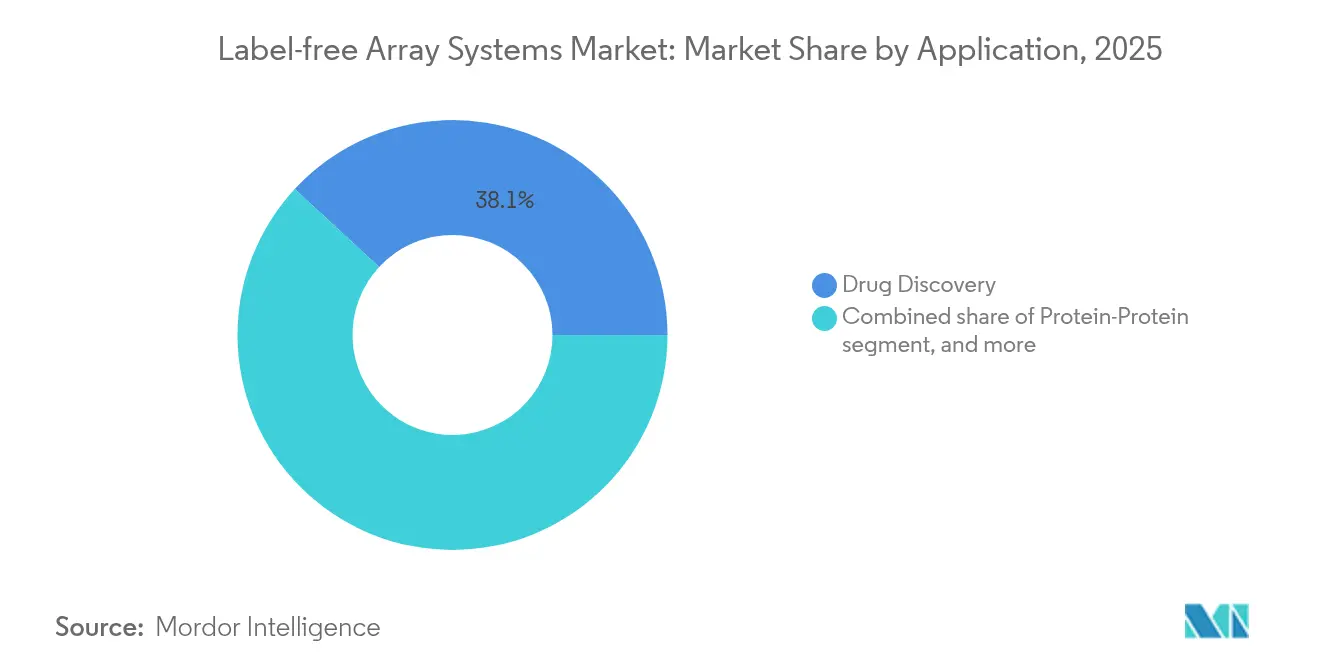
Drug discovery retained 38.11% share in 2025, anchoring the label-free array systems market. Platform vendors have optimized fragment-screening workflows, enabling medicinal chemists to probe weak interactions crucial for PROTAC or molecular-glue campaigns. The label-free array systems market size for drug discovery will remain sizable even as downstream manufacturing applications rise. By contrast, protein complex & cascade analysis is projected to expand at 9.72% CAGR as multi-target and pathway-centric therapeutics demand systems-level kinetic insight.
Lawrence Livermore National Laboratory’s one-pot cell-free synthesis and fluorescence-correlation approach compresses protein expression and binding assays into hours, reinforcing the modality’s appeal for network pharmacology. High-throughput platforms like SAMDI-ASMS now screen millions of compounds label-free, underscoring scalability. As regulators scrutinize mechanism-of-action evidence for novel modalities, demand for cascade-level kinetics will keep this sub-segment on a faster trajectory than legacy single-target screens.
By End User: Pharma Dominance Meets CRO Expansion
Pharmaceutical & biotechnology firms controlled 49.12% of 2025 revenue, reflecting their historical ownership of in-house screening infrastructure. The label-free array systems market share remains high because big pharma budgets absorb multimillion-dollar capital cycles without jeopardizing cash flow. However, CROs are poised for 10.18% CAGR as outsourcing strategies widen.
Charles River’s expansion to 1.4 million curated compounds positions its service arm to capture discovery projects from resource-constrained innovators. CN Bio and Pharmaron’s organ-on-a-chip alliance illustrates how specialty CROs differentiate on emerging assays that integrate label-free detection with micro-physiological models. Academic cores still matter for basic research, yet grant-driven budgets limit their scale-up pace, ensuring that commercial CRO capacity will absorb the incremental demand through 2030.
Geography Analysis
North America led the label-free array systems market with a 44.09% revenue share in 2025, supported by deep capital pools, FDA-aligned validation pathways, and Thermo Fisher’s USD 2 billion domestic expansion plan. U.S. semiconductor and photonics ecosystems, despite skilled-labor shortages, continue to supply critical optics faster than any other region, reducing downtime for instrument upgrades. Capital-intensive biopharma clusters in Boston-Cambridge, the San Francisco Bay Area, and the Raleigh–Durham corridor collectively anchor over 40% of North American label-free install base units.
Asia-Pacific is the fastest-growing territory at an 8.51% CAGR thanks to China’s precision-medicine boom, which topped 2,400 billion yuan in 2023 and is rising 12% annually. India’s 2024 BioE3 policy designates biomanufacturing as a strategic pillar, while Japan’s JST program seeks a USD 1 trillion multiplex-sensing prize. Shimadzu’s new Karnataka factory, due 2027, will localize chromatograph and mass-spec production, trimming import dependencies. Regional growth is further bolstered by biotech parks in Shanghai’s Zhangjiang and Hyderabad’s Genome Valley that offer subsidized core-facility access to start-ups.
Europe holds a meaningful footprint, buoyed by Germany, the United Kingdom, and Switzerland’s legacy pharma majors. Waters Corporation’s new 45,000 sq ft UK machining center triples local capacity for MS components, improving resilience against supply-chain shocks. Nonetheless, industry groups advocate a “Chips Act 2.0” to protect photonics competitiveness as U.S. and Chinese incentives lure wafer-fab investments abroad. Horizon Europe grants and European Innovation Council funds continue to seed university–industry consortia that pilot label-free microfluidic prototypes for decentralized testing.
Regulatory Landscape
Label-free array systems are regulated primarily as medical devices and, when used for clinical testing, as in vitro diagnostic (IVD) devices. In the United States, the FDA Center for Devices and Radiological Health (CDRH) applies risk-based classification and pathway requirements under the FD&C Act, and IVDs must also meet FDA device labeling requirements where applicable. In Europe, market access depends on conformity assessment and CE marking under the Medical Device Regulation (EU) 2017/745 and, for IVD configurations, the In Vitro Diagnostic Regulation (EU) 2017/746, which raises expectations for performance evaluation and technical documentation.
Global commercialization strategies increasingly reference harmonized labeling and documentation frameworks, including ISO 18113-1:2022 for IVD labeling and IMDRF guidance on labeling principles. A notable 2026 signal on the US side is FDA action in March 2026 reclassifying certain optical diagnostic devices and electrical impedance spectrometers from Class III to Class II with special controls, clarifying a lower-burden pathway for some label-free sensing modalities when they align to defined safety and effectiveness controls. In May 2026, FDA also classified certain nucleic-acid and resistance-marker detection devices for suspected orthopedic infection into Class II with special controls, reinforcing the role of special-controls-based frameworks in shaping evidence and documentation requirements for novel diagnostic platforms.
Competitive Landscape
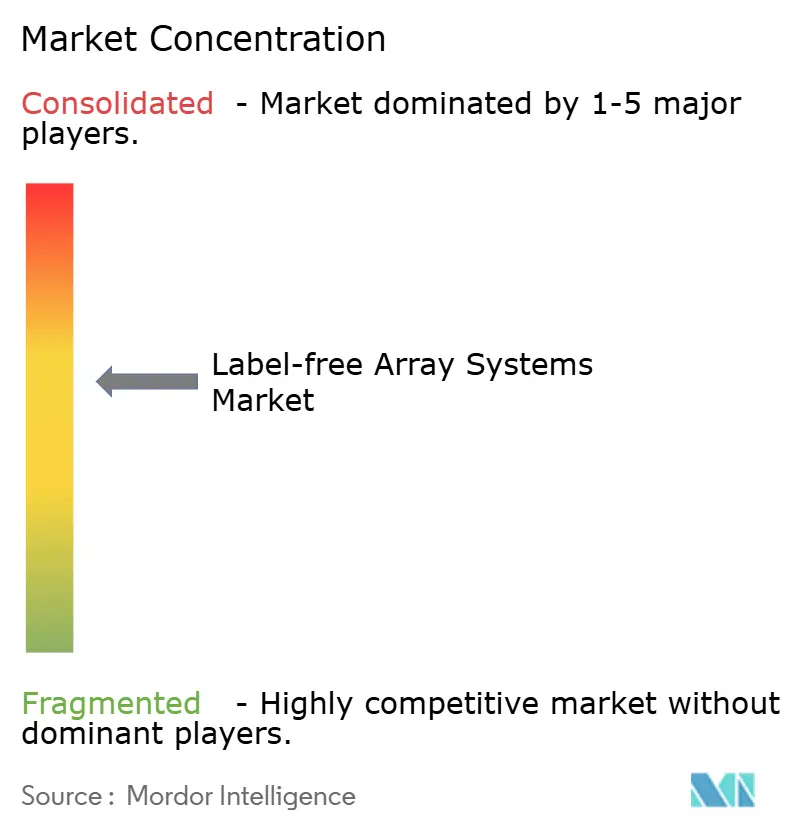
Global competition is moderate; the top five suppliers collectively account for an estimated 55-60% of 2024 revenue, with Danaher (Molecular Devices/ForteBio), Bruker, Thermo Fisher, Sartorius, and Nicoya Lifesciences occupying leading positions. Bruker’s Sierra acquisition and rapid SPR portfolio refresh intensified rivalry, as evidenced by 10% year-on-year instrument revenue growth. Danaher leverages its global sales network and service contracts to lock in recurring consumables income, while Sartorius integrates BLI readouts into broader bioprocess suites.
Emergent firms focus on niche differentiation: Gator Bio deploys long-lifetime probes to cut consumable costs; Fox Biosystems offers fiber-optic interferometry for crude-sample compatibility; and Nicoya’s Alto uses digital micro-fluidics to miniaturize reagent volumes. AI partnerships are increasingly common: Thermo Fisher embeds cloud-based machine learning for anomaly detection; Quanterix’s planned Akoya acquisition adds multiplex imaging that can feed kinetic data back into in-silico models. Patent filings reveal heightened activity in metasurface fabrication and neural-network-assisted curve fitting, underscoring a shift toward integrated hardware-software value.
Strategic collaborations with CROs, reagent suppliers, and diagnostics start-ups round out competitive tactics. King’s College London’s nanoneedle patch prototype, developed with industrial backing, exemplifies cross-disciplinary ventures that open new clinical frontiers. Vendors also cultivate reagent ecosystems—pre-functionalized sensor chips, validated protein standards—to simplify experiment set-up and lock users into proprietary consumable streams. Taken together, technology leaps, M&A plays, and software ecosystems will continue reshaping market power dynamics through 2030.
Label-free Array Systems Industry Leaders
-
Corning Incorporated
-
Danaher Corporation
-
GE Healthcare
-
Perkin Elmer Inc.
-
Thermo Fisher Scientific, Inc.
- *Disclaimer: Major Players sorted in no particular order
Market Opportunities and Future Outlook
Point-of-care and decentralized testing remains a visible whitespace for label-free sensing as research groups demonstrate spectrometer-free and handheld architectures that reduce the accessory burden typical of laboratory SPR/BLI workflows. In May 2026, work on a bound-state-in-the-continuum metasurface sensor fabricated on 8-inch wafers showed an approach for wafer-scale manufacturing and electrical readout without a spectrometer, supporting a route toward lower-cost, higher-volume devices that fit clinical and near-patient environments. February 2026 publications also highlighted handheld, electronic label-free kinetic readouts such as Surface Transmon Resonance (STR) operating at radio frequencies to mitigate Debye screening, which broadens the range of electronics-forward platforms alongside optical incumbents.
Another opportunity is expanding label-free arrays into complex-matrix clinical samples and organ-on-a-chip workflows, where real-time kinetics and matrix tolerance are decisive. Examples in 2026 include SPR interface advances for direct IL-6 detection in human serum using revised analytical parameters and an islet-on-a-chip system paired with label-free optical monitoring of insulin secretion, both of which extend label-free measurement beyond purified reagents into biologically relevant media. These directions align with end-user pull from drug discovery and translational teams looking for earlier mechanism-of-action and cascade-level data without labeling steps, and they create openings for vendors to package analytics, standardized data handling, and validated sample-prep workflows as part of the instrument-consumable ecosystem.
Recent Industry Developments
- May 2026: Cytiva (Danaher) introduced the next-generation Biacore 8S and 8S+ surface plasmon resonance systems, positioning the platform for faster, more automated protein screening at scale. The launch targets throughput-intensive discovery and characterization programs by compressing screening cycles and supporting standardized workflows across larger study designs.
- February 2026: SCIEX (Danaher) announced integration of the Echo MS+ system with the ZenoTOF 8600 mass spectrometer to support high-throughput, label-free analytical measurement with minimal sample preparation and nanoliter-scale volumes. The integration expands label-free screening options in drug discovery where sample scarcity and speed favor workflows that reduce reagent complexity.
- January 2024: Daiichi Sankyo opened a robotics-enabled discovery site in San Diego centered on AI-driven molecular design and automation-enabled experimentation. The facility investment underscores the operational shift toward data-rich, high-throughput discovery stacks where label-free kinetic and interaction readouts can be embedded earlier in the hit-to-lead process.
Research Methodology Framework and Report Scope
Market Definition and Coverage
This market covers revenue generated from label-free array systems used to measure biomolecular interactions without fluorescent or radioactive labels, along with the related consumables and embedded software that are sold as part of the system package.
Scope exclusions: Handheld lateral-flow tests and generic microplate readers are not counted in this market size.
Segmentation Overview
- By Technology
- Surface Plasmon Resonance (SPR)
- Localised Surface Plasmon Resonance (LSPR)
- Bio-Layer Interferometry (BLI)
- Cellular Dielectric Spectroscopy (CDS)
- Other Technologies
- By Application
- Drug Discovery
- Protein-Protein / Interface Analysis
- Antibody Characterisation & Development
- Protein Complex & Cascade Analysis
- Other Applications
- By End User
- Pharmaceutical & Biotechnology Companies
- Contract Research Organisations (CROs)
- Academic & R&D Laboratories
- Other End Users
- Geography
- North America
- United States
- Canada
- Mexico
- Europe
- Germany
- United Kingdom
- France
- Italy
- Spain
- Rest of Europe
- Asia-Pacific
- China
- Japan
- India
- Australia
- South Korea
- Rest of Asia-Pacific
- Middle East & Africa
- GCC
- South Africa
- Rest of Middle East & Africa
- South America
- Brazil
- Argentina
- Rest of South America
- North America
Data Sources, Market Sizing, and Validation
Desk Research
Desk research is used to map the demand pool and to put guardrails around pricing and adoption assumptions for label-free array systems. We refer to public sources such as the US FDA databases (for device and assay context), the US NIH and similar grant databases (for research intensity signals), the World Bank and OECD health and R&D indicators, and trade data portals such as UN Comtrade for relevant instrument and component trade flows.
Along with these, we review annual reports, investor presentations, product brochures, conference proceedings, peer-reviewed papers, and trusted press coverage to understand how platforms are used and how purchasing decisions are made. Where needed, subscription databases are used for company financials, patent landscaping, and shipment-level import or export checks to reduce blind spots. The sources listed above are illustrative, and many other public and paid references were also used for data collection, validation, and clarification.
Primary Interviews and Surveys
Primary work is used to pressure-test what we built from public data, especially on typical system ASP ranges, replacement cycles, consumables pull-through, and the split between academic labs, biopharma, and CRO buying. We spoke with a mix of instrument suppliers, channel partners, core facility users, and procurement or lab leaders across APAC, EMEA, and the Americas so we could adjust assumptions before finalizing totals.
Distribution of primary research fieldwork respondents
| Company type | Respondent position | Region |
|---|---|---|
| Top tier: 31% | CXOs: 12% | APAC: 42% |
| Mid tier: 55% | Functional/Unit leaders: 32% | EMEA: 34% |
| Smaller Players: 14% | Managers: 56% | Americas: 24% |
Market-Sizing & Forecasting
Our core sizing starts with a top-down build that reconstructs the addressable spend using research and bioprocess activity signals, then applies realistic penetration for label-free interaction analysis within that pool. To keep the output practical, we cross-check with selective bottom-up approximations, such as sampled system ASP multiplied by estimated unit placements, plus a separate consumables and service attachment layer where applicable.
Key inputs used in the model include installed base growth in research labs and biopharma environments, typical instrument replacement cycles, the split of spend between instruments and consumables, pricing movements by throughput class, and funding and publication trends that point to protein interaction and screening intensity. Forecasts are produced using scenario analysis supported by expert views on adoption pace in drug discovery and proteomics workflows, followed by a simple time-series check so the curve does not break from recent observed growth. When bottom-up visibility is weak in smaller countries, we fill gaps using regional analogs tied to R&D spend and lab infrastructure, and then re-validate the implied per-lab spending with interview feedback.
Data Validation & Update Cycle
Validation is done through multiple checks so the final number is not driven by a single data stream. We compare the model output against independent signals such as reported instrument revenue direction, trade flow movement for relevant equipment categories, and whether implied unit volumes look reasonable versus expected installed base additions. Outliers are investigated, assumptions are revisited, and any large variance triggers follow-up outreach to re-check the most sensitive inputs.
Before sign-off, the work goes through step-by-step analyst review, including math checks, unit consistency, and consistency across regions and end-use patterns. The report is refreshed annually, and interim updates are made when material events shift demand or pricing, with a final pre-delivery pass to make sure the latest public information is reflected.
Mordor Intelligence's Label Free Array Systems Market Size Compared Against Other Published Estimates
Published market sizes for label-free array systems can vary even when they appear to track the same topic. The differences usually come from what is counted as part of the system, instrument-only versus instrument plus consumables and embedded software, which year is treated as the starting point, and how quickly ASP and adoption are assumed to move.
Funding and publication momentum in protein interaction work, combined with checks on instrument revenue direction and trade-linked signals for relevant equipment categories, are the evidence points that keep Mordor Intelligence's estimate anchored to system-level spending limited to true label-free array platforms and their packaged attachments. When other estimates bundle adjacent tools, use a different base year, or extend the forecast window with a single smooth growth curve, the market value can shift up or down even if the CAGR appears similar.
Benchmark comparison
| Source | Market Size | Gaps in Research Methodology |
|---|---|---|
| Mordor Intelligence | USD 0.61 B (2026) | |
| Industry Research Publisher A | USD 0.56 B (2025) | Uses a different current-year anchor (2025) and may apply a narrower scope that is closer to instrument revenues, which can understate the full system package when consumables and embedded software are attached. |
| Market Research Publisher B | USD 0.53 B (2024) | Starts from an earlier base year (2024) and runs a longer forecast window, which can shift the reported current size depending on how pricing and adoption are smoothed across years and regions. |
Across the three figures, the spread is mostly explained by time anchoring and by what gets counted around the platform sale. By keeping the scope tied to true label-free array systems and then validating the implied demand with multiple external signals, the model stays transparent and easy to re-check when new information becomes available.
Key Questions Answered in the Report
What is the current size of the label-free array systems market?
The label-free array systems market is valued at USD 610.33 million in 2026 and is forecast to grow to USD 874.12 million by 2031 at a 7.44% CAGR.
Which technology segment leads the market today?
Surface Plasmon Resonance holds the largest share at 41.02% of 2025 revenue, reflecting its widespread use in protein-interaction studies.
What is driving rapid growth in Asia-Pacific?
China’s precision-medicine expansion, India’s BioE3 policy, and Japan’s large-scale sensing programs are generating high demand, pushing the region to an 8.51% CAGR through 2031.
Why are contract research organizations outpacing other end users?
Pharma companies increasingly outsource specialized screening to CROs equipped with advanced label-free platforms, driving a 10.18% CAGR for the segment.
How do label-free platforms reduce drug discovery timelines?
They eliminate labeling steps, provide real-time kinetic data, and integrate with AI analytics, collectively cutting assay development time by up to 60% and improving hit-to-lead efficiency.