
Korea Semiconductor Device Market Size and Share
Market Overview
| Study Period | 2020 - 2031 |
|---|---|
| Forecast Data Period | 2026 - 2031 |
| Base Year Market Size (2025) | USD 33.86 Billion |
| Market Size (2026) | USD 35.7 Billion |
| Market Size (2031) | USD 46.52 Billion |
| Growth Rate (2026 - 2031) | 5.43 % |
| Market Concentration | High |
Major Players *Disclaimer: Major Players sorted in no particular order Image © Mordor Intelligence. Reuse requires attribution under CC BY 4.0. | |
Korea Semiconductor Device Market Analysis by Mordor Intelligence
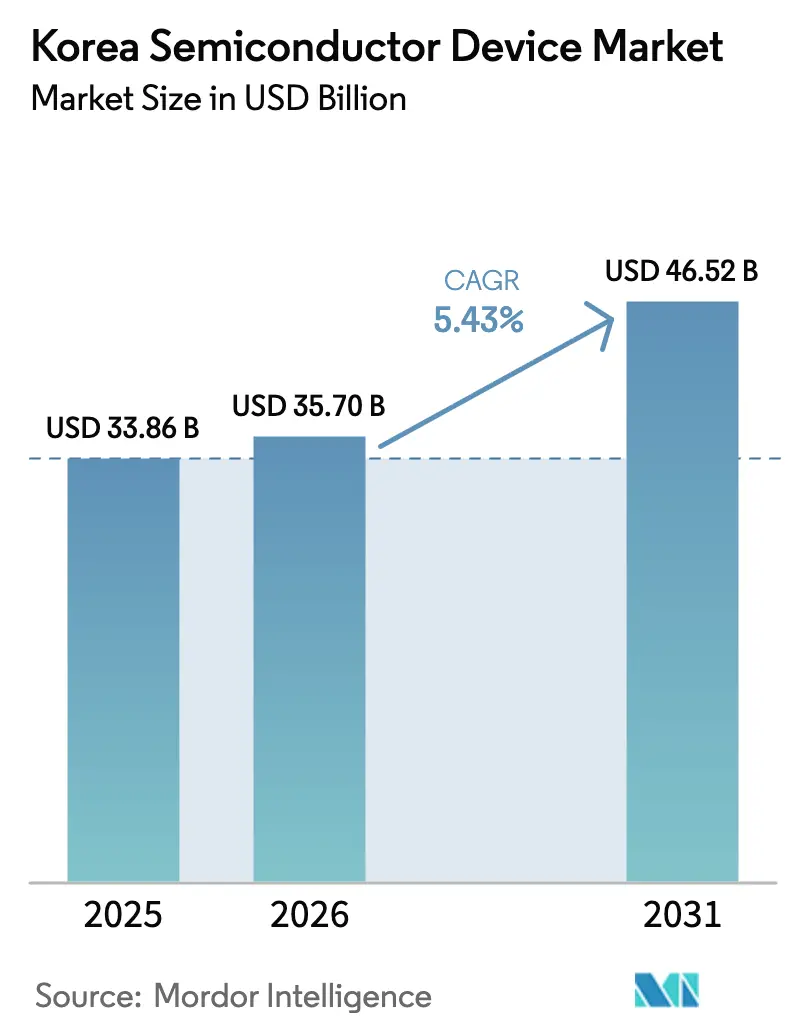
The Korea semiconductor device market size is expected to grow from USD 33.86 billion in 2025 to USD 35.7 billion in 2026 and is forecast to reach USD 46.52 billion by 2031 at 5.43% CAGR over 2026-2031. This expansion underscores the South Korea semiconductor device market as a cornerstone of the country’s export-led economy, with growth anchored by the government’s USD 471 billion “K-Semiconductor Belt” program.[1] Heightened demand for high-bandwidth memory (HBM) in artificial-intelligence computing, Samsung’s roadmap for 2 nm production, and Hyundai–Kia’s push for silicon-carbide power devices converge to reinforce the South Korea semiconductor device market’s resilience and upward trajectory. Premium AI memory is reshaping global pricing power, while design-centric fabless startups capture venture capital and deepen collaboration with domestic foundries. At the same time, surging industrial electricity tariffs, talent shortages in electronic-design-automation roles, and CHIPS-Act guardrails on Chinese assets introduce cost and compliance pressures that stakeholders must navigate.
Key Report Takeaways
- By device type, integrated circuits captured 85.72% of the Korea semiconductor device market share in 2025; discrete devices posted the fastest CAGR at 6.74% through 2031.
- By business model, design and fabless vendors accounted for 67.05% of the Korea semiconductor device market size in 2025, while the same cohort is forecast to post the highest 7.1% CAGR to 2031.
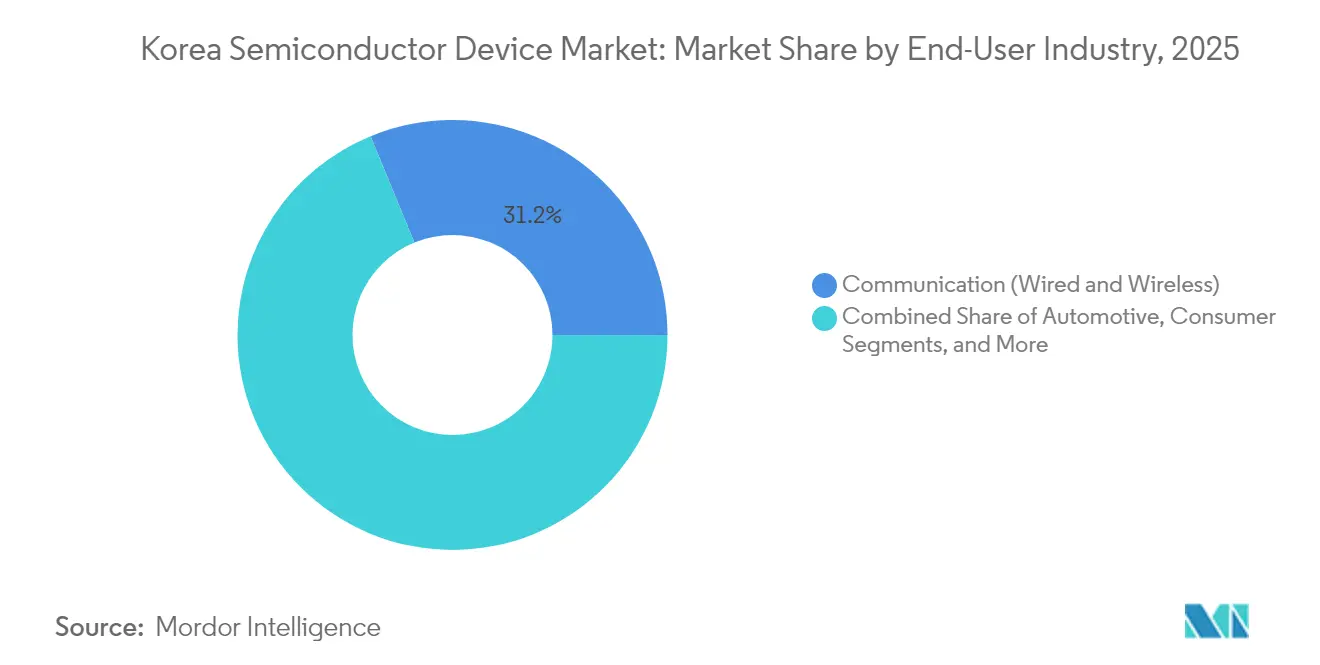
- By end-user industry, communication held 31.22% of the Korea semiconductor device market share in 2025; AI applications are set to expand at a 7.86% CAGR over the forecast window.
Note: Market size and forecast figures in this report are generated using Mordor Intelligence’s proprietary estimation framework, updated with the latest available data and insights as of 2026.
Worldwide, activity is shaped by contributions from multiple countries and regions, with South korea representing one among them. The global report on semiconductor device market by Mordor Intelligence reflects how these countries and regional layers combine into a single system.
Korea Semiconductor Device Market Trends and Insights
Drivers Impact Analysis*
| Driver | (~) % Impact on CAGR Forecast | Geographic Relevance | Impact Timeline |
|---|---|---|---|
| K-Semiconductor Belt Megacluster Investment | +1.2% | National, concentrated in Gyeonggi Province | Long term (≥ 4 years) |
| Hyperscaler Demand for HBM3 Memory Driving Domestic Capacity | +0.9% | Global, with production centered in Korea | Medium term (2-4 years) |
| Samsung 3nm/2nm Roadmap Pulling Advanced EUV Tools into Korea | +0.7% | National, with spillover to regional supply chains | Medium term (2-4 years) |
| EV Strategy of Hyundai–Kia Boosting SiC Power-Device Uptake | +0.4% | National, with export implications | Medium term (2-4 years) |
| Re-shoring incentives amid U.S.-China tech bifurcation are benefiting Korean IDM fabs | +0.6% | Global, particularly the U.S.-Korea corridor | Short term (≤ 2 years) |
| Emergence of AI edge devices in Korea's smart-factory initiatives | +0.3% | National, with an industrial cluster focus | Medium term (2-4 years) |
| Source: Mordor Intelligence | |||
K-Semiconductor Belt Megacluster Investment
The USD 471 billion K-Semiconductor Belt funnels capital into 16 new fabs slated to come online by 2047, with Samsung allocating KRW 360 trillion (USD 260 billion) for six Yongin sites and SK Hynix earmarking KRW 122 trillion (USD 87 billion) for four advanced facilities. Combined monthly capacity is designed to reach 7.7 million wafers by 2030, creating density-driven cost efficiencies and accelerating technology transfer among adjacent facilities. The megacluster’s unified infrastructure for power, water, and logistics eases entry for smaller fabless firms, fostering an ecosystem where innovations ripple quickly across the Korea semiconductor device market. Reshoring incentives from Western customers seeking geographic diversity from Taiwan further bolster utilization prospects, positioning Korea as a prime alternative production hub. Government tax credits of up to 50% on R&D outlays for strategic technologies lower the effective cost of capital, enhancing return profiles on leading-edge tools.
Hyperscaler Demand for HBM3 Memory Driving Domestic Capacity
SK Hynix leveraged HBM3E commercialization to outrun Samsung in global DRAM share, reaching 36% in Q1 2025 as hyperscalers prioritized bandwidth over cost. HBM devices command three to four times the average selling price of conventional DRAM, giving local suppliers revenue upside disproportionate to bit growth. Early sampling of HBM4 to Nvidia in March 2025 underscores close roadmap alignment with AI accelerator lifecycles. A joint development pact with TSMC on advanced stack architectures further secures Korea’s place at the heart of the AI memory chain. As hyperscalers lock in multiyear contracts to secure supply, domestic capex plans are increasingly backstopped by concrete demand signals, reinforcing the upward momentum of the Korea semiconductor device market.
Samsung 3 nm/2 nm Roadmap Pulling Advanced EUV Tools into Korea
Samsung began installing a High-NA EUV lithography tool in late 2024, marking Asia’s first deployment of the next-generation scanner. The move accelerates adoption of backside power-delivery structures slated for the SF2Z 2 nm node in 2027, which promises a 17% cell-area shrink compared with conventional layouts. EUV layer counts will jump 30%, creating pull-through demand for pellicles, photoresists, and precision optics manufactured locally.[2] Samsung’s roadmap aims to quadruple AI and high-performance computing client engagements by 2028, sending a positive signal across the domestic equipment and materials supply chain. This technological gravity cements Korea’s relevance for upstream suppliers, deepening the resilience of the Korea semiconductor device market.
EV Strategy of Hyundai–Kia Boosting SiC Power-Device Uptake
Hyundai Mobis unveiled plans to internalize semiconductor production for traction inverters and lamp-control modules, with an emphasis on silicon-carbide MOSFETs. Automotive semiconductor content in Korean electric vehicles is forecast to triple by 2030, aligning with the government’s 4.5 million zero-emission-vehicle target. Vertical integration allows Hyundai–Kia to tailor devices to platform-specific efficiency requirements, shortening design cycles and enhancing supply assurance. Fabless players specializing in automotive-grade ASICs now benefit from preferential procurement and joint-development agreements, widening participation in the Korean semiconductor device market. Export prospects improve as Korean-branded EVs continue gaining share in Europe and Southeast Asia, increasing overseas pull for domestic power-device fabs.
Restraints Impact Analysis*
| Restraint | (~) % Impact on CAGR Forecast | Geographic Relevance | Impact Timeline |
|---|---|---|---|
| Domestic talent crunch for EDA and design verification engineers | -0.8% | National, with spillover to regional operations | Medium term (2-4 years) |
| High LNG-Linked Electricity Tariffs Inflating Fab OPEX | -0.6% | National, affecting all manufacturing operations | Short term (≤ 2 years) |
| US CHIPS-Act Guardrails on Korea-Owned Fabs in China | -0.4% | Global, affecting China's operations specifically | Medium term (2-4 years) |
| Water-Stress Permitting Risk for New Mega-fabs | -0.3% | National, concentrated in semiconductor clusters | Long term (≥ 4 years) |
| Source: Mordor Intelligence | |||
Domestic Talent Crunch for EDA and Verification Engineers
Korea’s design ecosystem struggles to fill vacancies in EDA and formal-verification roles, with the Korea International Trade Association cautioning that design competitiveness could erode without rapid startup scaling. Wage inflation persists as AI chip unicorns vie for scarce expertise; Rebellions received more than 500 applications for 30 openings but still cites pipeline shortages. Policymakers raised R&D tax credits to 50% and earmarked KRW 9 trillion (USD 6.5 billion) for semiconductor education, yet industry leaders warn that immediate relief is limited because advanced-node verification demands years of hands-on exposure. Exemptions from Korea’s 52-hour workweek remain contested, highlighting the tension between labor reform and global competitiveness. Unless talent inflows accelerate, tape-out schedules for cutting-edge designs risk delay, tempering the near-term upside of the Korea semiconductor device market.
High LNG-Linked Electricity Tariffs Inflating Fab OPEX
Industrial electricity tariffs climbed roughly 70% between 2022 and 2024, reversing decades-long subsidization and leaving Korean manufacturers paying more than residential users. A state-of-the-art fab consumes 50–100 MW of continuous power, so any incremental USD 0.01 per kWh increase meaningfully compresses margins in commodity nodes. Some producers are pursuing direct renewable-energy purchase agreements, yet grid intermittency raises reliability concerns. Analysts warn that persistent cost escalation could push commodity logic and mature-node memory production offshore, denting utilization in domestic fabs. Lower-margin segments might lose cost competitiveness relative to peers operating in lower-tariff jurisdictions, putting a drag on the Korea semiconductor device market’s aggregate CAGR.
*Our forecasts treat driver/restraint impacts as directional, not additive. The impact forecasts reflect baseline growth, mix effects, and variable interactions.
Segment Analysis
By Device Type: Integrated-Circuit Dominance Anchors Growth
Integrated circuits represented 85.72% of Korea semiconductor device market share in 2025 and are projected to advance at a 6.32% CAGR to 2031, underpinned by SK Hynix and Samsung’s leadership in DRAM and HBM. Memory revenue continues to outpace volume expansion because HBM devices secure premium pricing linked to AI workloads. Logic output benefits from Samsung’s 3 nm ramp, drawing new design wins in AI accelerators and high-performance computing. Microcontroller and DSP demand rise steadily as smart-factory installations proliferate. Discrete, optoelectronic, and sensor categories occupy a smaller revenue base yet gain strategic importance as EV adoption spurs silicon-carbide MOSFET and lidar-grade laser-diode demand.
Momentum in advanced packaging amplifies integrated-circuit value, with domestic suppliers racing to commercialize hybrid bonding for HBM4 and 2.5D interposers. The Korea semiconductor device market device size for sensor-rich AI edge devices is projected to grow in sync with smart-city deployments, encouraging startups to co-design MEMS with established foundries for rapid prototyping. Power-device investments receive policy support through green-mobility stimulus measures, creating a feedback loop where automotive electrification fuels diversified semiconductor revenue streams.


By Business Model: Design-Centric Value Creation Accelerates
Design and fabless vendors commanded 67.05% of Korea's semiconductor device market size in 2025 and are forecast to post the segment’s strongest 7.1% CAGR to 2031 as venture funding migrates from hardware manufacturing toward intellectual-property leverage. The Rebellions–Sapeon merger, valued at KRW 2 trillion, spotlights investor enthusiasm for local AI-chip platforms. Public-sector funds totaling KRW 24 trillion in low-interest loans accelerate tape-outs, while preferential procurement mandates target 80% domestically designed AI accelerators in Korean data centers by 2030.
IDM titans Samsung and SK Hynix continue to integrate design, fabrication, and packaging, yet they are also courting external customers via foundry and packaging services. Hybrid operating models emerge whereby in-house design teams collaborate with external EDA vendors and local startups to customize vertical solutions. This division of labor enhances time-to-market and spreads risk across the Korea semiconductor device industry, facilitating rapid iteration without full overhead duplication.
By End-User Industry: AI Workloads Lead Demand Shift
Communication equipment retained 31.22% of Korea's semiconductor device market share in 2025, buoyed by 5G base-station deployments and private networks in industrial estates. Yet AI workloads deliver the fastest 7.86% CAGR, as hyperscalers quadruple GPU cluster counts and edge-inference devices permeate smart factories. Automotive electrification catalyzes demand for silicon-carbide power devices and ADAS vision processors, dovetailing with national targets for 4.5 million zero-emission vehicles by 2030.
Computing and data-storage applications ride the HBM wave, allowing Korean memory suppliers to capture value disproportionate to shipped bit volumes. Industrial automation spurs sensor fusion and microcontroller shipments, while consumer electronics, though mature, supply a stable baseline volume for image sensors and NAND-based storage. Government contracts for defense AI accelerators introduce new high-reliability design requirements that spill over into commercial sectors, further expanding the Korea semiconductor device market.
Geography Analysis
Domestic production remains heavily concentrated in Gyeonggi Province, where the K-Semiconductor Belt rolls out 10+ greenfield fabs, creating economies of scale in utilities and logistics. Export receipts reached USD 141.9 billion in 2024, a 43.9% jump, driven chiefly by premium AI memory shipments. China remains the largest destination, though CHIPS-Act guardrails and U.S. export-control regimes encourage Korean firms to diversify sales.
The United States posts the fastest import growth for Korean chips, aided by Samsung’s USD 6.4 billion CHIPS-Act grant for its Texas foundry, which cements supply-chain linkages for advanced nodes. Europe offers steady demand for power devices aligned with EV mandates. Southeast Asia and India open new consumer-electronics and industrial-automation channels where Korean vendors capitalize on brand equity and turnkey design services.
Japan sustains a symbiotic materials and equipment trade, despite overlap in memory portfolios. Long-range forecasts from the Korea semiconductor device market industry Association envisage the country capturing 20% global production share by 2032, edging ahead of Taiwan as investments in the K-Semiconductor Belt mature.
Mordor Intelligence provides coverage of the semiconductor device market across other key regional markets, including Asia and Europe, each with their regulatory frameworks and demand patterns. Detailed country-level analysis extends to China and Japan incorporating local coverage and market participation, as required.
Regulatory Landscape
South Korea tightened governance for semiconductors through the January 2026 Special Act on Strengthening Competitiveness and Support for the Semiconductor Industry. The law streamlines infrastructure support and speeds licensing for semiconductor clusters, coordinated by a Presidential Semiconductor Special Committee to manage inter-ministerial execution.
The government is also pursuing amendments to ease the Fair Trade Act great-grandsubsidiary rule for non-capital region investments under the National Advanced Strategic Industries Act. This is intended to reduce ownership requirements and allow national strategic projects to bypass initial feasibility steps, with a dedicated special accounting unit created to secure funding for semiconductor support.
Value Chain Analysis
The Korea value chain is shifting both geographically and by capabilities, under US and allied technology controls that affect advanced manufacturing equipment, EDA software, and AI chips. Memory fabrication remains the anchor of the ecosystem, led by Samsung Electronics and SK Hynix, supported by package substrates from Samsung Electro-Mechanics and Daeduck Electronics, and test and inspection ecosystems including Neosem and Exicon.
Specialized sub-sectors are expanding to support higher density memory and advanced packaging, including memory subsystem IP (OpenEdges Technology), substrate inspection (GigaVis), and test sockets (LEENO Industrial, ISC). Infrastructure support for power, water, and wastewater treatment, together with workforce pipelines, is being incorporated into national strategic planning, reinforced by the January 2026 semiconductor support act to improve utilities and permitting throughput for capacity additions and co-located suppliers.
Competitive Landscape
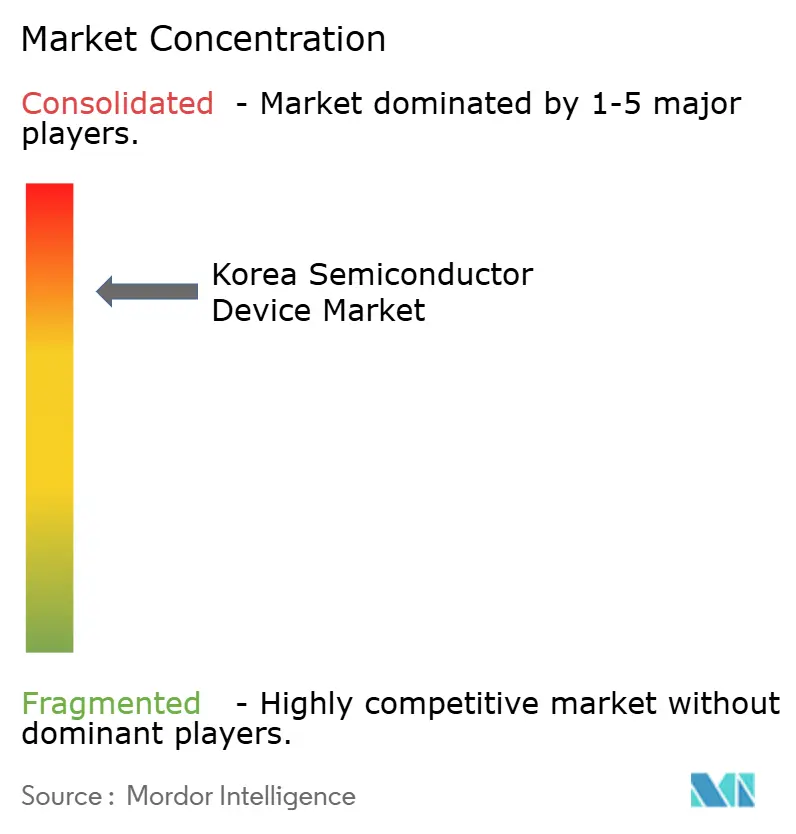
The Korea semiconductor device market exhibits high concentration in memory, where SK Hynix and Samsung collectively hold roughly 70% global DRAM and more than 70% HBM share. SK Hynix’s HBM lead stems from faster thermal-dissipation stack designs that meet Nvidia’s specifications ahead of competitors. Samsung, meanwhile, pursues advanced 2 nm logic to differentiate its foundry offering in AI accelerators, winning USD 16.5 billion in silicon orders from Tesla in July 2025.[4]
Foundry competition remains global; Samsung’s 13% share trails TSMC’s 62%, yet the Austin expansion and Apple’s next-generation image-sensor contract reposition Samsung as a credible second source for 3 nm and 2 nm chips. Emerging fabless startups Rebellions, DeepX, and FuriosaAI collectively raised over USD 249 million since 2024, channeling funds into AI-specific architectures that integrate processing-in-memory and transformer acceleration.
Advanced packaging forms the next battleground: SK Hynix sampled 12-high HBM4 in 2025, while Samsung invests in backside-power delivery and hybrid bonding. Local equipment makers capitalize on new demand for pellicles, photoresists, and wafer-level heat spreaders, rounding out a vertically integrated ecosystem. Given that the top two players exceed 80% share in memory but under 15% in foundry, the overall market ranks at 8 on the concentration scale, reflecting dominance in select segments yet fragmentation elsewhere.
Korea Semiconductor Device Industry Leaders
-
Intel Corporation
-
Toshiba Corporation
-
Samsung Electronics Co. Ltd
-
NXP Semiconductors NV
-
SK Hynix Inc.
- *Disclaimer: Major Players sorted in no particular order
Market Opportunities and Future Outlook
Government initiatives aim to expand Korea's system semiconductor share from 3% to 10% and raise self-sufficiency for materials, components, and equipment from 30% to 50% by 2030. This is anchored by the USD 471 billion K-Semiconductor Belt megaproject, which funnels capital into the broader ecosystem.
Regional efforts are also reshaping where capacity is added. The Honam region strategy includes a large cluster planned for Gwangju and Jeolla with multiple new memory fabs, and Samsung Electronics and SK Hynix have pledged 800 trillion won for memory fabs and related facilities there, alongside SK Hynix plans for a NAND hub and advanced packaging in Cheongju. Samsung Group has committed 140 trillion won for HBM and display facilities in Chungcheong, while SK Group is targeting an AI data center network of 18.4 gigawatts by 2035, reinforcing a domestic AI memory and AI-capable chip supply chain. Taken together, the K-Semiconductor Belt and these regional investments point to a memory-centric expansion theme, with a stronger emphasis on AI accelerators and advanced packaging within Korea's industrial policy.
Recent Industry Developments
- July 2026: Samsung Electronics and SK Hynix announced a 392 trillion won investment plan to build HBM fabs and packaging facilities in central Chungcheong. The plan expands domestic memory production capacity and reinforces South Korea's role in AI accelerator supply chains, signaling a broad cluster-based development strategy.
- June 2026: Government and industry announced an 800 trillion won corporate investment plan for a new semiconductor cluster in the southwestern Gwangju and Jeolla regions, involving four new memory fabrication plants. The initiative expands regional semiconductor capabilities and accelerates the build out of memory manufacturing capacity within a unified national strategy.
- June 2026: SK Hynix announced an investment plan for a semiconductor cluster in the southwestern region, including establishment of two memory fabs and a 1GW AI data center. The project supports the memory supply ecosystem and backs large-scale AI data processing, reinforcing the regional development agenda.
Research Methodology Framework and Report Scope
Market Definition and Coverage
This market covers the value of semiconductor devices supplied into South Korea, counted as manufacturer-level revenues for chips and related semiconductor components used across major end uses in the country.
Scope exclusions: We exclude semiconductor manufacturing equipment, raw materials like wafers and gases, and outsourced semiconductor assembly and test services from the market value.
Segmentation Overview
- By Device Type
- Discrete Semiconductors
- Diodes
- Transistors
- Power Transistors
- Rectifier and Thyristor
- Other Discrete Semiconductors
- Optoelectronics
- Light-Emitting Diodes (LEDs)
- Laser Diodes
- Image Sensors
- Optocouplers
- Other Optoelectronics
- Sensors and MEMS
- Pressure
- Magnetic Field
- Actuators
- Acceleration and Yaw Rate
- Temperature and Other Sensors and MEMS
- Integrated Circuits
- By Integrated Circuit Type
- Analog
- Micro
- Microprocessors (MPU)
- Microcontrollers (MCU)
- Digital Signal Processors
- Logic
- Memory
- By Technology Node
- less than 3nm
- 3nm
- 5nm
- 7nm
- 16nm
- 28nm
- Above 28nm
- By Integrated Circuit Type
- Discrete Semiconductors
- By Business Model
- IDM
- Design/ Fabless Vendor
- By End-user Industry
- Automotive
- Communication (Wired and Wireless)
- Consumer
- Industrial
- Computing/Data Storage
- Data Center
- Artificial Intelligence
- Government (Aerospace and Defense)
Data Sources, Market Sizing, and Validation
Desk Research
Desk research was used to set the market boundaries, build the historical context, and identify external signals that explain demand swings. We relied on public data series and official publications such as Statistics Korea (KOSTAT), the Bank of Korea, Korea Customs Service trade statistics, and Ministry of Trade, Industry and Energy releases, which help check electronics output, trade flows, and industrial activity.
To translate those signals into a workable model, we also reviewed sources such as Korea International Trade Association dashboards, UN Comtrade trade series, and OECD macro indicators, plus company filings and investor presentations for capacity and product mix commentary. Where needed, paid database subscriptions were used for company financials and intelligence, patent databases, and shipment-level import and export checks, which helped reduce gaps in smaller product lines. This desk source list is illustrative, and other public and paid references were also used for data collection, validation, and clarification.
Primary Interviews and Surveys
Primary work focused on confirming what portion of demand is served inside South Korea, and how pricing and mix change across integrated circuits, discretes, sensors and MEMS, and optoelectronics. We spoke with device makers, design teams, distributors, downstream electronics OEMs, and domain specialists, then used their inputs to test assumptions on utilization, end-use pull, and export-oriented production dynamics.
Because this is a country market, we emphasized coverage across domestic supply and import channels, so gaps seen in published trade or macro data could be corrected before finalizing totals.
Distribution of primary research fieldwork respondents
| Company type | Respondent position |
|---|---|
| Top tier: 37% | CXOs: 13% |
| Mid tier: 46% | Functional/Unit leaders: 27% |
| Smaller Players: 17% | Managers: 60% |
Market-Sizing & Forecasting
The sizing logic starts from a top-down rebuild of South Korea semiconductor device demand using production and trade signals, followed by end-use allocation that links back to electronics output and investment cycles. Once that total is formed, we corroborate it using selective bottom-up checks such as sampled supplier roll-ups, distributor channel checks, and volume times ASP math for a few high-visibility device groups, which helps adjust for double counting and timing gaps.
Key inputs used in the model include import and export trends for semiconductor-related HS codes, electronics and ICT production indicators, fab capacity additions and utilization commentary, memory price cycle direction, and end-use demand signals from automotive and communications build plans. For the forecast, scenario analysis is applied around cycle variables like pricing and utilization, and then smoothed with supporting trend lines from macro and end-market indicators so the growth path does not jump unrealistically. When bottom-up evidence is missing for smaller device categories, controlled proxies from trade shares and validated mix assumptions are applied, and then totals are re-checked against independent demand signals.
Data Validation & Update Cycle
Totals are cross-checked through triangulation across three layers: macro signals, trade and production series, and expert validation from primary calls. If any output appears inconsistent, such as a sudden share change that is not supported by export movements, utilization discussion, or end-use production, the inputs are re-tested and the assumptions are revised before sign-off.
A second analyst review is completed to check unit consistency, currency conversion timing, and trend breaks across the historical period. Reports are refreshed annually, and interim updates are done when a material event impacts pricing, capacity, or demand. Before delivery, a final analyst pass is performed so clients receive the latest updated view.
Mordor Intelligence's Korea Semiconductor Device Market Size Compared With Other Published Estimates
Published market sizes for South Korea semiconductor devices can look far apart because the product set and the counting point are not always the same, and because cycle-driven pricing can be treated differently across studies. Differences also come from how exports are handled, since Korea is a major production hub and some estimates mix domestic demand with outbound shipment values.
Some published figures fold in broader electronics components or report a number that is closer to export totals in a strong memory pricing year. For Mordor Intelligence, the model is limited to semiconductor devices and is reconciled through production and trade checks so exports are not counted again as local consumption.
Benchmark comparison
| Source | Market Size | Gaps in Research Methodology |
|---|---|---|
| Mordor Intelligence | USD 33.86 B (2025) | |
| Trade Journal A | USD 141.90 B (2024) | Often aligns with headline semiconductor export value, which can overstate the Korea device market by reflecting outbound shipments and cycle-inflated memory pricing rather than Korea-only device demand. |
| Policy Institute B | USD 180.33 B (2024) | Uses a broad semiconductor industry trade lens that can bundle multiple categories and is not designed as a device market sizing model tied to end-use demand allocation. |
The table shows that the widest gaps typically appear when export totals are used as a direct proxy for market value, or when a broader industry definition is applied. By keeping the scope to devices and then checking the model against trade, production, and end-use pull indicators, we deliver an estimate that can be repeated and updated with the same steps each year.
Key Questions Answered in the Report
What is the projected value of the South Korea semiconductor market in 2031?
The market is forecast to reach USD 46.52 billion by 2031, reflecting a 5.43% CAGR over 2026–2031.
Which device category dominates revenue?
Integrated circuits generated 85.72% of revenue in 2025 and continue to lead through 2031.
Why is HBM important for Korean suppliers?
High-bandwidth memory commands premium pricing and powers AI accelerators, helping SK Hynix and Samsung secure long-term contracts.
What policy supports design-centric startups?
Seoul’s K-Semiconductor Belt offers tax credits up to 50% on R&D and a KRW 9 trillion education program that feeds the design talent pipeline.
How are electricity prices affecting fabs?
Industrial tariffs climbed roughly 70% from 2022–2024, raising operating costs and pushing firms to explore direct renewable-energy sourcing.