
Market Overview
| Study Period | 2021 - 2031 |
|---|---|
| Forecast Data Period | 2026 - 2031 |
| Base Year Market Size (2025) | USD 6.46 Billion |
| Market Size (2026) | USD 6.69 Billion |
| Market Size (2031) | USD 7.96 Billion |
| Growth Rate (2026 - 2031) | 3.55 % |
| Market Concentration | Medium |
Major Players *Disclaimer: Major Players sorted in no particular order Image © Mordor Intelligence. Reuse requires attribution under CC BY 4.0. | |
Kazakhstan Oil And Gas Upstream Market Analysis by Mordor Intelligence
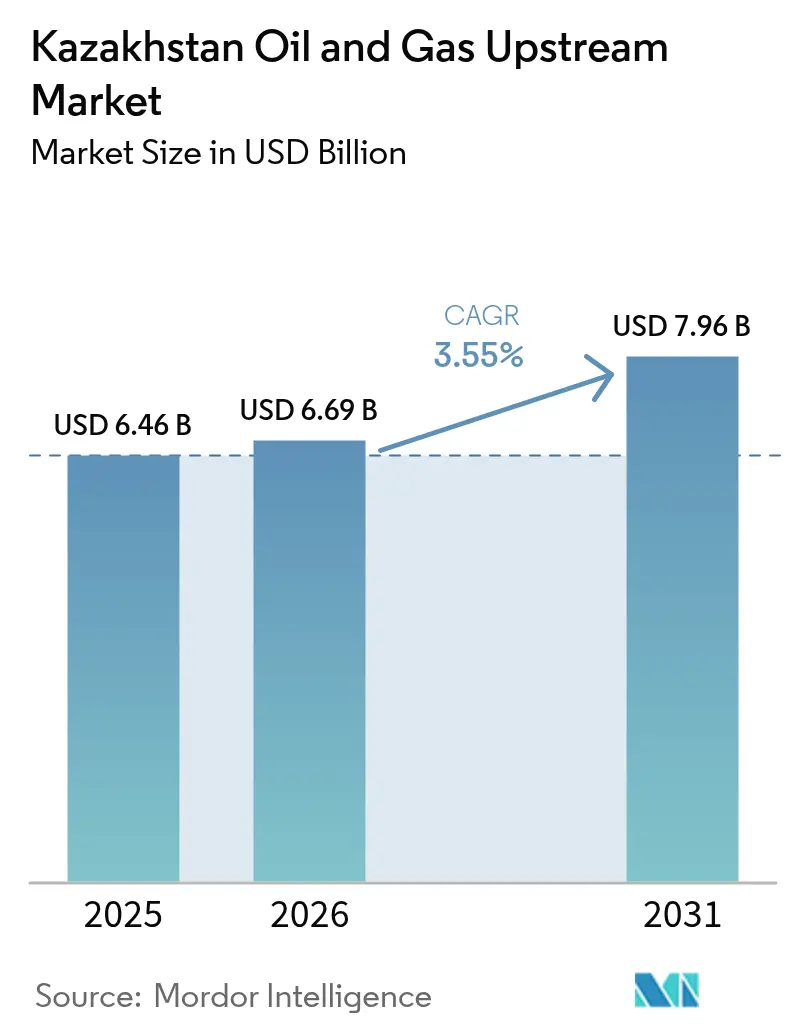
The Kazakhstan Oil And Gas Upstream Market size was valued at USD 6.46 billion in 2025 and estimated to grow from USD 6.69 billion in 2026 to reach USD 7.96 billion by 2031, at a CAGR of 3.55% during the forecast period (2026-2031).
A sustained pivot toward offshore megaprojects, rapid adoption of enhanced recovery methods, and gradual diversification of export routes underpin this growth despite persistent sulfur-handling costs and aging onshore infrastructure. Offshore assets already account for 83.8% of 2024 revenues and post the fastest 5.5% growth, while Chevron’s USD 48 billion Tengiz upgrade, Kashagan Phase 2, and larger China-bound pipelines carry the expansion momentum. Crude oil keeps its 70.2% volume dominance; however, associated gas is accelerating as four processing plants add 8.4 bcm of capacity between 2026 and 2030. Conventional wells still account for 95% of activity, but unconventional tight plays are growing at a rate of 5.3% annually, driven by new tax relief and digital twin analytics.
Key Report Takeaways
- By location of deployment, offshore commanded 83.18% of the Kazakhstan oil and gas upstream market share in 2025 and is projected to expand at a 5.25% CAGR through 2031.
- By resource type, crude oil led with a 69.58% share of the Kazakhstan oil and gas upstream market size in 2025, while natural gas is forecast to grow at a 4.85% CAGR to 2031.
- By well type, conventional operations accounted for a 94.32% share in 2025; unconventional wells are expected to register the highest 5.05% CAGR over 2026-2031.
- By service, development and production services held a 59.72% share in 2025, whereas decommissioning services posted the strongest 5.4% CAGR to 2031.
Note: Market size and forecast figures in this report are generated using Mordor Intelligence’s proprietary estimation framework, updated with the latest available data and insights as of 2026.
Kazakhstan Oil And Gas Upstream Market Trends and Insights
Drivers Impact Analysis*
| Driver | (~) % Impact on CAGR Forecast | Geographic Relevance | Impact Timeline |
|---|---|---|---|
| Oil-price recovery boosting E&P budgets | +1.2% | Atyrau, Mangystau | Short term (≤ 2 years) |
| Kashagan Phase-2 ramp-up | +0.9% | Offshore Caspian Sea | Medium term (2-4 years) |
| Enhanced oil-recovery tax incentives | +0.7% | National | Medium term (2-4 years) |
| China-bound trunk pipeline expansions | +0.6% | West Kazakhstan-Xinjiang | Long term (≥ 4 years) |
| Digital twin adoption for sour-gas fields | +0.3% | Karachaganak, Tengiz, Kashagan | Medium term (2-4 years) |
| Low-carbon CCS pilots unlocking deeper reservoirs | +0.2% | National | Long term (≥ 4 years) |
| Source: Mordor Intelligence | |||
Oil-price recovery boosting E&P budgets
Exploration and production budgets increased by 18% in 2024, as Brent remained above USD 75 per barrel. Capital inflows accelerated drilling at Uzen, resulting in 5,900 tonnes of extra output in Q1 2024. Chevron fast-tracked Tengiz completion on similar price support.[1] Yet compliance with OPEC+ quotas capped national production at 1.7 million bpd, exposing the Kazakhstan oil and gas upstream market to price volatility.
Kashagan Phase-2 ramp-up
Phase 2 lifts Kashagan capacity from 370,000 bpd to 450,000 bpd by 2027 through the installation of new wellhead platforms and the addition of 3.5 bcm of gas processing. Sour-gas-resistant steel and real-time corrosion monitoring reduce downtime by 60% compared to 2022-2023. Break-even costs decreased from USD 45 to USD 32 per barrel following efficiency gains.
Enhanced oil-recovery tax incentives
The 2024 Enhanced Contract Model halves the corporate tax for CO2-EOR and polymer flooding, reducing Tengiz's payback from nine to six years.[2] Karachaganak pilots lift recovery to 48% while locking in 2.1 million t CO₂ each year.
China-bound trunk pipeline expansions
China's capacity is expected to reach 20 million tons in 2024 and rise to 25 million tons by 2027, reducing reliance on the Russian route from 85% in 2024 to a forecasted 75% by 2030.[3] New pumps and thicker pipe grades prevent quality penalties that once shaved USD 3 per barrel off netbacks.
Restraints Impact Analysis*
| Restraint | (~) % Impact on CAGR Forecast | Geographic Relevance | Impact Timeline |
|---|---|---|---|
| High sulfur-content processing costs | -0.8% | Kashagan, Karachaganak, Tengiz | Medium term (2-4 years) |
| Aging onshore infrastructure | -0.6% | Mangystau, Atyrau | Long term (≥ 4 years) |
| Export-route dependency on Russian pipelines | -0.4% | National | Medium term (2-4 years) |
| Water-stress-related social opposition | -0.3% | Mangystau, Aral basin | Short term (≤ 2 years) |
| Source: Mordor Intelligence | |||
High sulfur-content processing costs
Hydrogen sulfide levels of 15-19% inflate development costs 25-35% above global averages.[4] Operators spend USD 400 million each year replacing corroded pipe at Kashagan, while Tengiz stores 600,000 t of elemental sulfur annually.
Aging onshore infrastructure
More than 35,000 km of pipelines, averaging 30 years old, require USD 20 billion in upgrades by 2030. Recent spills in Mangystau intensified regulatory scrutiny and raised operating costs by 15-20%.
*Our forecasts treat driver/restraint impacts as directional, not additive. The impact forecasts reflect baseline growth, mix effects, and variable interactions.
Segment Analysis
By Location of Deployment: Offshore supremacy drives technical innovation
Offshore assets generated USD 5.37 billion, or 83.18% of the Kazakhstan oil and gas upstream market size in 2025, and are forecasted to grow at a 5.25% CAGR through 2031. Kashagan, Tengiz’s carbonate shelf, and the Kalamkas-Sea cluster headline this push toward deeper, higher-pressure reservoirs. Continuous technology transfer from global majors brings sour-gas-resistant alloys and real-time corrosion surveillance to the Caspian Sea projects. Investments of USD 6 billion are earmarked for Kalamkas-Sea and Khazar, underscoring enduring confidence despite caustic gas and ice-prone waters.
Onshore operations remain vital, but they contribute only USD 1.09 billion, or 16.82%, of the Kazakhstan oil and gas upstream market in 2025. Aging Soviet-era gathering lines and rising water stress curb onshore growth to a 2.65% CAGR. Nonetheless, smart-workover programs at Uzen and Zhetybai, coupled with CO₂-EOR tax relief, extend field life and prevent abrupt decline.


By Resource Type: Crude oil dominance faces natural gas acceleration
Crude oil supplied 69.58% of 2025 revenue, translating to USD 4.49 billion within the Kazakhstan oil and gas upstream market size, and is set for a 3.65% CAGR through 2031. Tengiz’s expansion is already delivering 260,000 bpd by mid-2025, while Kashagan Phase 2 targets 450,000 bpd. Premium Mangistau and Buzachi grades enjoy widening Asian refinery demand.
Natural gas, worth USD 1.97 billion in 2025, climbs 4.85% annually as four processing plants add 8.4 bcm capacity. Karachaganak’s 4 bcm increment and new fiscal incentives for associated-gas utilization reduce flaring and propel export potential to China.
By Well Type: Conventional foundations enable unconventional growth
Conventional activity captured 94.32% of 2025 spending, yet grows a moderate 3.35% CAGR. Extended-reach laterals now exceed 8,000 meters, unlocking attic oil left behind in carbonate reefs.
Unconventional wells, a 5.68% slice today, become the agility playbook, registering a 5.05% CAGR as the Enhanced Contract Model slashes tax by half. Tight plays in the Chu-Sarysu Basin exhibit initial rates of 150-200 bpd after multi-stage fracs, and AI-driven geosteering reduces drilling costs by 20%.
By Service: Development leadership yields to decommissioning growth
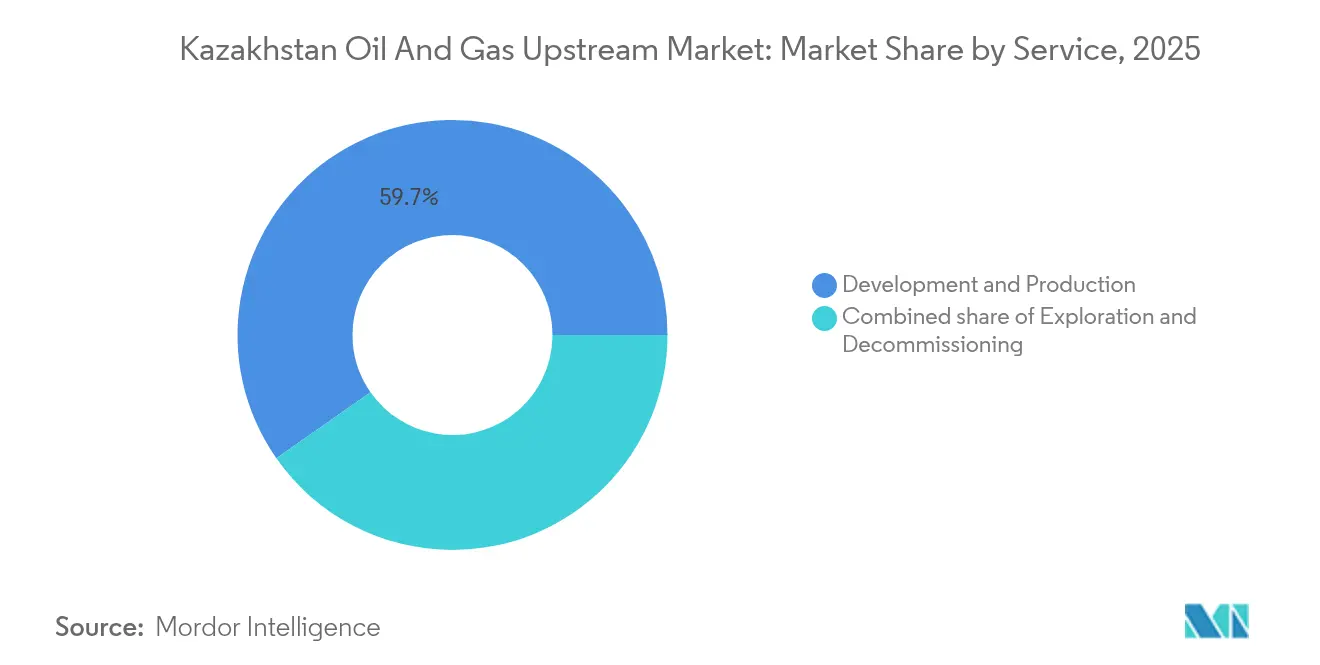
Development and production services accounted for 59.72% of 2025 revenue, but decelerated to a 3.62% CAGR once large projects reached a plateau. AI-enabled drilling, exemplified by KazMunayGas’s ABAI system, helps maintain healthy margins.
Decommissioning, now at 14.20%, is expected to accelerate at a 5.4% CAGR as 2,500 wells face retirement by 2030. Cost estimates of USD 150,000-300,000 per well, combined with tight remediation rules, spur early provisioning by majors.
Geography Analysis
The Atyrau and Mangystau corridor generated 77.23% of the national output in 2025, equivalent to USD 4.99 billion of Kazakhstan's oil and gas upstream market size. Tengiz and Kashagan expansions lift the corridor's production CAGR to 3.9% through 2031. Upstream operators benefit from nearby CPC and Kazakhstan-China pipeline hubs, though USD 15 billion in pipeline renewal remains urgent.
Kyzylorda and Aktobe together accounted for 15.39% of 2025 revenue and registered a 4.0% CAGR, as deeper formations and tight plays attract capital. Karachaganak's gas upgrade adds 4 bcm handling, reducing prior reinjection bottlenecks. Regulatory flexibility, including tax holidays in frontier areas, stimulates seismic and appraisal activity.
Eastern and northern provinces represent the remaining 7.38% but gain longer-term interest as seismic coverage improves. Infrastructure gaps are narrowing with the planned construction of rail-to-pipeline terminals and potential Trans-Caspian links to western export routes.
Regulatory Landscape
Kazakhstan's upstream oil and gas activity is governed primarily by the Code on Subsoil and Subsoil Use (2017), administered by the Ministry of Energy of the Republic of Kazakhstan. The ministry oversees licensing, subsoil-use contracts, and compliance. Law No. 249-VIII dated 30 December 2025 introduced amendments tied to unified state management and updated licensing procedures that enter into force from 1 January 2026, moving subsoil use toward more standardized, digitally administered processes.
Environmental and operational compliance is handled jointly with the Ministry of Ecology and Natural Resources, which issues environmental permits and performs state environmental expert reviews, including oversight relevant to emissions and flaring. Raw-gas flaring controls under Article 146 of the Subsoil Code tie allowable volumes to permits issued via the Ministry of Energy, with environmental oversight applied to monitoring. State priority rights for national companies such as KazMunayGas and QazaqGaz also affect transactions involving strategic plots and transfers of subsoil-use rights, which can shape entry conditions for international operators, particularly for gas-linked assets.
Competitive Landscape
The five largest operators—KazMunayGas, Chevron, Eni, Shell, and TotalEnergies—control roughly 65% of productive capacity, giving the Kazakhstan oil and gas upstream market a moderately concentrated profile. CNOOC’s USD 2.1 billion joint venture around Tengiz and MOL Group’s broad alliance demonstrate that international interest remains high despite geopolitical tensions. Technology remains the prime differentiator: digital twins, high-alloy steels, and CO₂-EOR deliver measurable efficiency gains. New entrants include AI-specialist service companies that cut drilling downtime and secure contracts across sour-gas fields. Environmental stewardship is becoming a competitive moat as ISO 14001 certification accelerates permitting in water-stressed areas.
Kazakhstan Oil And Gas Upstream Industry Leaders
-
National Company JSC (KazMunayGas)
-
Chevron Corporation
-
Karachaganak Petroleum Operating B.V.
-
Eni S.p.A.
-
PJSC Gazprom
- *Disclaimer: Major Players sorted in no particular order

Market Opportunities and Future Outlook
A clear whitespace sits at the intersection of sour-gas developments and domestic gas monetization. New processing and reinjection capability can support higher commercial gas output and reduce reinjection constraints. In 2025, a sixth crude gas reinjection compressor was commissioned at Karachaganak to help sustain production levels, and the broader national agenda targets commercial gas production of 27.4 bcm in 2026. That creates demand for upstream-linked gas handling, compression, and field infrastructure upgrades across major assets such as Karachaganak and Kashagan.
Exploration partnerships and digital operating models also broaden the opportunity set beyond the core megaprojects. In March 2026, Shell signed a contract with the Ministry of Energy for geological exploration of the Zhanaturmys block. In April 2026, KazMunayGas and BP signed a Memorandum of Intent to jointly explore the Ustyurt block in Mangystau, reflecting continued acreage access for international firms through state-led frameworks. On operating performance, the Ministry of Energy announced an AI Alliance in April 2026 to deploy digital solutions, including a pilot intelligent drilling monitoring system covering more than 4,000 wells. Samruk-Kazyna also advanced the SKAI ecosystem and centralized data platform in 2026, supporting commercial openings for service providers in AI-enabled drilling, production surveillance, and digital twin deployments tied to Kazakhstan's upstream corrosion, integrity, and cost challenges.
Recent Industry Developments
- July 2026: KazMunayGas and Chevron executives met in Astana to discuss ongoing operations at the Tengiz field and export logistics, including the Caspian Pipeline Consortium route and the Baku-Tbilisi-Ceyhan pipeline. The engagement underscores the commercial priority of export-route optionality for Kazakhstan barrels and reinforces operator focus on managing evacuation risk alongside field ramp-ups.
- June 2026: Karachaganak Petroleum Operating (KPO) reached First Gas Reinjection for the KEP-1B project ahead of schedule at the Karachaganak field. Earlier reinjection strengthens pressure maintenance and supports liquids recovery while providing a near-term operational lever amid broader gas-processing and reinjection constraints in the country.
- February 2024: Kazakh authorities took over a privately held venture linked to the next phase of the Kashagan project led by Eni. The move highlighted the state's active role in reshaping participation and governance around strategic offshore assets, with implications for project control, contracting structure, and execution timelines.
Research Methodology Framework and Report Scope
Market Definition and Coverage
This market covers spending linked to Kazakhstan upstream oil and gas activity, including exploration, field development and production work, and end of life decommissioning, across onshore and offshore areas, and covering crude oil and natural gas.
Scope exclusions: Midstream transport and storage, downstream refining and marketing, and petrochemicals are excluded from this sizing.
Segmentation Overview
- By Location of Deployment
- Onshore
- Offshore
- By Resource Type
- Crude Oil
- Natural Gas
- By Well Type
- Conventional
- Unconventional
- By Service
- Exploration
- Development and Production
- Decommissioning
Data Sources, Market Sizing, and Validation
Desk Research
Desk work started by mapping the country level upstream context in Kazakhstan, then translating it into a spend view that can be modeled year over year. We relied on public sources such as the Kazakhstan national statistics system, energy ministry and regulator releases, and central bank macro series to anchor currency, inflation, and investment timing assumptions.
To connect activity levels with likely spend, production and field signals were tracked using sources such as OPEC and IEA datasets, EIA country notes, and open releases from major field operators and partners through annual reports and investor decks. Import and export signals for equipment and services were also checked using customs and trade portals where available, and patents and technical publications were used as directional inputs for unconventional and enhanced recovery discussion. Paid subscriptions for company financials, news and financials, patent lookups, and shipment-level trade snapshots were used selectively to fill gaps and cross-check public statements, and the sources listed here are illustrative rather than exhaustive.
Primary Interviews and Surveys
Interviews and surveys with Kazakhstan-based operators, drilling and field-service providers, project specialists, and equipment suppliers help test production ramps, service intensity, pricing assumptions, project timing, and gaps in public disclosures. Their input is used to adjust the model before finalization, particularly where field-level activity or supplier pricing is not publicly reported.
Distribution of primary research fieldwork respondents
| Company type | Respondent position |
|---|---|
| Top tier: 28% | CXOs: 18% |
| Mid tier: 47% | Functional/Unit leaders: 32% |
| Smaller Players: 25% | Managers: 50% |
Market-Sizing & Forecasting
Sizing was built using a top-down reconstruction of upstream spend, where national upstream activity signals were translated into value through service intensity and cost curves for Kazakhstan projects. The totals were then corroborated with selective bottom-up checks, such as sampled project spend builds, supplier and contractor revenue exposure to Kazakhstan, and simple volume times average cost approximations, and the results were adjusted where the checks repeatedly pointed to a consistent gap.
Inputs used in the model include Kazakhstan crude oil and natural gas production levels, drilling and well work activity splits by conventional versus unconventional, offshore versus onshore program mix, decommissioning timing, and the expected progression of key cost items such as rigs, completion services, and offshore logistics. Because cost and activity move together unevenly, a scenario-based forecast was run, and the final path was selected based on expert views on capex pacing, sanctioning timelines, and cost normalization. Where operator level spend disclosure was incomplete, missing pieces were bridged using comparable asset benchmarks and cross-verified through primary inputs, so the country total stayed consistent with observable activity.
Data Validation & Update Cycle
Model outputs were checked against independent signals such as field level project milestones, country production trends, and changes in drilling and service utilization that would normally show up ahead of spend. Outliers were reviewed in multiple steps, and when a variance could not be explained by public data, follow-up calls were triggered to confirm whether the change was timing, scope, or pricing driven.
The report is refreshed on an annual cycle, and interim updates are made when major upstream events occur for Kazakhstan, such as a large project sanction, a material production revision, or a change in fiscal terms that can shift investment plans. Before delivery, an analyst completes a fresh review pass so the latest public releases and confirmed expert inputs are reflected in the final numbers.
Mordor Intelligence's Kazakhstan Oil and Gas Upstream Market Size Compared Against Other Published Estimates
Published market values for Kazakhstan upstream often do not match because the counting rules behind them are not the same, even when the titles look similar. The biggest differences usually come from what gets treated as upstream spend versus adjacent oil and gas spending, the base year chosen, and how local cost inflation and exchange rates are applied.
The main gap comes from upstream versus full value chain inclusion, where Mordor Intelligence counts only exploration, development and production, and decommissioning spend in Kazakhstan (onshore and offshore), rather than folding in midstream or downstream services that can inflate totals.
Benchmark comparison
| Source | Market Size | Gaps in Research Methodology |
|---|---|---|
| Mordor Intelligence | USD 6.69 B (2026) | |
| Industry Research Publisher A | USD 38.28 B (2023) | The estimate appears to use a much broader spend pool and earlier base year, and it likely mixes upstream activity with wider oil and gas production related services and cost stacks, which lifts the value far above a pure upstream definition. |
| Global Publisher B | USD 38.70 B (2026) | This figure is consistent with a scope that treats upstream as a wider contractor and project economy, and it can also reflect different cost escalation and currency timing, which pushes the 2026 value well beyond an upstream-only spend model. |
Across the three figures, the spread is explained less by arithmetic and more by what each model decides to count and when. By keeping the spend pool tied to observable upstream work scopes and then checking the totals against project and activity signals, the resulting value is easier to trace and repeat for year-on-year comparisons.
Key Questions Answered in the Report
What is the projected value of the Kazakhstan oil and gas upstream market by 2031?
It is forecast at USD 7.96 billion, rising from USD 6.69 billion in 2026.
Which segment records the fastest growth through 2031 in Kazakhstan?
Offshore developments expand at a 5.25% CAGR, led by the Kashagan Phase-2 program.
How significant is natural gas in Kazakhstan's upstream portfolio?
Natural gas represents 30.42% of 2025 revenue and grows 4.85% annually on new processing capacity.
What tax incentives support mature-field recovery in Kazakhstan?
The 2024 Enhanced Contract Model halves corporate tax for projects deploying CO?-EOR, polymer flooding and related techniques.
How is Kazakhstan reducing reliance on Russian export routes?
Capacity on the Kazakhstan-China Pipeline climbs to 25 million t by 2027, lowering Russian route dependency from 85% to about 75% by 2030.
What is the outlook for decommissioning services?
They hold 14.20% share today and rise 5.4% annually through 2031 as 2,500 wells need abandonment by 2030.