
Kaposi Sarcoma Market Size and Share
Market Overview
| Study Period | 2020 - 2031 |
|---|---|
| Market Size (2026) | USD 150.41 Million |
| Market Size (2031) | USD 183.34 Million |
| Growth Rate (2026 - 2031) | 4.04 % |
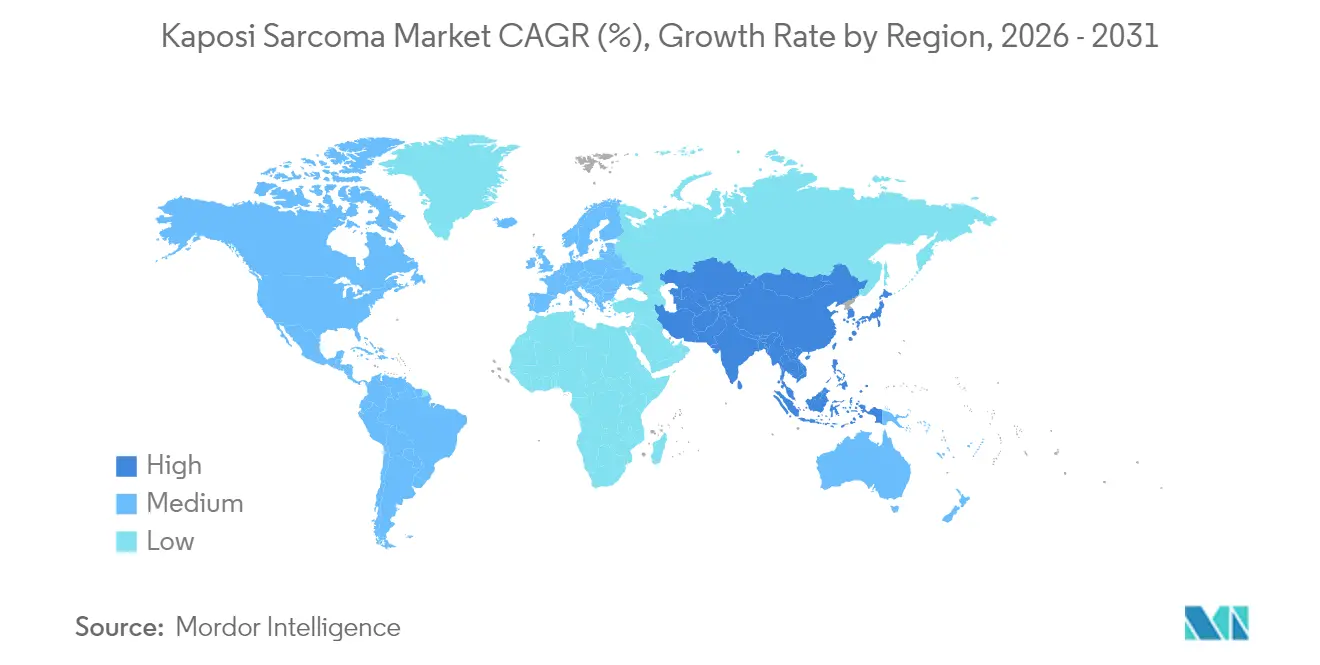
| Fastest Growing Market | Asia-Pacific |
| Largest Market | North America |
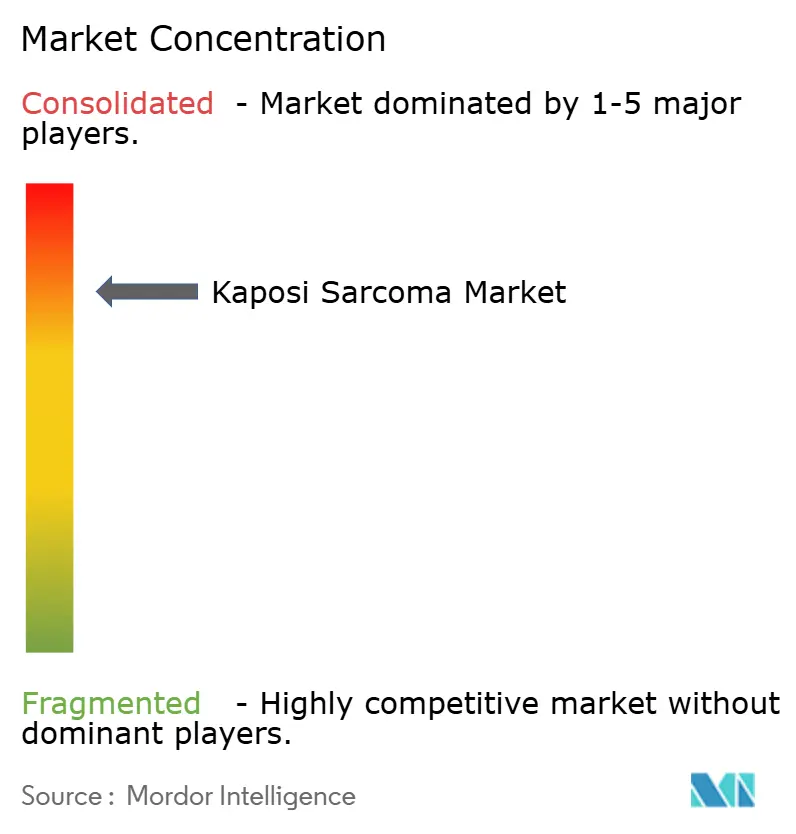
| Market Concentration | High |
Major Players *Disclaimer: Major Players sorted in no particular order Image © Mordor Intelligence. Reuse requires attribution under CC BY 4.0. | |
Kaposi Sarcoma Market Analysis by Mordor Intelligence
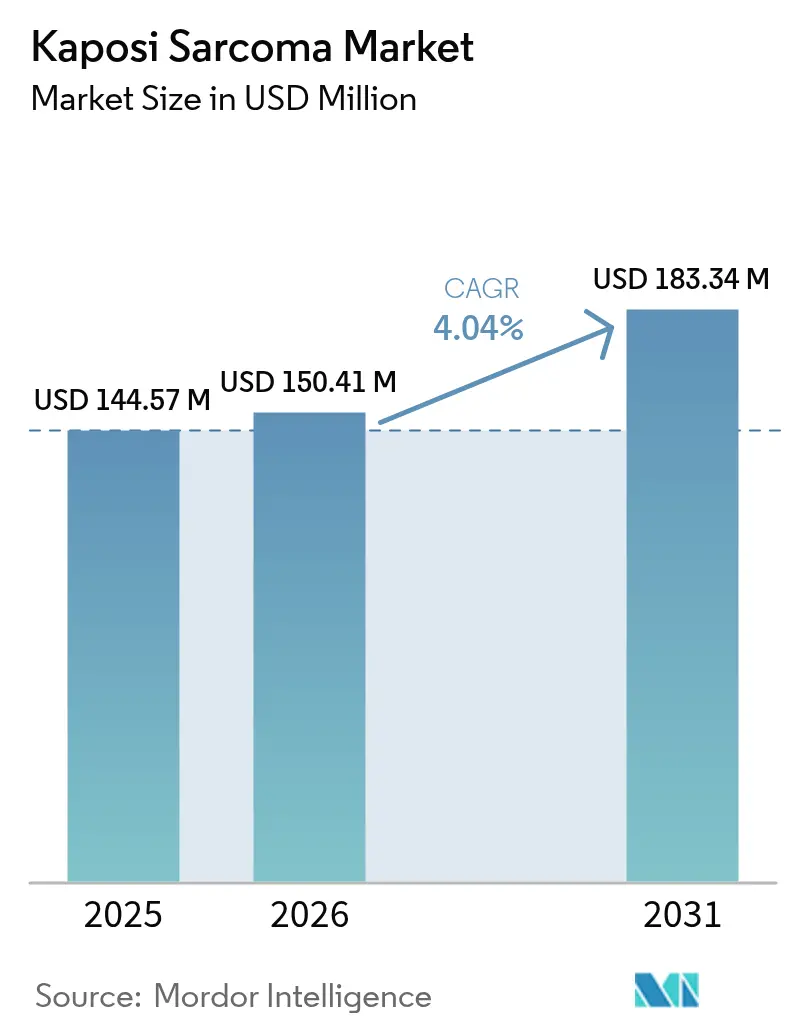
Kaposi's Sarcoma market size in 2026 is estimated at USD 150.41 million, growing from 2025 value of USD 144.57 million with 2031 projections showing USD 183.34 million, growing at 4.04% CAGR over 2026-2031. Demand is guided more by precision-medicine advances than by sheer patient volume, so growth remains steady rather than explosive. Rising incidence among immuno-compromised populations, wider use of pegylated liposomal anthracyclines, and pipeline immune-checkpoint inhibitors together reinforce this upward trajectory, while cold-chain gaps and reimbursement headwinds temper the pace. Consolidation among leading oncology businesses is intensifying, with big-ticket acquisitions exceeding USD 10 billion in 2024 alone. Simultaneously, cell-based gene therapies and AI-driven pathology platforms are shortening diagnostic lead-times, unlocking earlier intervention opportunities that further expand the addressable patient pool.
Key Report Takeaways
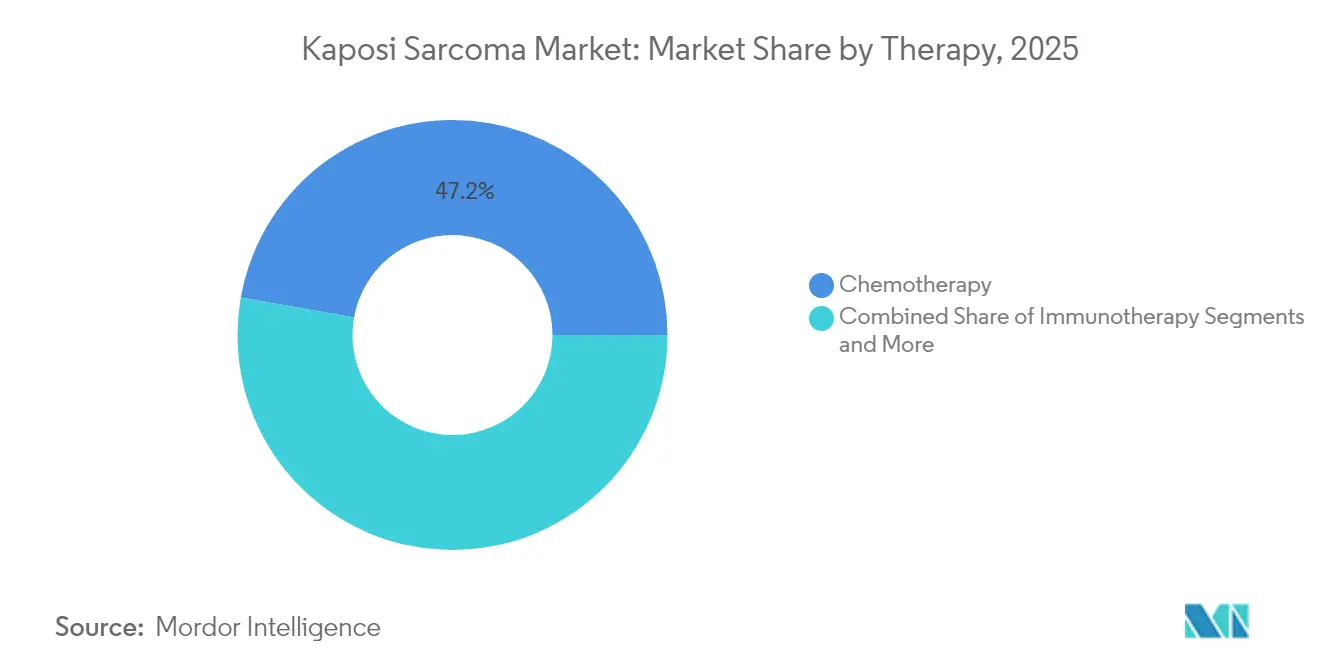
- By therapy, chemotherapy led with 47.21% of Kaposi's Sarcoma market share in 2025, while immunotherapy shows the fastest 5.26% CAGR through 2031.
- By route, intravenous products accounted for 61.55% of the Kaposi's Sarcoma market size in 2025; oral formulations are rising at a 5.64% CAGR to 2031.
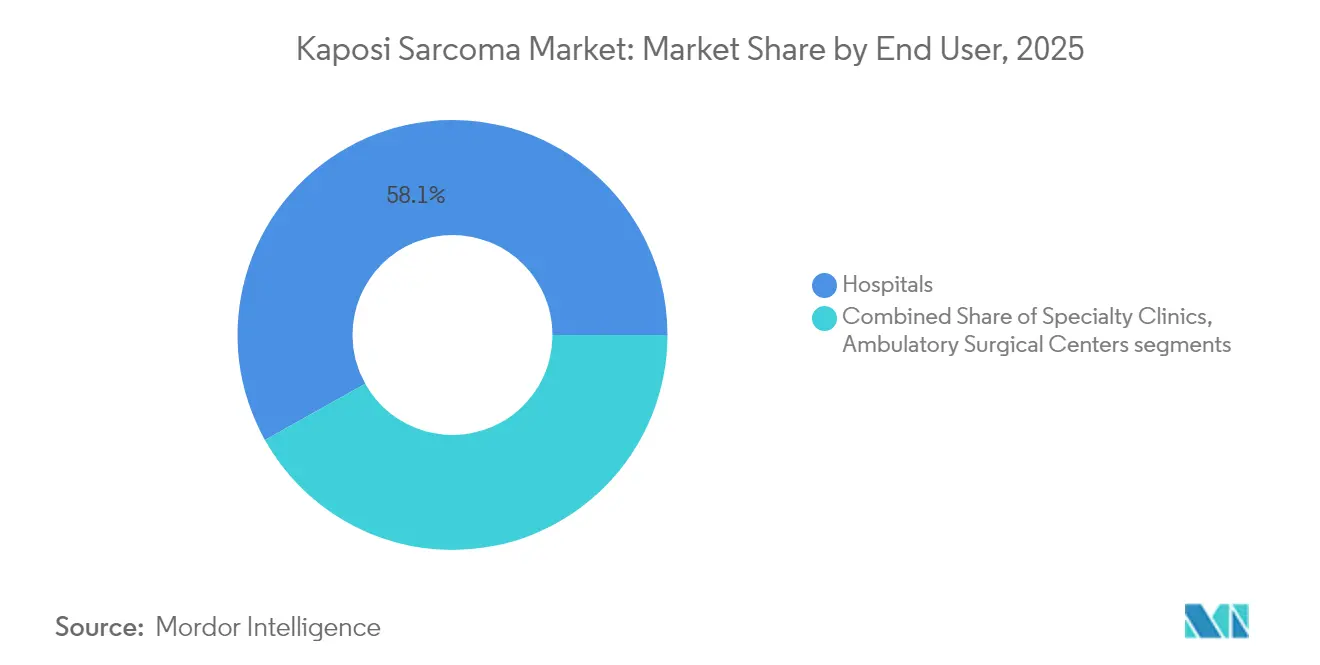
- By end user, hospitals held 58.12% revenue share in 2025; ambulatory surgical centers post the highest 5.97% CAGR through 2031.
- By region, North America commanded 39.25% share in 2025; Asia-Pacific is set to expand at a 6.49% CAGR to 2031.
Note: Market size and forecast figures in this report are generated using Mordor Intelligence’s proprietary estimation framework, updated with the latest available data and insights as of 2026.
Market Trends and Insights
Drivers Impact Analysis of Kaposi Sarcoma Market*
| Driver | (~) % Impact on CAGR Forecast | Geographic Relevance | Impact Timeline |
|---|---|---|---|
| Rising incidence among immuno-compromised populations | +1.2% | Global, concentrated in sub-Saharan Africa and urban centers | Medium term (2-4 years) |
| Wider uptake of liposomal anthracyclines in first-line therapy | +0.8% | North America & EU, expanding to Asia-Pacific | Short term (≤ 2 years) |
| Growing access to antiretroviral therapy in LMICs | +0.7% | Sub-Saharan Africa, Southeast Asia, Latin America | Long term (≥ 4 years) |
| Pipeline of immune-checkpoint inhibitors targeting HHV-8 | +0.6% | Global, early gains in North America and Europe | Long term (≥ 4 years) |
| AI-driven histopathology workflows shortening diagnostic lead-time | +0.4% | Developed markets, gradual LMIC adoption | Medium term (2-4 years) |
| Cell-based gene therapies entering early-phase trials | +0.3% | North America, EU, select Asia-Pacific centers | Long term (≥ 4 years) |
| Source: Mordor Intelligence | |||
Rising Incidence Among Immuno-Compromised Populations
Escalating numbers of immune-compromised patients—kidney transplant recipients, individuals on biologic immunosuppressants, and long-COVID sufferers—are broadening the Kaposi's Sarcoma market beyond the historical HIV cohort. Kidney transplant recipients face added complexity because standard antirejection drugs dampen tumor immunity, creating demand for regimens that balance graft protection with oncologic control. Emergent data on post-viral immune dysregulation following COVID-19 further enlarges the patient universe, prompting oncologists to adapt treatment pathways.
Wider Uptake of Liposomal Anthracyclines in First-Line Therapy
Pegylated liposomal doxorubicin has become the preferred first-line agent because it decreases cardiotoxicity while sustaining antitumor potency. Three-decade follow-up confirms durable efficacy, and multiple European approvals such as Celdoxome and Myocet have fostered competition that is nudging prices downward. Expanded formulary availability in Asia-Pacific hospitals is accelerating uptake, and U.S. payers increasingly authorize outpatient administration, trimming facility overheads.
Growing Access to Antiretroviral Therapy in LMICs
Rapid ART rollout has dropped HIV-related Kaposi’s incidence, yet the larger pool of virally suppressed survivors needs lifelong cancer surveillance. Viral resistance rates up to 19.6% for dolutegravir threaten rebound risk, keeping Kaposi’s vigilance high. Zimbabwe’s attainment of WHO maturity level 3 exemplifies regulatory capacity gains that enable broader oncology drug importation[1].
Pipeline of Immune-Checkpoint Inhibitors Targeting HHV-8
Nivolumab plus pomalidomide trials show early tumor regression in virus-associated sarcomas, signaling a breakaway from chemotherapy dependence. The National Cancer Institute has earmarked USD 3 million for HHV-8 vaccine investigation, underscoring government resolve to shift toward prophylaxis.
Restraints Impact Analysis of Kaposi Sarcoma Market*
| Restraint | (~) % Impact on CAGR Forecast | Geographic Relevance | Impact Timeline |
|---|---|---|---|
| High toxicity profile of existing chemotherapies | -0.9% | Global, particularly affecting elderly populations | Short term (≤ 2 years) |
| Scarcity of validated surrogate endpoints for rare-tumor trials | -0.6% | Global, regulatory impact in all major markets | Medium term (2-4 years) |
| Limited reimbursement outside HIV-associated cases | -0.5% | North America, EU, select Asia-Pacific markets | Medium term (2-4 years) |
| Cold-chain gaps in endemic African regions | -0.4% | Sub-Saharan Africa, rural areas in LMICs | Long term (≥ 4 years) |
| Source: Mordor Intelligence | |||
High Toxicity Profile of Existing Chemotherapies
Cumulative doxorubicin exposure above 450 mg/m² elevates congestive-heart-failure risk to 11%, forcing shorter regimens or cardioprotective measures that raise treatment cost. Pegylated formulations reduce exposure yet hand-foot syndrome causes dose interruptions in up to 40% of recipients, curbing real-world effectiveness. Such toxicity concerns push oncologists toward immunotherapies, but access remains uneven.
Limited Reimbursement Outside HIV-Associated Cases
Coverage gaps for classic Kaposi’s cases complicate therapy initiation. Payer tactics such as white-bagging cut physician margins by more than USD 2,000 per infusion and inflate patient copays, discouraging use of premium agents. Medicare’s pending G2211 removal exemplifies shrinking reimbursement windows for complex oncology visits.
*Our forecasts treat driver/restraint impacts as directional, not additive. The impact forecasts reflect baseline growth, mix effects, and variable interactions.
Kaposi Sarcoma Market Segment Analysis
By Therapy:
Immunotherapy Gains Ground Despite Chemotherapy DominanceChemotherapy anchored almost half of 2025 revenue, yet its growth has slowed as clinicians seek safer long-term strategies. Liposomal anthracyclines continue to dominate first-line use because of strong data and broad formulary coverage, keeping the Kaposi's Sarcoma market firmly grounded in cytotoxic approaches. Even so, immune-checkpoint drugs, especially PD-1 inhibitors, are demonstrating durable responses in refractory disease, elevating their share in trial enrollment lists. Bioscience investors have responded by directing capital toward antibody engineering and T-cell activation platforms, suggesting a structural tilt toward immunotherapy over the forecast window.
Immunotherapy’s 5.26% CAGR reflects both scientific progress and practical convenience. Subcutaneous nivolumab, cleared in December 2024, trims chair time from hours to minutes, allowing outpatient centers to treat additional patients per day. These operational efficiencies resonate with health systems pivoting from inpatient infusions. Consequently, immunotherapy’s contribution to the Kaposi's Sarcoma market size is expected to swell from the mid-teens today to more than one-quarter by 2031, accelerating overall revenue momentum without materially lifting patient counts.

By Route of Administration:
Oral Formulations Challenge IV DominanceIntravenous delivery still governs 61.55% of the Kaposi's Sarcoma market size in 2025 thanks to entrenched hospital protocols and payer familiarity. Pegylated liposomal doxorubicin and paclitaxel rely on controlled infusion rates to mitigate acute side-effects, locking huge volumes into infusion suites. Yet, oral molecules—particularly thalidomide analogues and next-generation antivirals—are coming on strong, growing 5.64% annually until 2031. Telehealth monitoring and digital adherence tools cut the perceived risk of outpatient dosing, encouraging physicians to switch stable patients. With Medicare requiring National Drug Code submission for oral oncologics from 2025, compliance is expected to standardize billing practices, further easing uptake .
Despite convenience gains, IV formulations are unlikely to collapse quickly; many late-stage candidates, including cell-based therapies, still necessitate controlled administration. Nonetheless, every incremental shift toward tablets erodes infusion-center volume, signaling gradual realignment of ancillary service revenues across the Kaposi's Sarcoma industry.
By End User:
Ambulatory Centers Capitalize on Outpatient TrendHospitals retained 58.12% share in 2025 because complex cases often demand multidisciplinary oversight and intensive supportive care. However, payer pressure to subdue facility fees is pushing lower-acuity infusions into ambulatory surgical centers, where streamlined staffing and shorter stays reduce cost per episode. This migration supports a 5.97% CAGR for ambulatory facilities, making them the fastest-growing channel within the Kaposi's Sarcoma market. Specialty oncology clinics occupy a strategic niche, leveraging deep disease-area expertise without the overhead of tertiary hospitals. Tele-oncology check-ins, adopted widely during the COVID-19 pandemic, are now standard for routine follow-up, allowing high-risk patients to avoid unnecessary in-person visits.
Long term, payer reimbursement algorithms may steer more care toward bundled outpatient packages, but hospitals are evolving too. Many academic centers are spinning off satellite infusion units and partnering with home-care firms to retain patient flows, demonstrating that competition for site-of-care share is dynamic rather than zero-sum.
Geography Analysis
North America Kaposi Sarcoma Market
North America generated 39.25% of 2025 revenue, supported by mature insurance coverage, sophisticated clinical trial infrastructure, and early approval of novel agents . Yet, cost containment policies are hardening. Medicare drug-price negotiations under the Inflation Reduction Act, while easing patient out-of-pocket burdens, cloud manufacturers’ pricing power, nudging some firms to delay launches until clearer guidance emerges.
APAC Kaposi Sarcoma Market
Asia-Pacific posts the leading 6.49% CAGR through 2031 thanks to improved HIV outreach, upgraded regulatory regimes, and aggressive hospital build-outs. China’s rising oncology budget under the 14th Five-Year Plan and India’s expansion of National AIDS Control Programme facilities are catalyzing demand. However, rural-urban disparities persist: cold-chain networks struggle in remote provinces, limiting high-value biologic penetration. Innovative value-based agreements, already piloted in Singapore and South Korea, may mitigate affordability gaps as regional payers experiment with outcome-linked pricing.
Europe Kaposi Sarcoma Market
Europe maintains steady, mid-single-digit growth, underpinned by compulsory insurance systems that guarantee broad access but also enforce strict cost-effectiveness thresholds. Uptake of biosimilar pegylated liposomal doxorubicin has delivered double-digit savings for national health funds, freeing resources for immune-checkpoint therapies. Post-Brexit regulatory adjustments require parallel submissions to both EMA and MHRA, adding administrative cost that smaller biotech firms sometimes struggle to absorb, subtly consolidating launch activity among larger multinationals.
Regulatory Landscape
Regulation for Kaposi sarcoma therapeutics generally follows established oncology and HIV-oncology oversight in major markets, with approvals, labeling controls, and pharmacovigilance anchored by agencies such as the US FDA and the European Medicines Agency (EMA). In the EU, EMA marketing authorizations covering pegylated liposomal doxorubicin products (for example, Zolsketil and Caelyx) and the topical retinoid alitretinoin (Panretin) help define the on-label framework for classic and AIDS-related disease management across member states.
Across jurisdictions, ongoing safety surveillance and periodic label updates for antineoplastic and immunosuppressive agents shape clinical risk management, since iatrogenic Kaposi sarcoma can emerge in immune-suppressed populations. In the United Kingdom, UK Health Security Agency (UKHSA) and its SaBTO virology subcommittee have issued recommendations addressing Kaposi sarcoma-associated herpesvirus (KSHV) infection considerations in healthcare settings, including donor and procedure-related transmission risk. These steps reinforce the role of public health bodies in setting operational safeguards that intersect with transplant and oncology pathways.
Value Chain Analysis
The value chain begins with discovery and translational research in academic cancer centers and government-backed programs, then moves into early clinical development that often repurposes established oncology and immunomodulatory backbones for a rare-tumor setting. A recent example is the UNC Lineberger Kaposi sarcoma mouse model work, which is designed to accelerate preclinical screening of new angiogenesis and virus-associated mechanisms and helps move candidates into investigator-sponsored and cooperative-group trials.
Manufacturing and supply are dominated by complex injectables and biologics that require sterile fill-finish and reliable cold-chain handling, which becomes a limiting step in endemic and resource-constrained regions. Commercialization flows primarily through hospital and outpatient infusion channels, while reimbursement policy and site-of-care steering influence demand. Oral agents, including immunomodulatory therapies, can shift more volume into specialty pharmacy distribution. On the standards and access side, the chain is supported by established reference pathways and regulatory precedents such as the FDA approval of Bristol Myers Squibb's pomalidomide (Pomalyst) for AIDS-related and HIV-negative Kaposi sarcoma after HAART failure, which provides a template for evidence generation, labeling, and post-marketing safety obligations in this rare indication.
Competitive Landscape
The Kaposi's Sarcoma market is moderately consolidated, with the top companies accounting for roughly half of global revenue. Bristol Myers Squibb’s USD 4.8 billion Mirati purchase and AstraZeneca’s USD 2 billion Fusion buyout underline industry appetite for differentiated oncology assets. Merck’s latest deal for an anti-PD-1/VEGF bispecific antibody positions it to challenge Bristol in combination immunotherapy, while Gilead is leveraging its antiviral heritage to develop dual-pathway agents that both suppress HHV-8 replication and stimulate T-cell function.
Technology adoption differentiates leaders. AI-enhanced digital pathology networks at institutions partnered with Johnson & Johnson reduce biopsy-to-report cycles by 50%, accelerating time to first treatment and effectively boosting drug volume per patient year. Sanofi’s EUR 300 million radioligand collaboration with Orano Med targets rare HHV-8-positive tumors, positioning the company in a subsegment with limited competition.
Emerging challengers like Nuvation Bio and Regeneron are advancing precision biologics that hit viral epitopes unique to Kaposi’s Sarcoma. Although these firms currently lack the commercial muscle of incumbents, partnership deal flow suggests incumbents may license or acquire promising candidates, tightening consolidation further.
Kaposi Sarcoma Industry Leaders
-
Bristol-Myers Squibb
-
Merck & Co., Inc
-
Pfizer Inc.
-
Navidea Biopharmaceuticals, Inc.
-
Baxter Inc.
- *Disclaimer: Major Players sorted in no particular order
Kaposi Sarcoma Market Companies Covered in this Report
- Bristol-Myers Squibb
- Gilead Sciences
- F-Hoffmann-La Roche
- Takeda Pharmaceuticals
- Merck
- Pfizer
- Johnson & Johnson
- Abbvie
- Celltrion
- Viatris
- Novartis
- AstraZeneca
- Eli Lilly and Company
- Sanofi
- Cipla
- Dr. Reddy’s Laboratories
- Lupin
- Sun Pharmaceuticals Industries
- Hikma Pharmaceuticals
Market Opportunities and Future Outlook
A clear opportunity lies in therapies for cART/HAART-refractory disease and immune non-response in HIV-associated Kaposi sarcoma, where current options are constrained by chemotherapy toxicity and uneven payer coverage outside HIV-associated cases. Government and cooperative-group activity also provides near-term evidence of investment: in April 2026, the National Cancer Institute initiated the REGIMENKS HIV Phase II study evaluating recombinant glycosylated human interleukin-7 (CYT107) for HIV-associated Kaposi sarcoma (NCT07308886), targeting immune reconstitution as a treatment lever.
Another whitespace area is diversification beyond cytotoxic infusions into targeted, mechanism-driven regimens, such as Notch pathway modulation via gamma-secretase inhibition and other tumor-microenvironment approaches. These can be tested in smaller, biomarker-enriched trials. The AIDS Malignancy Consortium lists a Phase II study of nirogacestat in Kaposi sarcoma with a scheduled start in September 2026 (NCT07539454), showing continued momentum in targeted classes and creating partnering and licensing openings for developers seeking differentiated safety, convenient administration, or combination-friendly profiles for outpatient settings.
Recent Industry Developments in Kaposi Sarcoma Market
- April 2026: Merck & Co. announced a tender offer to acquire Terns Pharmaceuticals, with the transaction described as expected to close in May 2026. The deal adds pipeline capacity and reflects continued large-cap appetite for bolstering oncology and adjacent immunology portfolios, which can influence competitive intensity for checkpoint and combination strategies used across solid tumors, including rare sarcomas.
- January 2025: The FDA cleared fam-trastuzumab deruxtecan-nxki for HER2-low breast cancer, reinforcing the momentum behind antibody-drug conjugate platforms. Platform advances in payloads, linker chemistry, and safety management can be translated into rare-tumor development programs where differentiation versus chemotherapy is a key commercial driver.
- May 2024: UNC Lineberger Comprehensive Cancer Center unveiled a mouse model for Kaposi sarcoma to support testing of candidate therapies in a disease-relevant setting. This preclinical capability strengthens translational throughput for angiogenesis and virus-associated mechanisms and can shorten the path from laboratory findings to clinical trial design in a rare-cancer market.
Kaposi Sarcoma Market Report Scope and Research Methodology
Market Definition and Coverage
This market covers the yearly revenue linked to treating Kaposi sarcoma, counted across drug therapy plus procedure-led care used specifically for this disease. The totals are built for the major geographies tracked in the study and are expressed in USD for the stated year.
Scope exclusions: Routine HIV antiretroviral therapy used only for viral control and palliative wound-care consumables are excluded from this market sizing.
Segments Covered in This Report
- By Therapy
- Chemotherapy
- Immunotherapy
- Antiviral Therapy (HAART)
- Targeted/Precision Therapies
- By Route of Administration
- Intravenous
- Oral
- Topical
- By End User
- Hospitals
- Specialty Clinics
- Ambulatory Surgical Centers
- By Geography
- North America
- United States
- Canada
- Mexico
- Europe
- Germany
- United Kingdom
- France
- Italy
- Spain
- Rest of Europe
- Asia-Pacific
- China
- India
- Japan
- South Korea
- Australia
- Rest of Asia-Pacific
- South America
- Brazil
- Argentina
- Rest of South America
- Middle East and Africa
- GCC
- South Africa
- Rest of Middle East and Africa
- North America
Data Sources, Market Sizing, and Validation
Desk Research
Desk research was used to set the disease and treatment context, then to anchor the model inputs that tend to move Kaposi sarcoma revenue over time. We referenced public health and oncology sources such as the World Health Organization, the US CDC, the National Cancer Institute, and peer-reviewed clinical literature to understand incidence patterns in immunocompromised cohorts and the typical care pathway.
To keep assumptions realistic, supporting inputs were checked using sources such as regulatory drug labels and FDA public databases for approved indications, country health ministry publications where available, and trade statistics to sanity check medicine availability and cross-border flows. We also reviewed company filings, investor presentations, and reputable medical press for pricing and access signals. When the public record for a specific item was thin, we selectively used paid subscriptions for company financials and patent databases. These sources are illustrative, and many other references were used for data collection, validation, and clarification during the work.
Primary Interviews and Surveys
Primary work focused on validating how patients move from diagnosis to therapy choice, and how often procedure-led care is actually billed within Kaposi sarcoma management in each region. We spoke with a mix of clinicians, hospital pharmacy and procurement staff, payor and reimbursement specialists, and product and commercial leaders to pressure test uptake, pricing corridors, and access barriers across APAC, EMEA, and the Americas.
Distribution of primary research fieldwork respondents
| Company type | Respondent position | Region |
|---|---|---|
| Top tier: 28% | CXOs: 17% | APAC: 42% |
| Mid tier: 55% | Functional/Unit leaders: 24% | EMEA: 31% |
| Smaller Players: 17% | Managers: 59% | Americas: 27% |
Market-Sizing & Forecasting
Sizing starts with a top-down demand pool build that links Kaposi sarcoma case load to treated share, then to typical therapy and procedure use, which is converted to value using price proxies by region. The model is cross-checked with selective bottom-up approximations, such as sampled regimen cost times expected patient volumes and channel checks on availability, so totals can be adjusted when implied utilization looks unrealistic.
Inputs that matter in this market include Kaposi sarcoma incidence within HIV and other immunosuppressed populations, HAART coverage levels that influence disease control, adoption of pegylated liposomal anthracyclines and newer immunotherapy use, radiotherapy utilization rates in oncology centers, and regional reimbursement and tender dynamics that can compress or expand realized pricing. For forecasting, scenario analysis is used around treatment uptake and access, and then the trajectory is smoothed using simple time series logic so short-term shocks do not overstate long-run growth. Where country-level data is sparse, gaps are filled using proxy markets with similar HIV burden and care infrastructure, followed by expert checks before numbers are finalized.
Data Validation & Update Cycle
Validation is done by triangulating market outputs against independent signals, including epidemiology directionality, therapy uptake narratives from interviews, and whether implied spend per treated patient stays within believable bounds. Any sharp variances by region are reviewed, and we re-contact experts when assumptions on access, procedure use, or price timing appear misaligned.
Before sign-off, the model and key assumptions go through multi-step analyst review to catch calculation errors and scope leakage early. The report is refreshed annually, and it is also updated when a material event occurs, such as a major guideline shift, a meaningful price change, or a therapy access expansion. Right before delivery, a final pass is completed so clients receive the latest view available at that time.
Mordor Intelligence's Kaposi Sarcoma Market Estimate Compared With Other Published Estimates
Published market sizes for Kaposi sarcoma do not always line up because teams choose different boundaries for what counts as the market, and they also use different timing for currency conversion and price updates. Differences can also show up when one study models only therapeutics while another folds in diagnostics, which changes the numerator.
The table highlights how scope and base year choices can move the final number, even when the disease focus is the same. The table shows a tighter spread once procedure-linked treatment revenue is kept in scope and purely diagnostic testing is kept out. In Mordor Intelligence's model, this is handled by counting radiotherapy fractions and curative surgical procedures alongside branded and generic drugs, with routine HIV therapy excluded when it is not prescribed for Kaposi sarcoma control.
Benchmark comparison
| Source | Market Size | Gaps in Research Methodology |
|---|---|---|
| Mordor Intelligence | USD 150.41 M (2026) | |
| Global Publisher A | USD 160.65 M (2026) | This estimate appears to lean more heavily toward a therapeutics-only build, and it is not clear whether radiotherapy and curative procedure revenue is included in the same way, which can lift or lower totals depending on local care patterns. |
| Healthcare Publisher B | USD 110.48 M (2022) | The scope explicitly includes diagnostics along with treatment, and the stated base year is earlier, so the value is not directly comparable to later-year treatment-weighted totals without adjusting for year and what is counted as market revenue. |
When you line up the year and the scope, most of the gap becomes explainable through what gets counted as Kaposi sarcoma revenue and how the price year is set. Our approach stays traceable to clear care-pathway variables, which makes it easier to reproduce the sizing logic and update it when utilization or access changes.
Key Questions Answered in the Report
Q1. What factors chiefly propel the Kaposi's Sarcoma market?
Most momentum stems from rising immuno-compromised patient numbers, increasing adoption of liposomal anthracyclines, and broadening access to ART in low- and middle-income nations. Additional lift comes from checkpoint-inhibitor pipelines and AI-enabled diagnostics that shorten time to treatment.
Q2. Which therapy category is expanding fastest?
Immunotherapy grows at 5.26% annually through 2031 as PD-1 inhibitors and novel bispecific antibodies deliver durable responses with milder side-effect profiles than chemotherapy.
Q3. Where do reimbursement barriers most hinder uptake?
Coverage remains restricted for non-HIV-associated Kaposi’s cases in the United States and parts of Europe, while insurer practices such as white-bagging further squeeze provider economics.
Q4. How is site-of-care shifting?
Ambulatory surgical centers record the highest 5.97% CAGR because payers prefer lower facility costs and patients value shorter visits; hospitals, however, retain complex case management.
Q5. Which region leads future growth?
Asia-Pacific is forecast to climb 6.49% annually, driven by improved HIV programs, regulatory modernization, and expanding oncology infrastructure.