
Kaolin Market Size and Share
Market Overview
| Study Period | 2021 - 2031 |
|---|---|
| Market Volume (2026) | 49.46 Million tons |
| Market Volume (2031) | 60.87 Million tons |
| Growth Rate (2026 - 2031) | 4.24 % |
| Fastest Growing Market | Asia-Pacific |
| Largest Market | Asia-Pacific |
| Market Concentration | Medium |
Major Players
*Disclaimer: Major Players sorted in no particular order Image © Mordor Intelligence. Reuse requires attribution under CC BY 4.0. |
|
Kaolin Market Analysis by Mordor Intelligence
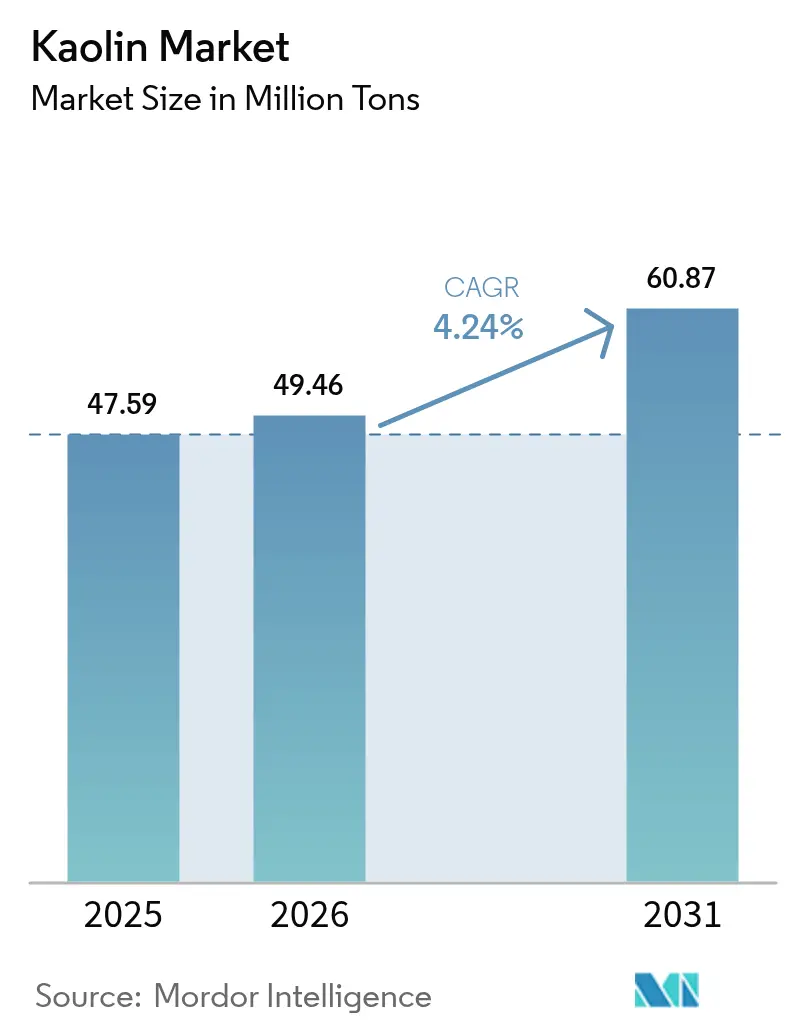
The Kaolin Market size is expected to grow from 47.59 Million tons in 2025 to 49.46 Million tons in 2026 and is forecast to reach 60.87 Million tons by 2031 at 4.24% CAGR over 2026-2031. Asia-Pacific’s structural pivot toward sanitary-ware and tile manufacturing, battery-separator adoption in electric-vehicle supply chains, and ongoing substitution of titanium dioxide in architectural coatings anchor the upward trajectory of the kaolin market. Processed grades command price premiums because magnetic separation, calcination, and surface treatments yield high-brightness products required in advanced ceramics, packaging papers, and Li-ion battery components. Cost inflation in energy markets raises barriers for European calciners, handing a comparative advantage to North American and Asian producers with cheaper feedstocks. Private-equity interest, exemplified by Platinum Equity’s February 2024 acquisition of Imerys Performance Minerals Americas, is reshaping competitive dynamics by prioritizing operational efficiencies and cash generation. Environmental compliance—ranging from EPA NPDES effluent limits to EU carbon-pricing schemes—remains a decisive factor that can either accelerate beneficiation investments or delay greenfield mines, depending on geography.
Key Report Takeaways
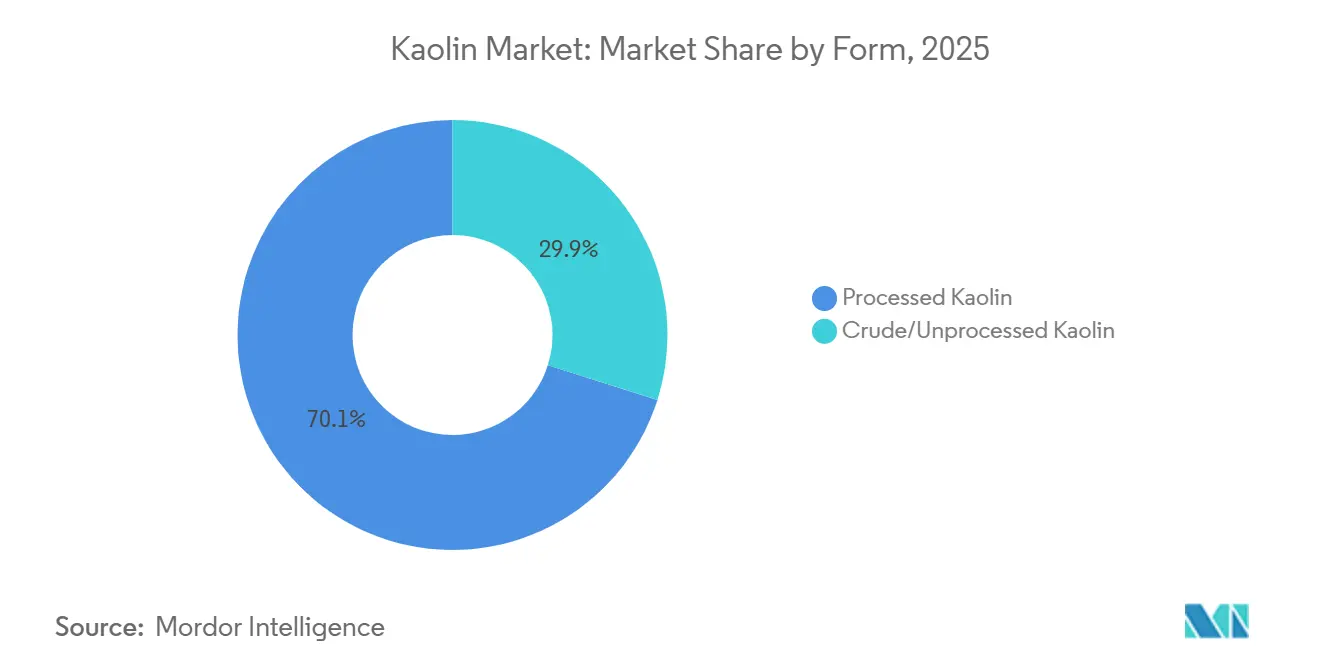
- By form, processed kaolin led with 70.12% of the kaolin market share in 2025, while crude/unprocessed kaolin recorded the fastest projected CAGR at a 4.89% through 2031.
- By grade, hydrous kaolin accounted for 55.45% of the kaolin market share in 2025 and calcined kaolin is advancing at a 4.75% CAGR during 2026-2031.
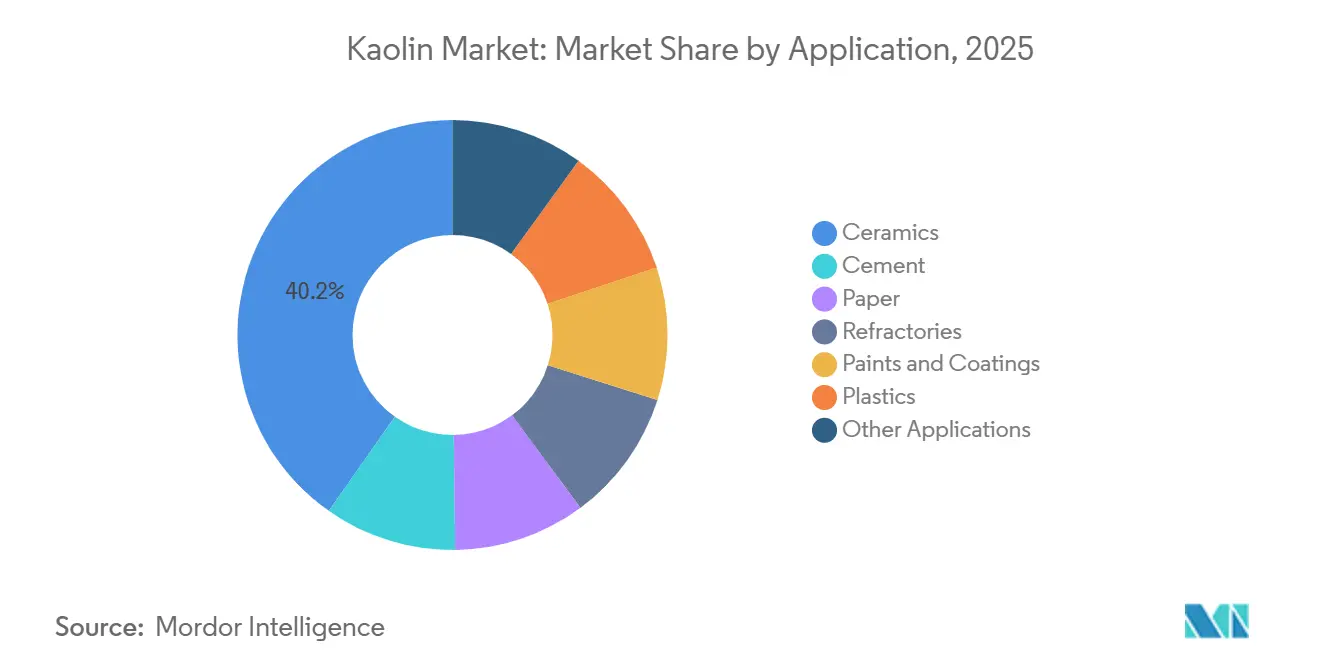
- By application, ceramics held 40.23% of the kaolin market share in 2025 and is forecast to expand at a 4.97% CAGR to 2031.
- By geography, Asia-Pacific captured 43.26% of the kaolin market share in 2025 and is forecast to grow at a 4.94% CAGR through 2031.
Note: Market size and forecast figures in this report are generated using Mordor Intelligence’s proprietary estimation framework, updated with the latest available data and insights as of 2026.
Market Trends and Insights
Drivers Impact Analysis of Kaolin Market*
| Driver | (~) % Impact on CAGR Forecast | Geographic Relevance | Impact Timeline |
|---|---|---|---|
| Booming sanitary-ware and tile manufacturing | +1.8% | Asia-Pacific core, spillover to MEA | Short term (≤ 2 years) |
| Shift to high-brightness packaging paper | +0.9% | Global, concentrated in North America and EU | Medium term (2-4 years) |
| Growing demand from paper and rubber industries | +0.7% | Global | Short term (≤ 2 years) |
| Cosmetics and personal-care industry growth | +0.4% | Global, concentrated in Asia-Pacific, North America, EU | Medium term (2-4 years) |
| Rapid adoption of calcined kaolin in Li-ion battery separator coatings | +0.6% | Asia-Pacific, North America | Medium term (2-4 years) |
| Source: Mordor Intelligence | |||
Booming Sanitary-Ware and Tile Manufacturing
China’s tile output exceeds 5 billion m² annually, consuming 12-15 million tons of kaolin, while India’s march toward 3 billion m² by 2026 could lift domestic demand by another 1.5-2 million tons. The mismatch between India’s 8.3 million tons of crude extraction and just 73,000 tons of processing capacity forces tile makers to import high-brightness grades from Malaysia and Indonesia, inflating landed costs by 12-18%. Indonesia and Vietnam are scaling sanitary-ware output to serve mega-projects in the Middle-East, including Saudi Vision 2030 requirements for 8-10 million fixtures. Premium vitreous-china lines require kaolin with less than 1.5% Fe₂O₃, tightening regional supply and driving spot prices for 90%+ brightness grades 22-25% higher since early 2024. Russia’s own shift toward import substitution added another 1 million tons of kaolin demand between 2019 and 2022.
Shift to High-Brightness Packaging Paper
Phasing out PFAS in food-contact paper propels mills to thicken mineral coatings for barrier performance[1]. Kaolin’s plate-like structure enhances printability, but digital inkjet now represents 35-40% of packaging print volume and prefers calcium carbonate’s greater opacity, trimming kaolin’s share to 50-55% in 2025. Delaminated kaolin, just 8-10% of total volume, earns 15-20% premiums for luxury paper stocks, specifically in cosmetics and spirits packaging. Hybrid kaolin-carbonate blends reduced pure-kaolin coat weights by roughly one-third in U.S. and EU mills; however, new Asian machines still specify kaolin-heavy formulations due to sparse carbonate supply chains.
Growing Demand from Paper and Rubber Industries
Global tire output of 1.8 billion units incorporates 3-4 million tons of kaolin, mainly as a semi-reinforcing filler that improves tear and abrasion resistance without the high cost of precipitated silica. Electric-vehicle tires load more kaolin to offset vehicle lightweighting trends. India’s tire sector, rising 7-9% annually, sources from domestic suppliers Ashapura and 20 Microns, which export up to half their kaolin output to Southeast Asia. Specialty paper grades—filtration, medical packaging—need calcined kaolin for low abrasivity, cushioning the kaolin market against graphic-paper declines in Europe and North America.
Rapid Adoption of Calcined Kaolin in Li-ion Battery Separator Coatings
Ceramic-coated separators raise thermal stability and block dendrites in high-energy cells. Calcined kaolin costs USD 800-1,200 per ton versus alumina at USD 1,500-2,200, offering gigafactories a cheaper pathway to meet IEC 62660 safety norms. Facilities in Poland, Michigan, and Jiangsu are qualifying 3-5 g/m² coatings that could need 50,000-. Halloysite sourced from Idaho is also under pilot trials, but volumes remain below 5,000 tons per year.
Restraints Impact Analysis of Kaolin Market*
| Restraint | (~) % Impact on CAGR Forecast | Geographic Relevance | Impact Timeline |
|---|---|---|---|
| High energy intensity and cost inflation in calcination | -0.8% | Global, acute in Europe and North America | Short term (≤ 2 years) |
| Stringent mine-site environmental permitting | -0.4% | North America, Europe, Australia | Long term (≥ 4 years) |
| Substitution risk from high-opacity calcium carbonates in digital-print papers | -0.4% | Global, concentrated in North America and EU | Medium term (2-4 years) |
| Source: Mordor Intelligence | |||
High Energy Intensity and Cost Inflation in Calcination
Flash calcination needs 1.2-1.5 MMBtu per ton, leaving producers exposed to natural-gas volatility. Europe’s TTF prices hovered at EUR 35-45 / MWh in 2025, up from EUR 15-20 pre-2022, forcing Sibelco and Imerys to idle 15-20% capacity or raise prices 15-20%. Carbon costs under the EU-ETS add EUR 10-15 per ton of calcined kaolin. U.S. PPI data show kaolin prices rising 18.6% between December 2022 and September 2025 as utilities passed through surcharges. Customers resist further hikes, accelerating partial substitution by calcium carbonate.
Stringent Mine-Site Environmental Permitting
EPA NPDES permits cap TSS at 30 mg/L and selenium at 5 µg/L, adding USD 5-10 million in clarifiers and RO systems per U.S. mine. EU REACH bans nonylphenol ethoxylate dispersants, driving up chemical costs 20-30% and trimming throughput 5-8%. Brazil’s Amazon deposits remain stranded because of indigenous land rights protections despite 200-300 million tons of reserves[2]. Permitting stretches 3-5 years for U.S. greenfields, delaying supply and favoring incumbents.
*Our forecasts treat driver/restraint impacts as directional, not additive. The impact forecasts reflect baseline growth, mix effects, and variable interactions.
Kaolin Market Segment Analysis
By Form:
Processed Kaolin Commands Premium as Beneficiation ScalesProcessed kaolin led the kaolin market size with 70.12% share in 2025, whereas crude/unprocessed kaolin is expanding at a faster 4.89% CAGR to 2031. India’s huge 8.3 million tons of crude output contrasts with scarce domestic processing, compelling tile makers to pay import premiums and highlighting a structural arbitrage within the kaolin market. Beneficiation investments by EICL and 20 Microns will add 200,000-300,000 tons of processed capacity by 2027.
Processed kaolin captures premium end uses—battery separators, high-brightness packaging, cosmetics—because multi-stage magnetic separation, bleaching, and spray drying deliver more than 85% brightness and less than 1% Fe₂O₃. Crude kaolin serves low-end bricks, cement, and agriculture, but is becoming attractive for backward integration in emerging markets craving feedstock security. China’s imports of Ukrainian and Russian crude plunged 40-50% after 2022 sanctions, redirecting flows from Australia and Indonesia and tightening the regional kaolin market.
By Grade:
Calcined Kaolin Gains as Battery and Specialty Applications ExpandHydrous kaolin still controlled 55.45% of the kaolin market share in 2025, but calcined kaolin is outpacing at 4.75% CAGR thanks to batteries and high-opacity coatings. Converting hydrous to calcined at 1,000-1,100 °C removes bound water and lifts brightness to 90-95%, suiting exacting paints and Li-ion separators.
Delaminated and surface-treated grades hold double-digit price premiums for luxury packaging and engineering plastics. Europe’s energy shock idled up to 20% of calcination in 2024-2025, shifting capacity growth toward the U.S. Gulf and Asia, where gas is cheaper. IEC 62660 battery norms should lift calcined-kaolin penetration in EV cells from 30-35% in 2024 to roughly 60-65% by 2027. Hydrous grades face margin pressure from calcium-carbonate substitution in digital-print papers, compelling producers to adopt particle-size control and specialty coatings to defend share within the kaolin market.
By Application:
Ceramics Lead While Battery Coatings EmergeCeramics accounted for 40.23% of the kaolin market size in 2025 and will climb 4.97% CAGR to 2031. Asia’s urban build-out underpins this lead, with India and China alone adding over 3 billion m² of tile capacity by 2026. Paper demand is declining as graphic grades shrink, but specialty filtration and medical packaging mitigate the drag.
Refractories are linked to steel demand, especially in China, where mullite formation is critical for blast furnaces. Paints substitute calcined kaolin for pricey titanium dioxide, saving 8-12% on formulation cost. Plastics and cement admixtures grow on the back of lightweighting and green-building codes, while cosmetics rise as talc exits some SKUs. Battery separators are expected to add incremental calcined-kaolin demand by 2031.

Geography Analysis
APAC Kaolin Market
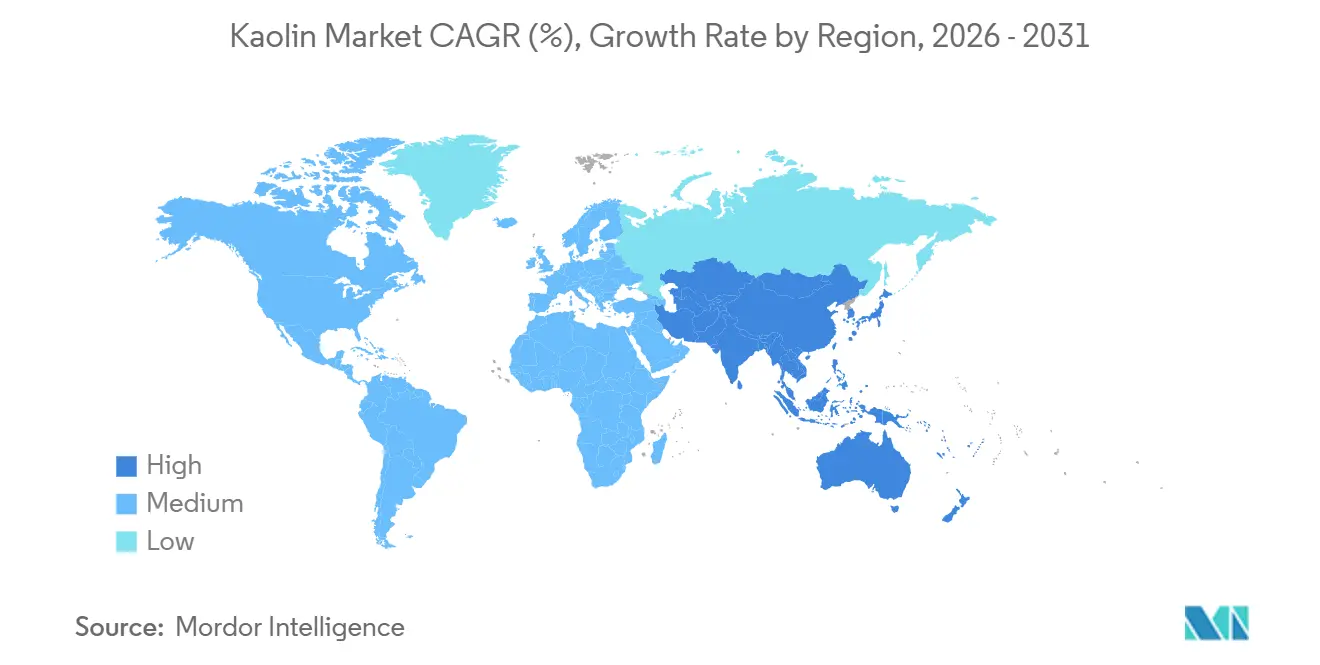
Asia-Pacific commanded 43.26% of the kaolin market in 2025 and is projected to expand at 4.94% CAGR through 2031. China transitions toward higher-purity sanitary-ware and advanced ceramics, pushing brightness premiums up 22-25% since early 2024. India is closing its beneficiation gap via 300,000 tons of new capacity by 2027, aiming to cut import premiums of 12-18%. Japan and South Korea import high-purity grades for electronic substrates, pulling supply from the U.S. and Australia.
North America Kaolin Market
In North America, the Georgia kaolin belt anchors domestic supply, exporting 1.6-1.8 million tons to China, Mexico, and Japan. KaMin LLC’s formation after a EUR 1.43 billion carve-out underscores private-equity bets on mature but cash-rich assets. EV battery investments in Michigan and Tennessee are set to lift calcined-kaolin demand regionally. EPA effluent and dust rules add USD 5-10 million capex per mine but create a moat against new entrants.
EMEA and South America Kaolin Market
Europe faces competitiveness challenges as natural-gas costs and carbon prices inflate calcination economics. Sibelco’s 2023 acquisition of Quarzwerke’s kaolin business and waste-heat retrofits illustrate a shift toward scale and energy efficiency. South America’s vast Amazon reserves stay mostly untapped due to stringent permitting, while Middle-East and Africa rely on imports as Saudi Vision 2030 boosts sanitary-ware requirements.
Value Chain Analysis
The kaolin value chain begins with deposit delineation and permitting, followed by open-pit mining, slurry preparation, and primary beneficiation (screening, classification, magnetic separation, and, where needed, chemical bleaching). Most value addition occurs midstream through spray drying for controlled moisture and particle-size, flash calcination at roughly 1,000-1,100 C to produce high-brightness calcined grades, and surface treatments tailored to ceramics bodies, coatings rheology, and polymer compounding. Processed kaolin holds the market mix (70.12% share in 2025), driven by end-user demand for tight Fe2O3 control (for example, <1.5% in premium sanitary-ware and advanced ceramics) and consistent brightness requirements across packaging papers, paints, and battery-related ceramic coatings.
Distribution runs through bulk channels (rail/truck to ceramic clusters and ports, plus ocean freight for inter-regional shipments) and specialty channels, where traders and technical distributors move smaller lots and provide application support. Key bottlenecks sit in permitting and compliance (for example, US EPA NPDES-driven water treatment additions), energy exposure for calcination (natural-gas and EU carbon costs), and limited local processing capacity in some high-growth consuming markets. That mix typically forces imports of high-brightness grades and pushes up landed costs. Competitive positioning increasingly reflects secured reserves alongside processing and logistics integration, including established supply hubs like the Georgia kaolin belt in the United States and the Asia-Pacific ceramics corridor, which draws on imports from the United States, Australia, Malaysia, and Indonesia.
Competitive Landscape
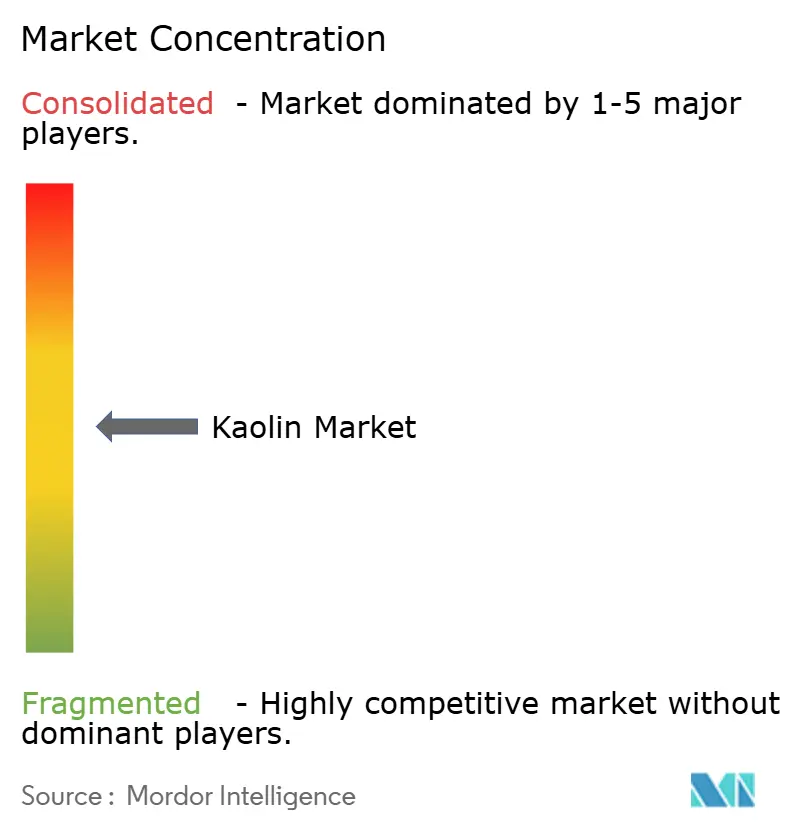
The kaolin market is moderately concentrated; the top five players held about 45-50% combined processed-kaolin capacity in 2025. Imerys refocused on specialty minerals after divesting Performance Minerals Americas, which, combined with Thiele, now trades as KaMin LLC. Sibelco expanded via a 2023 Quarzwerke deal, fortifying its European footprint. 20 Microns, Ashapura, and EICL are scaling in India with backward-integration from tile clients.
Indian tile and Brazilian ceramic manufacturers are enhancing beneficiation capabilities to improve profit margins, while U.S. exporters leverage freight advantages to expand into Mexico and Asia. Specialty applications, such as halloysite from Idaho for separators and pharmaceuticals, and delaminated grades for luxury packaging, highlight the market's focus on niche segments. Technology investments, including waste-heat recovery systems reducing gas consumption by 15-20% and real-time particle-size analytics improving yields by 3-5%, further drive competitiveness. Regulatory compliance with standards like ISO 14001, FDA indirect food contact approvals, and IEC battery standards creates high entry barriers, favoring established players and reinforcing their market positions.
Kaolin Industry Leaders
-
Imerys
-
Sibelco
-
Thiele Kaolin Company
-
KaMin LLC / CADAM
-
EICL
- *Disclaimer: Major Players sorted in no particular order
Kaolin Market Companies Covered in this Report
- 20 Microns
- Active Minerals International LLC
- Ashapura Group
- Burgess Pigment Company
- EICL
- Gebrüder Dorfner GmbH & Co.
- Green 360 Technologies
- Imerys
- I-Minerals Inc.
- KaMin LLC / CADAM
- Kaolin AD
- Keramost a.s.
- LASSELSBERGER Group GmbH
- LB MINERALS, Ltd.
- Quarzwerke GmbH
- Sibelco
- Thiele Kaolin Company
- Tokai Clay Industry Co., Ltd.
- Zeotech
Market Opportunities and Future Outlook
A primary whitespace involves adding regional processing capacity close to fast-growing ceramics demand, especially where crude extraction exceeds local beneficiation capability. India illustrates the gap, with 8.3 million tons of crude extraction contrasted by limited processing capacity, leaving tile and sanitary-ware producers reliant on imported high-brightness grades and exposed to 12-18% landed-cost premiums. Investments in beneficiation by Indian producers (including EICL and 20 Microns) to add 200,000-300,000 tons of processed capacity by 2027 point to near-term openings for equipment suppliers (magnetic separation, calcination, and real-time particle-size analytics) and for producers that can deliver consistent low-iron, high-brightness supply into sanitary-ware and specialty ceramics lines.
Beyond traditional hubs, new refining projects and export-enabling infrastructure broaden the supply map for refined kaolin and metakaolin applications. In Kazakhstan, Qazaq Kaolin commissioned a new processing plant in the Akmola Region using AKW technology, with 90,000 tons per year of refined kaolin capacity that expands options for both domestic and export-grade supply. In Australia, Zeotech continues advancing the Toondoon Kaolin Project, with planning linked to logistics access via Gladstone Port infrastructure, aligning project execution with export readiness rather than mine-only milestones. On the demand side, value creation still hinges on application engineering: ceramic-coated battery separators and titanium-dioxide substitution in architectural coatings reward calcined and surface-treated grades. Materials R&D is also expanding routes for kaolinitic clays in circular-economy construction ceramics, supported by academic work using industrial-waste blends with kaolinitic clay to reach construction-grade strengths (44 MPa) and reduce reliance on conventional virgin inputs.
Recent Industry Developments in Kaolin Market
- March 2026: Burgess Pigment Company announced a definitive agreement to acquire Thiele Kaolin Company, bringing both businesses under a new holding structure upon transaction completion. The deal consolidates a key North American kaolin asset base and strengthens integration between kaolin mining, processing, and customer-facing pigment applications. Combining commercial footprints and operational systems supports broader reach in high-brightness and specialty kaolin grades used across ceramics, coatings, and engineered materials.
- September 2025: Zeotech secured a binding five-year term sheet with Jiangsu Mineral Sources International Trading Co., Limited for the supply of 950,000 tonnes of direct shipping ore (DSO) kaolin products. The agreement formalized a sized offtake pathway tied to export demand, helping de-risk volume placement while development work continues. It also highlighted trader-mediated routes as a material go-to-market channel for projects targeting Asian industrial consumers.
- July 2024: Platinum Equity completed the acquisition of Imerys Performance Minerals Americas, integrating the assets with Thiele to form KaMin LLC. The transaction reshaped competitive dynamics in processed kaolin by concentrating reserves, beneficiation, and customer relationships within a private-equity-backed platform. A unified operating entity also sharpened focus on efficiency programs and specialty-grade mix, which are central differentiators as energy and compliance costs pressure calcination economics.
Kaolin Market Report Scope and Research Methodology
Market Definition and Coverage
For this study, the kaolin market covers kaolin clay supplied for industrial use, counted across mining, processing (where applicable), and downstream consumption in key end-use industries.
Scope exclusions: The sizing excludes finished goods where kaolin is only a minor ingredient (such as coated paper, ceramics, or paints) and counts only the kaolin material volume moving into those uses.
Segments Covered in This Report
-
By Form
- Processed Kaolin
- Crude/Unprocessed Kaolin
-
By Grade
- Hydrous Kaolin
- Calcined Kaolin
- Delaminated Kaolin
- Other Grades
-
By Application
- Ceramics
- Cement
- Paper
- Refractories
- Paints and Coatings
- Plastics
- Other Applications
-
By Geography
-
Asia-Pacific
- China
- India
- Japan
- South Korea
- Rest of Asia-Pacific
-
North America
- United States
- Canada
- Mexico
-
Europe
- Germany
- United Kingdom
- France
- Italy
- Rest of Europe
-
South America
- Brazil
- Argentina
- Rest of South America
-
Middle-East and Africa
- Saudi Arabia
- South Africa
- Rest of Middle-East and Africa
-
Asia-Pacific
Data Sources, Market Sizing, and Validation
Desk Research
To set the market context, we map where kaolin is produced, processed, traded, and consumed, then build realistic demand pools by region. Public and official sources are used to anchor the model, including USGS mineral commodity statistics, UN Comtrade trade flows, U.S. Geological Survey-style mine production series in major producing countries, and publications from environmental and mining regulators where available.
We also review technical and demand-side indicators from peer-reviewed journals on kaolin processing and beneficiation, along with trade association pages and government industrial outlook notes that cover paper, ceramics, cement, and construction activity. Company filings, investor presentations, and credible press are reviewed to understand capacity changes, product positioning (hydrous vs calcined), and shipment patterns. In addition, paid subscriptions are used selectively for company financials and intelligence, shipment-level import and export checks, and patent database scans to confirm the direction of processing trends. These desk sources are not exhaustive, and other references are used to collect data points, cross-check assumptions, and clarify gaps during the work.
Primary Interviews and Surveys
Primary work was used to pressure-test desk assumptions on volume splits, grade mix, and regional pricing behavior, then to tighten the forecast drivers. We spoke with producers, processors, distributors, and downstream users spanning paper, ceramics, and construction materials, with coverage balanced across major producing and consuming regions so no single geography distorted the overall totals.
Distribution of primary research fieldwork respondents
| Company type | Respondent position | Region |
|---|---|---|
| Top tier: 36% | CXOs: 16% | APAC: 44% |
| Mid tier: 42% | Functional/Unit leaders: 32% | EMEA: 30% |
| Smaller Players: 22% | Managers: 52% | Americas: 26% |
Market-Sizing & Forecasting
The core sizing starts from a top-down build where production, trade, and apparent consumption are reconstructed for kaolin by region, and then adjusted using end-use intensity checks. To keep the totals realistic, we corroborate them with selective bottom-up approximations, such as sampled supplier shipments, channel checks on processed versus crude splits, and volume times average selling price sanity checks where price references were available.
Key model inputs include kaolin mine output and processing capacity utilization, import and export balances by major trading routes, paper and packaging production trends that influence filler and coating demand, construction and cement activity signals that affect functional mineral use, and ceramics output trends that drive higher specification grades. For forecasting, scenario analysis is applied around paper demand substitution, regional construction cycles, and energy-cost sensitivity for calcination, and then consensus ranges are narrowed using expert feedback on what is actually happening in contracts and procurement cycles. Where bottom-up visibility is limited in smaller producing countries, we fill gaps using trade-based consumption proxies, then recheck the implied per-capita and per-industry intensity against comparable markets.
Data Validation & Update Cycle
After initial model runs, we triangulate results using independent signals, including trade directionality, announced capacity changes, and downstream output series, so the market does not drift away from observed activity. Outliers are flagged and reviewed, and if a variance cannot be explained through known drivers such as mix shifts or one-off disruptions, assumptions are revisited and primary contacts are re-approached.
Before sign-off, the work goes through multiple analyst review steps where calculations, units, and conversions are rechecked, followed by a final coherence check across regions and applications. Reports are refreshed annually, and interim updates are made when material events occur, such as major plant closures, new processing capacity, or unusual shifts in trade. Right before delivery, we complete a fresh pass so clients receive the latest updated view.
Mordor Intelligence's Kaolin Market Size Compared Against Other Published Estimates
It is normal to see different market size numbers for kaolin because publishers do not always measure the same thing, even when the title looks identical. Differences usually come from the unit of measurement used, the cut between crude and processed grades, how trade and consumption are treated, and whether pricing is modeled from consistent reference points.
Finished downstream products that contain kaolin are outside Mordor Intelligence's scope, so the size is expressed in kaolin volume rather than the higher value of paper, coatings, or ceramics supply chains, which is a common reason other published values look larger.
Benchmark comparison
| Source | Market Size | Gaps in Research Methodology |
|---|---|---|
| Mordor Intelligence | USD 49.46 M (2026) | |
| Global Consultancy A | USD 4.46 B (2026) | This estimate is value-based, and it can differ if it includes price-led uplift assumptions for processed grades and applies broader revenue capture across the supply chain rather than tracking physical kaolin tonnage. |
| Industry Publisher B | USD 4.61 B (2026) | This figure is reported in USD and may vary due to different average price progression by region, currency timing, and whether calcined and specialty grades are weighted more heavily in the mix. |
The spread in the table mainly reflects unit choice and scope around what is being counted, and then how price and mix are applied year to year. By keeping the market tied to observable production, trade, and consumption signals, the resulting view stays traceable to clear inputs that can be rechecked and updated with new data.
Key Questions Answered in the Report
How large is the kaolin market?
The kaolin market stands at 49.46 million tons in 2026 and is forecast to reach 60.87 million tons by 2031, reflecting a 4.24% CAGR from 2026-2031.
Which region leads demand growth for kaolin?
Asia-Pacific leads, driven by ceramics expansion in China, India, Indonesia, and Vietnam, growing at 4.94% CAGR through 2031.
Why is calcined kaolin gaining traction in batteries?
Calcined grades improve separator thermal stability at lower cost than alumina, and EV gigafactories could need 50,000-80,000 tons annually by 2031.
What is driving investment in beneficiation in India?
A gap between 8.3 million tons of crude output and limited processing capacity pushes tile makers to pay import premiums; new plants aim to close this gap.