
K-12 Education Market Size and Share
Market Overview
| Study Period | 2020 - 2031 |
|---|---|
| Market Size (2026) | USD 3.54 Trillion |
| Market Size (2031) | USD 5.83 Trillion |
| Growth Rate (2026 - 2031) | 10.51% CAGR |
| Fastest Growing Market | Asia Pacific |
| Largest Market | North America |
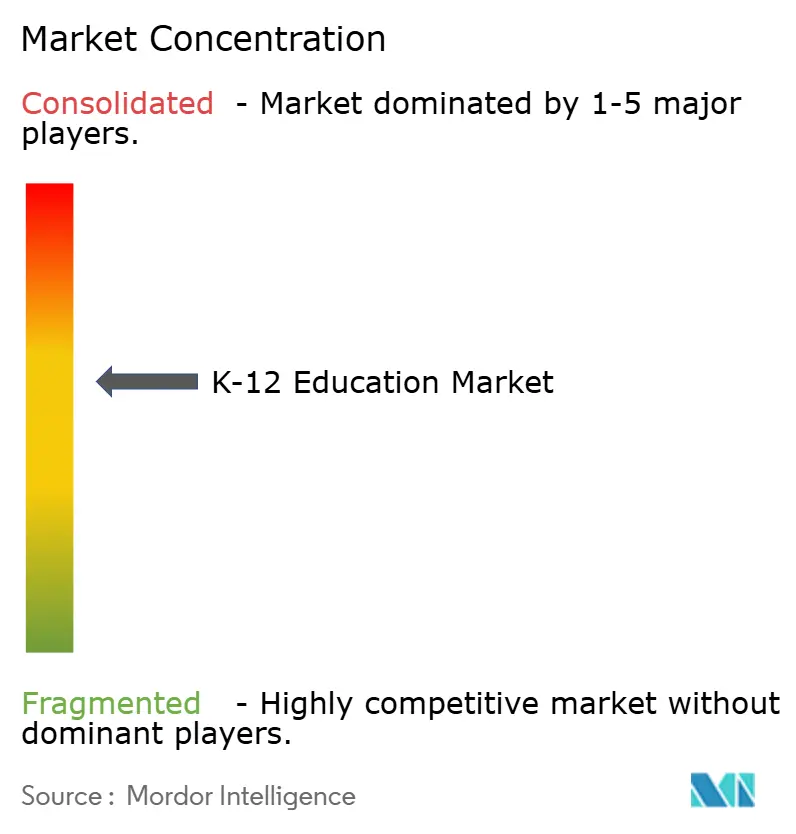
| Market Concentration | Medium |
Major Players *Disclaimer: Major Players sorted in no particular order Image © Mordor Intelligence. Reuse requires attribution under CC BY 4.0. | |
K-12 Education Market Analysis by Mordor Intelligence
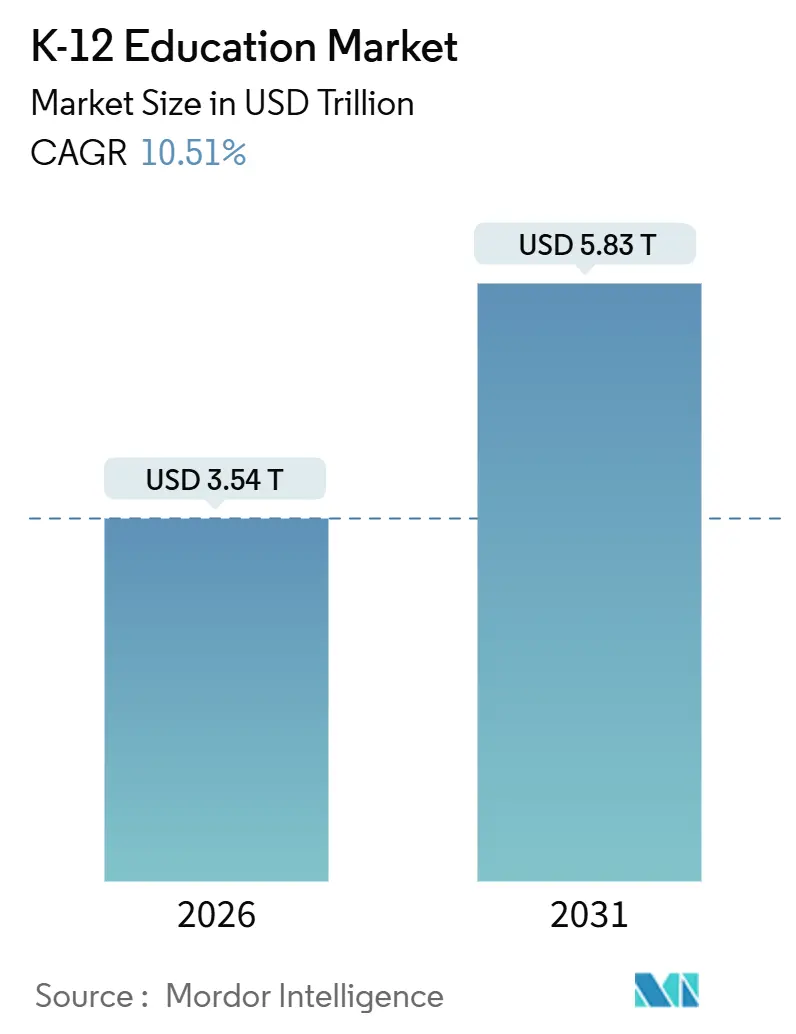
The K-12 education market size stands at USD 3.54 trillion in 2026 and is projected to reach USD 5.83 trillion by 2031, expanding at a 10.51% CAGR. Rapid digitization is reshaping classroom experience, intertwining AI analytics, immersive simulation tools, and cloud-first infrastructure with daily instruction. Hardware prices are falling, broadband coverage is widening, and government mandates continue to underwrite device purchases, creating fertile ground for platform expansion. Incumbent technology vendors bundle zero-cost productivity suites with hardware subscriptions, eroding the long-standing dominance of traditional publishers. Meanwhile, open-source curriculum collaboratives are squeezing print margins, prompting textbook players to pivot toward direct-to-consumer micro-credential programs and adaptive e-textbooks. Adoption hurdles remain the digital divide, fragmented procurement, and teacher-training gaps but the medium-term outlook stays strongly upward as interoperability standards mature and outcome-based funding gains traction.
Key Report Takeaways
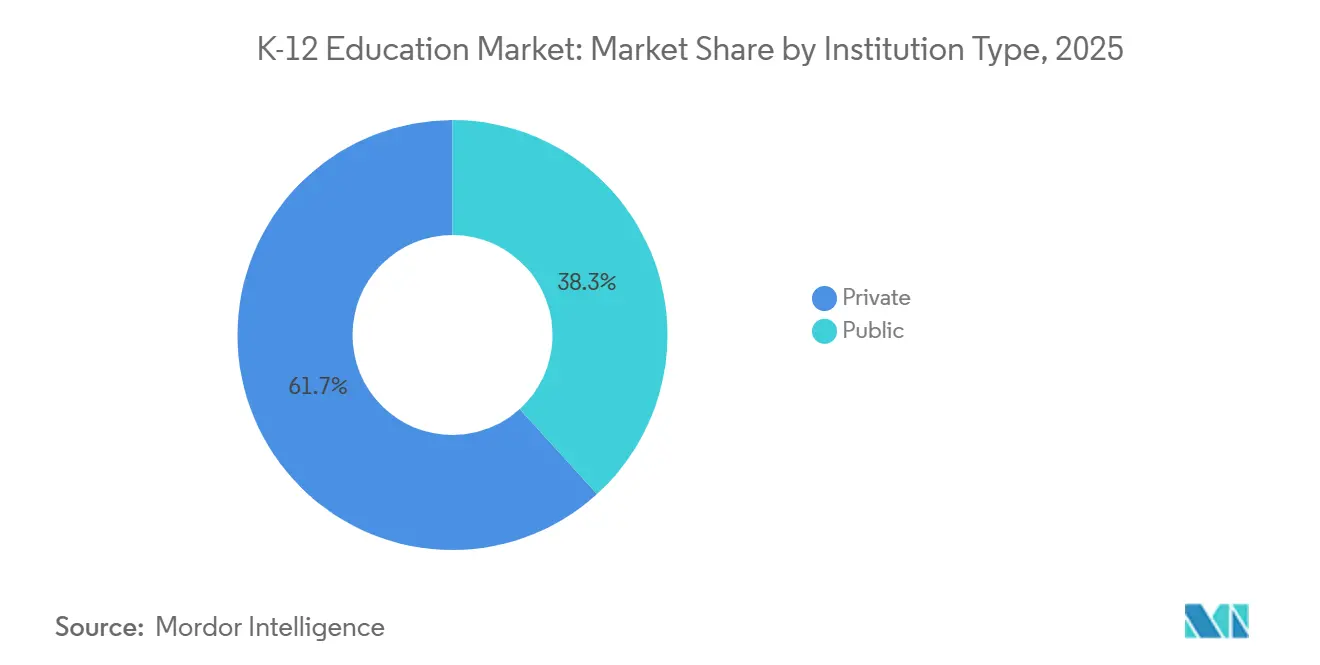
- By institution type, public schools led with 61.74% of the K-12 education market share in 2025, while private schools are forecast to expand at an 11.54% CAGR through 2031.
- By learning model, in-person instruction accounted for 60.32% of 2025 revenue, whereas fully online and virtual schools are advancing at an 11.47% CAGR to 2031.
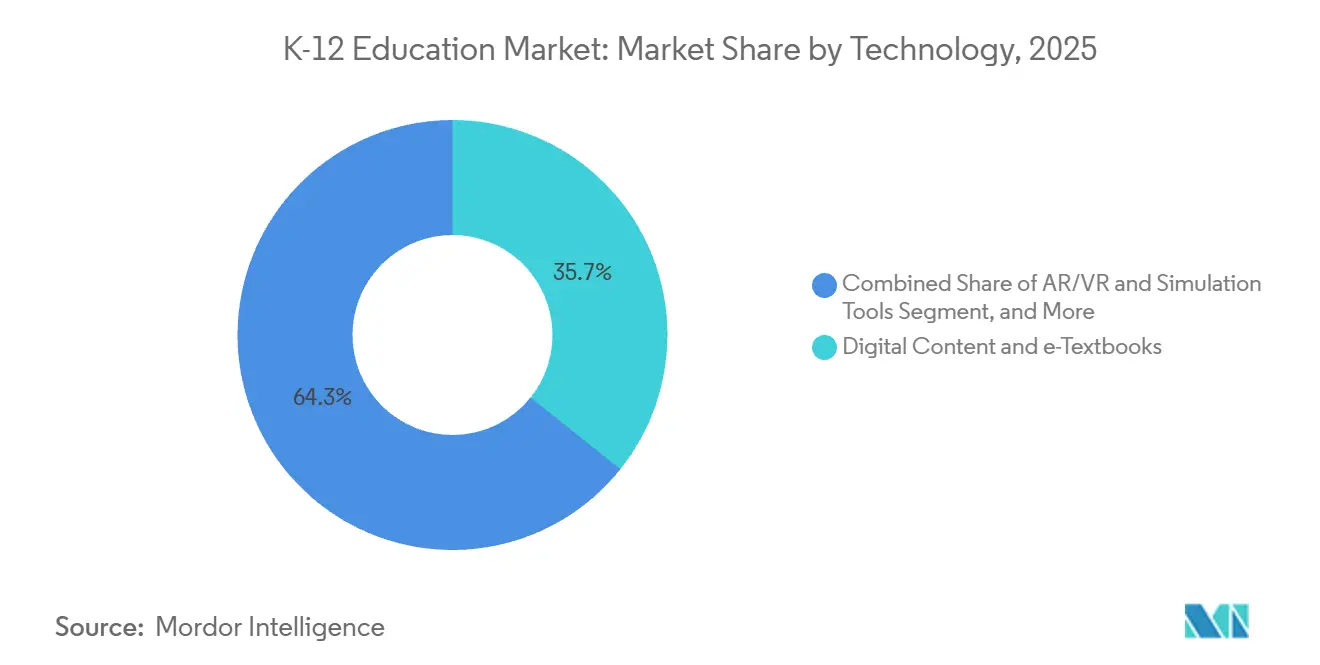
- By technology, digital content and e-textbooks claimed 35.74% of 2025 spending, yet AR/VR and simulation tools are projected to grow at an 11.83% CAGR.
- By application, high-school programs represented 39.59% of 2025 value, while the pre-primary and primary segment is on pace for an 11.61% CAGR.
- By geography, North America contributed 40.14% of global revenue in 2025, whereas Asia-Pacific is predicted to surge at an 11.97% CAGR through 2031.
Note: Market size and forecast figures in this report are generated using Mordor Intelligence’s proprietary estimation framework, updated with the latest available data and insights as of January 2026.
Global K-12 Education Market Trends and Insights
Drivers Impact Analysis*
| Driver | (~) % Impact on CAGR Forecast | Geographic Relevance | Impact Timeline |
|---|---|---|---|
| AI-Powered Learning Analytics | +2.1% | Global, early adoption in North America, China, India | Medium term (2-4 years) |
| Government Mandates for Classroom Digitisation | +1.9% | North America, Europe, Asia-Pacific (China, India, South Korea) | Short term (≤ 2 years) |
| Growing Penetration of Digital Devices and Broadband Access | +1.7% | Global, accelerating in Asia-Pacific and South America | Medium term (2-4 years) |
| Rising Demand for Personalised and Adaptive Learning Platforms | +1.5% | North America, Europe, Australia, urban Asia-Pacific | Medium term (2-4 years) |
| Emergence of Micro-Credentialing for Career Readiness | +0.8% | North America, Europe, pilot programs in Asia-Pacific | Long term (≥ 4 years) |
| District-Level Open-Source Curriculum Collaborations | +0.6% | North America, Europe, select South American cities | Long term (≥ 4 years) |
| Source: Mordor Intelligence | |||


AI-Powered Learning Analytics Enhancing Student Outcomes
Predictive dashboards now surface mastery gaps in near real time, enabling timely intervention that lifts quarterly pass rates. U.S. districts using early-warning models flagged at-risk students with 78% accuracy in 2025, raising proficiency by 12 points. China followed suit, mandating adaptive assessments in 50,000 middle schools that year. India earmarked INR 50 billion (USD 600 million) for AI infrastructure, and pilots in Karnataka improved math scores 15% by the end of 2025. Vendors offering closed-loop systems diagnostics that feed automated lesson plans are capturing multi-year contracts, pressuring publishers that rely on static test banks. As training ramps and data standards settle, this driver will add the greatest boost to mid-term growth.
Government Mandates for Classroom Digitisation
Funding is increasingly tied to connectivity benchmarks and device penetration ratios. The U.S. Infrastructure Investment and Jobs Act steered USD 7.2 billion into school broadband upgrades, catalyzing cloud-platform adoption.[1]Federal Communications Commission, “E-Rate Program Funding for Schools and Libraries,” fcc.gov Europe’s Digital Education Action Plan committed EUR 10 billion (USD 11.3 billion) for interactive displays, with compliance audits by the European Commission in 2026. South Korea, Australia, and other early movers imposed deadlines for digital textbooks, unleashing multi-billion-dollar procurement waves. While the spending bolsters short-term revenue, districts must budget for recurring software renewals to sustain the gains.
Growing Penetration of Digital Devices and Broadband Access
Affordable rugged tablets and sub-USD 200 Chromebooks pushed education device shipments to 47 million units in 2025. BharatNet connected 250,000 Indian village schools to fiber, bridging gaps where teacher vacancies topped 20%. Brazil’s 4G rollout reached 35,000 campuses, unlocking demand for streaming video lessons. The U.K. issued 1.3 million laptops to disadvantaged learners, narrowing the homework gap. As infrastructure improves, platform stickiness and content consumption rise, adding sustained lift to the growth curve.
Rising Demand for Personalised and Adaptive Learning Platforms
Districts now gravitate toward software that automatically calibrates difficulty, rewarding outcomes over seat-license counts. U.S. adoption jumped to 18 million students in 2025, with subscription revenue up 22%. DreamBox users gained 1.5 grade levels after weekly 60-minute sessions, persuading 450 districts to renew. European competency-based models issue micro-credentials upon mastery, and pilots in New South Wales cut remediation 18%. Demonstrated efficacy will keep districts spending, underpinning medium-term momentum.
Restraints Impact Analysis*
| Restraint | (~) % Impact on CAGR Forecast | Geographic Relevance | Impact Timeline |
|---|---|---|---|
| Digital Divide in Rural and Low-Income Districts | -1.3% | Global, acute in South America, Africa, rural Asia-Pacific and North America | Short term (≤ 2 years) |
| Student-Data Privacy Litigations Constraining Roll-Outs | -1.1% | North America, Europe (GDPR jurisdictions) | Short term (≤ 2 years) |
| Teacher Resistance to Technology Adoption | -0.7% | Global, pronounced in Europe and parts of Asia-Pacific | Medium term (2-4 years) |
| Fragmented Procurement Processes Lengthening Sales Cycles | -0.5% | North America, Germany, Brazil, decentralized systems | Medium term (2-4 years) |
| Source: Mordor Intelligence | |||
Digital Divide in Rural and Low-Income Districts
Infrastructure gaps threaten to widen achievement inequities. In 2024, 9.7 million U.S. students lacked reliable home broadband, mostly in Appalachia, tribal lands, and the Mississippi Delta. Sub-Saharan Africa saw only 28% of schools electrified, rendering online tools impractical.[2]UNESCO, “School Connectivity in Sub-Saharan Africa,” unesco.org India’s rural device ratios reached 40:1 in 2025, forcing chalkboard fallback. Brazilian Northeast districts still trail urban adoption by 50%. Until subsidies and device-donation schemes scale, the digital divide will shave 1.3 points off near-term growth.
Student-Data Privacy Litigations Constraining Roll-Outs
Regulatory fines and class actions are forcing platform pauses and expensive redesigns. The U.S. Federal Trade Commission levied a USD 6 million penalty on a vendor in 2024 for unauthorized geolocation tracking.[3]Federal Trade Commission, “COPPA Enforcement Actions 2024,” ftc.gov Three European LMS providers faced EUR 12 million (USD 13.6 million) in GDPR penalties during 2025, prompting district moratoria. California’s updated student privacy law now requires annual security audits, raising vendor compliance costs 18%. Australia introduced opt-in rules for behavioral tracking, slowing AI roll-outs. Until privacy-by-design frameworks become the norm, legal uncertainty will weigh on short-term adoption.
*Our forecasts treat driver/restraint impacts as directional, not additive. The impact forecasts reflect baseline growth, mix effects, and variable interactions.
Segment Analysis
By Institution Type: Private Schools Outpace Public Sector
Public schools accounted for 61.74% of the K-12 education market in 2025, reflecting enrollment scale and federal device subsidies. Private institutions, however, are growing at an 11.54% pace as they bundle premium adaptive-learning subscriptions, AR/VR labs, and micro-credential programs that justify rising tuition. The K-12 education market size for private schools is widening fastest in India, where chains such as Delhi Public School spent USD 4.2 billion on EdTech in 2025. Charter schools bridge both worlds, blending public funding with agile procurement to test competency-based progression. Vendors targeting this segment enjoy larger contract values, shorter sales cycles, and less bureaucracy than in the public sector.
Budget pressures constrain many public districts, pushing them toward open-source textbooks and one-time hardware grants rather than multi-year SaaS licenses. Even so, their massive user bases are critical for platform scale. Suppliers must therefore offer interoperable, standards-aligned solutions and patient financing models to win tenders. Overall, private-school momentum should continue lifting revenue while public districts remain the volume anchor of the K-12 education market.
By Learning Model: Virtual Schools Gain Traction
In-person classrooms held 60.32% share in 2025, yet virtual academies are expanding at an 11.47% CAGR as families prioritize flexibility and districts tackle teacher shortages. K12-branded virtual schools enrolled 185,000 students and produced USD 1.6 billion in 2025 revenue. The K-12 education market share of fully online models rises quickest in China, where policy shifts redirected after-school tutoring budgets into daytime digital curricula. Hybrid formats add synchronous video labs to local classrooms, maximizing scarce certified teachers across large geographies.
Early-grade socialization needs and affluent district preferences sustain the brick-and-mortar core, but secondary-grade demand for AP courses and niche electives fuels digital enrollment. Virtual providers must therefore invest in live engagement, peer collaboration, and robust counseling to stave off isolation risks and meet accountability metrics.
By Technology: AR/VR as Growth Leader
Digital content and e-textbooks captured 35.74% of technology spending in 2025, yet slowing growth exposes these categories to price erosion. In parallel, AR/VR and simulation solutions are accelerating at an 11.83% CAGR, buoyed by headsets such as Meta Quest 3 that lower hardware cost thresholds. The K-12 education market size for AR/VR platforms is rising sharply as retention gains of 18-24% outshine static textbook outcomes. European schools purchased 85,000 ClassVR headsets in 2025, bundling curriculum-aligned content that trims teacher prep time.
Legacy learning-management and assessment suites remain indispensable, but competitive differentiation is shifting toward AI-driven grading and predictive analytics. Vendors that integrate immersive modules with LMS data streams will command premium pricing, while pure-play e-textbook suppliers risk commoditization.

By Application (Grade Level): Early Education Surges
High-school programs still dominated spending with 39.59% share in 2025, supported by career-readiness platforms, dual-credit courses, and college-prep tools. Nevertheless, the pre-primary and primary cohort is advancing at an 11.61% CAGR as neuroscience validates gamified phonics and numeracy apps. Waterford.org programs delivered 1.8 months of extra reading growth for Title I students, attracting new grants. The K-12 education market size allocated to early-education software is scaling quickly in China, where regulators approved 47 preschool apps in 2025.
Middle-school demand grows mainly in South Asia and Sub-Saharan Africa, where demographics remain favorable. Secondary-grade tools now compete on breadth of electives and integration with transcript services, exemplified by recent LMS-credential mergers. Vendors must therefore balance age-appropriate UX, parental controls, and standards alignment across disparate grade ranges.
Geography Analysis
North America retained 40.14% of 2025 revenue, underpinned by USD 7.2 billion in E-Rate connectivity grants and robust state mandates for digital content. U.S. districts allocate large line items to cloud subscriptions, analytics dashboards, and device refresh cycles, cementing incumbent vendor dominance. Canada invested CAD 1.2 billion (USD 880 million) in 2025 to extend smart-classroom access to Indigenous communities.
Asia-Pacific is the fastest-growing region at an 11.97% CAGR, propelled by China’s nationwide AI-tutoring rollout and India’s rural fiber program. The K-12 education market size in Asia-Pacific will eclipse North America before 2031 if current policy momentum endures. Governments continue subsidizing hardware and mandating adaptive-assessment platforms to mitigate teacher shortages.
Europe progresses more slowly due to stringent data-sovereignty rules that favor locally hosted or open-source systems, stretching procurement cycles. Germany’s DigitalPakt Schule injected EUR 6.5 billion (USD 7.3 billion) through 2024, yet district implementation still lags 18 months behind funding awards. The United Kingdom improved device ownership among low-income households to 81% in 2025, aided by GBP 1.8 billion (USD 2.3 billion) investments.
South America and the Middle East and Africa remain fragmented. Brazil accounts for 55% of Latin American EdTech spending, though connectivity gaps persist in rural Northeast states. In the Middle East and Africa, smart-classroom pilots flourish in the United Arab Emirates and Saudi Arabia under Vision 2030, whereas South Africa and Nigeria grapple with infrastructure shortfalls. Vendors seeking regional growth must adapt pricing to variable purchasing power and offer off-line functionality where bandwidth remains scarce.

Regulatory Landscape
K-12 digitization is increasingly shaped by student data protection requirements and emerging AI-specific controls, which influence product design, procurement eligibility, and rollout speed. In the United States, education IT procurement and vendor qualification are tightening around security-control frameworks, including US Department of Education acquisition standards that reference NIST SP 800-53 controls, while federal and state student privacy expectations continue to raise audit and documentation requirements.
In Europe, the EU AI Act (Regulation 2024/1689) sets a tiered framework that is relevant for AI-enabled assessment, grading, admissions, and proctoring workflows used in schools. Certain prohibited practices became enforceable from 2 February 2025, and transparency obligations such as labeling AI-generated content apply from 2 August 2026, expanding the compliance scope for digital content, collaboration platforms, and analytics tools used in K-12 settings. Alongside this, multi-stakeholder initiatives such as the UNESCO, UNICEF, and ITU Charter for Public Digital Learning Platforms (released in March 2026) reinforce governance principles for public digital learning tools and keep interoperability, transparency, and public accountability at the center of platform selection.
Competitive Landscape
The sector is moderately fragmented. Google Workspace for Education served 170 million students in 2025, pairing Chromebooks that represent 52% of U.S. K-12 device shipments. Microsoft Teams for Education counted 200 million active users, integrating AI-reading progress and video conferencing. Apple positions iPads as premium, privacy-centric solutions, strengthened by ClassKit 2.0 rollouts that attracted 120 partner apps.
Pearson+ for K-12 attracted 1.2 million users within six weeks, signaling appetite for direct-to-parent models. McGraw-Hill linked GPT-powered tutoring to its ALEKS system, delivering 19% algebra gains in pilots. OpenStax, meanwhile, distributed 3.8 million free digital textbooks, increasing price pressure on legacy content providers.
Specialist disruptors seize niches. Squirrel AI scaled adaptive tutoring to 3.2 million Chinese students, while ClassDojo’s communication app connects 50 million users and is branching into SEL content. Google is exploring AI-enabled disengagement detection; Microsoft focuses on multilingual translation.
To survive, mid-tier vendors must either integrate horizontally, offering full-stack ecosystems, or drill vertically into high-value niches such as special education analytics or competency-based credentials. Distribution reach, interoperability, and privacy compliance will decide long-term winners in the K-12 education market.
K-12 Education Industry Leaders
McGraw-Hill Education (Platinum Equity)
Pearson plc
Cengage Group
Stride Inc.
TAL Education Group
- *Disclaimer: Major Players sorted in no particular order

Market Opportunities and Future Outlook
A clear whitespace is emerging around AI infrastructure and open-license public goods that can help districts deploy analytics and formative assessment while meeting procurement accountability requirements. Digital Promise opened the first grant cycle of its K-12 AI Infrastructure Program in February 2026, targeting open-license components for formative assessment. This opens commercial pathways for vendors and integrators to provide implementation, support, and compliant extensions, rather than relying only on closed, standalone apps.
Procurement shifts toward evidence-based buying are also sharpening product expectations. More RFPs are requesting ESSA evidence tier classification (Tiers 1-4), which is pushing roadmaps toward measurable learning impact, transparent model behavior, and stronger evaluation tooling. Separately, cybersecurity and data privacy are adding incremental spend and differentiating vendors as districts prioritize risk management alongside GenAI adoption. CoSNs U.S. State of EdTech 2026 identifies cybersecurity as the top priority for K-12 technology leaders, followed by data privacy and GenAI integration, supporting demand for secure identity, device management, monitoring, and privacy-by-design features across LMS, collaboration platforms, and digital content ecosystems. Connectivity modernization remains a foundational opportunity as network operators and consortia continue to procure capacity, including CENIC issuing node-level RFPs for statewide circuits in 2026, which benefits broadband, cloud, and platform providers offering reliable, standards-aligned services for in-school and hybrid learning.
Recent Industry Developments
- January 2026: Cengage School launched Explore, positioning it as a unified K-12 learning platform designed to personalize instruction at scale. The release supports consolidation of content, analytics, and classroom workflows into fewer systems, a procurement advantage for districts looking to simplify integration and vendor management.
- November 2025: Cengage Group expanded its collaboration with Amazon Web Services (AWS) to advance AI-powered learning capabilities, including tools aimed at helping educators adjust content and instruction. The partnership reinforces a pattern of major education publishers using hyperscaler infrastructure and AI services to accelerate product delivery and meet security and scalability requirements.
- July 2025: McGraw Hill completed its initial public offering on the New York Stock Exchange, raising approximately USD 415 million and trading under the symbol MH. The listing improves access to capital that can be directed toward digital platform investment, AI-enabled content development, and potential portfolio expansion in K-12 and adjacent learning segments.


Research Methodology Framework and Report Scope
Market Definition and Coverage
For this methodology, the K-12 education market is defined as total spending tied to delivering formal schooling from kindergarten through grade 12, across public and private systems, including operating spend and paid learning inputs.
Scope exclusions: We exclude post grade-12 vocational and short-cycle training programs, as these sit outside formal K-12 delivery.
Segmentation Overview
- By Institution Type
- Public
- Private
- By Learning Model
- Traditional In-Person
- Hybrid
- Fully Online / Virtual Schools
- By Technology
- Learning Management Systems (LMS)
- Digital Content and e-Textbooks
- Assessment and Analytics Tools
- Collaboration and Communication Platforms
- AR/VR and Simulation Tools
- Other Technologies
- By Application (Grade Level)
- Pre-Primary and Primary School (K-5)
- Middle School (6-8)
- High School (9-12)
- By Geography
- North America
- United States
- Canada
- Mexico
- South America
- Brazil
- Argentina
- Rest of South America
- Europe
- Germany
- United Kingdom
- France
- Italy
- Spain
- Rest of Europe
- Asia-Pacific
- China
- India
- Japan
- South Korea
- Australia
- Rest of Asia-Pacific
- Middle East and Africa
- Middle East
- Saudi Arabia
- United Arab Emirates
- Turkey
- Rest of Middle East
- Africa
- South Africa
- Nigeria
- Egypt
- Rest of Africa
- Middle East
- North America
Data Sources, Market Sizing, and Validation
Desk Research
Desk research is used to anchor the model to real-world education activity and spending patterns before assumptions are stress-tested in field work. We lean on public education finance and enrollment series to understand the size of the addressable pool, and how it changes by region and over time.
Sources reviewed include non-paywalled references such as UNESCO Institute for Statistics, the World Bank education indicators, OECD Education at a Glance, NCES for the United States, and Eurostat where relevant. We also cross-check with ministry of education budget documents, national statistical offices, and audited public finance releases, followed by school network disclosures and investor presentations for paid private providers where available. To tighten the company and deal landscape, we selectively use paid subscriptions for company financials and intelligence, news and financials, patent databases, and global contracts and tenders. The examples listed here are illustrative only, and many other sources were also used for data collection, validation, and research clarification.
Primary Interviews and Surveys
Primary work is used to confirm what is actually being paid for in K-12 delivery, and what gets booked outside the market due to accounting practice. We speak with school administrators, district level procurement teams, private school operators, publishers and service providers, and policy and funding experts across APAC, EMEA, and the Americas. After that, we reconcile definition differences so the final model can be locked consistently.
Distribution of primary research fieldwork respondents
| Company type | Respondent position | Region |
|---|---|---|
| Top tier: 25% | CXOs: 16% | APAC: 44% |
| Mid tier: 59% | Functional/Unit leaders: 31% | EMEA: 37% |
| Smaller Players: 16% | Managers: 53% | Americas: 19% |
Market-Sizing & Forecasting
We size the market using a top-down build that reconstructs spend by starting from education budgets and household out-of-pocket outlays, then aligning to K-12 enrollment and per-student expenditure signals. After the first pass, totals are checked using selective bottom-up approximations, such as sampled tuition and fee levels by country, provider revenue mix checks, and simple volume times average spending benchmarks for learning inputs, followed by adjustments where gaps appear.
Key inputs in the model include K-12 enrollment levels, public education expenditure by level, household education spending where reported, teacher workforce and compensation trends (as a proxy for operating intensity), and adoption indicators for digital learning infrastructure. If numbers are missing for a country or year, we interpolate using nearby years or peer-country ratios, and we keep the assumption visible so it can be challenged in validation calls.
For the forecast, we use scenario analysis supported by multivariate regression on a small set of drivers, mainly enrollment growth, government education allocations, and inflation-adjusted per-student spend. We then review the outputs with expert expectations to avoid unrealistic jumps. Where policy cycles or funding changes are lumpy, we smooth the path using simple constraints so the curve stays explainable on a client call.
Data Validation & Update Cycle
Validation is handled through triangulation across independent signals, followed by structured variance checks at regional and global levels. Outliers are flagged when implied per-student spend or growth rates move outside what funding plans, enrollment direction, or school capacity changes would reasonably support, and then we recheck the underlying drivers.
Before sign-off, the model goes through multi-step analyst reviews, and call-backs are triggered when interview feedback materially disagrees with desk indicators, or when new policy announcements shift expected funding. Reports are refreshed annually, with interim updates when major events occur that can change budgets or attendance patterns. Right before delivery, we perform a final pass to ensure the dataset and assumptions reflect the latest available public releases.
Mordor Intelligence's K 12 Education Market Size Measured Against Other Published Estimates
Published values for K-12 education often differ because the market is not a single product category, and many studies mix public finance flows with private revenue in different ways. Differences also come from whether estimates are stated in current dollars or constant dollars, and from how the base year is selected when education budgets are revised.
The biggest gap drivers tend to be scope handling and spend mapping rules, such as whether teacher payroll and facilities operations are fully counted as part of the market, or whether only paid instructional goods and services are included. Some estimates also apply more aggressive growth paths by assuming faster digitization without checking whether procurement cycles and funding approvals can support it, and currency conversion timing can widen the spread in multi-region totals.
Operating spend alignment to K-12 budgets and enrollment, stated in constant 2025 US dollars, explains the higher 2026 value shown here, which is handled this way by Mordor Intelligence.
Benchmark comparison
| Source | Market Size | Gaps in Research Methodology |
|---|---|---|
| Mordor Intelligence | USD 3.54 T (2026) | |
| Global Consultancy A | USD 2.98 T (2025) | Uses a different base year and appears to bundle course materials, infrastructure, and training, but it is unclear how much recurring school payroll and facilities operations are included, which can compress the total. |
| Industry Publisher B | USD 2.65 T (2024) | Market scope reads closer to combined public and private system spend plus services, but the year basis and dollar type are not consistently stated, and the bridge from budget data to K-12-only totals is not fully described. |
Taken together, the spread is mainly explained by what each source counts inside core K-12 delivery, the year used for the starting value, and how currency and inflation are treated. By keeping the spend bridge traceable to budgets, enrollment, and per-student intensity checks, the estimate stays repeatable and easier to audit when assumptions need to be updated.


Key Questions Answered in the Report
How large is the K-12 education market in 2026?
It totals USD 3.54 trillion, with a projected 10.51% CAGR through 2031.
Which segment is growing fastest within K-12 EdTech spending?
AR/VR and simulation tools, expanding at an 11.83% CAGR as headset prices fall and immersive curricula gain traction.
Why are private schools adopting technology faster than public schools?
Tuition flexibility allows private institutions to fund premium adaptive platforms and AR/VR labs, driving an 11.54% growth pace to 2031.
Which region will contribute the most new revenue by 2031?
Asia-Pacific, forecast to grow at 11.97% annually as China and India scale AI tutoring and rural broadband.
What is the biggest barrier to digital adoption in K-12?
Persistent digital divides in rural and low-income districts, which currently shave 1.3 percentage points off overall growth until infrastructure gaps close.
How are privacy regulations affecting EdTech vendors?
GDPR and U.S. state laws have triggered fines and contract pauses, raising compliance costs and delaying roll-outs, reducing near-term growth by about 1.1 percentage points.
Page last updated on:


