
Market Overview
| Study Period | 2021 - 2031 |
|---|---|
| Forecast Data Period | 2026 - 2031 |
| Base Year Market Size (2025) | 33.52 Million liters |
| Market Volume (2026) | 34.21 Million liters |
| Market Volume (2031) | 37.88 Million liters |
| Growth Rate (2026 - 2031) | 2.06 % |
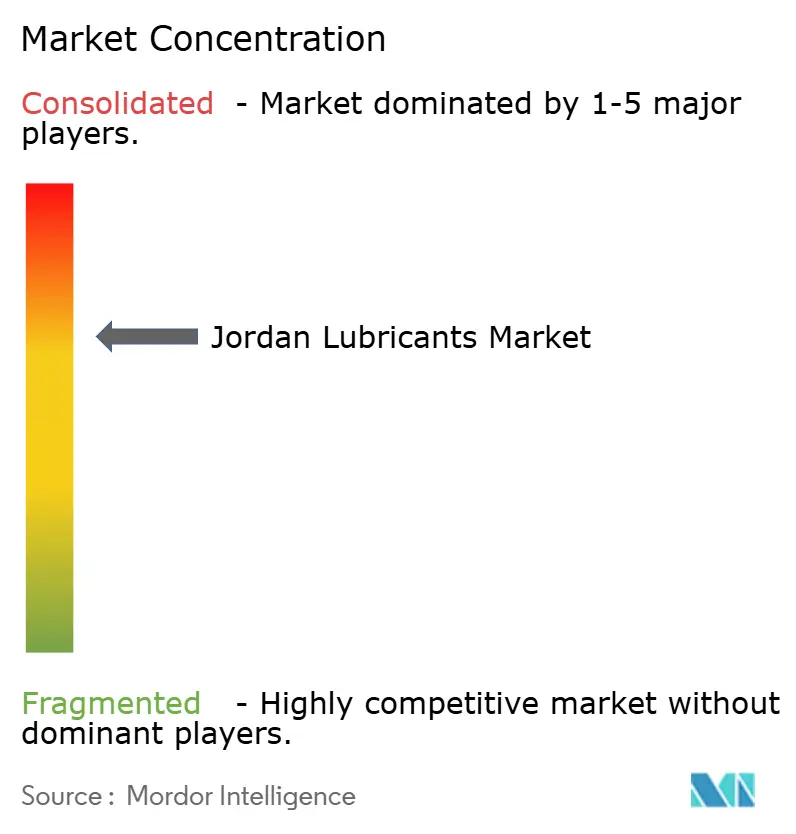
| Market Concentration | Medium |
Major Players *Disclaimer: Major Players sorted in no particular order Image © Mordor Intelligence. Reuse requires attribution under CC BY 4.0. | |
Jordan Lubricants Market Analysis by Mordor Intelligence
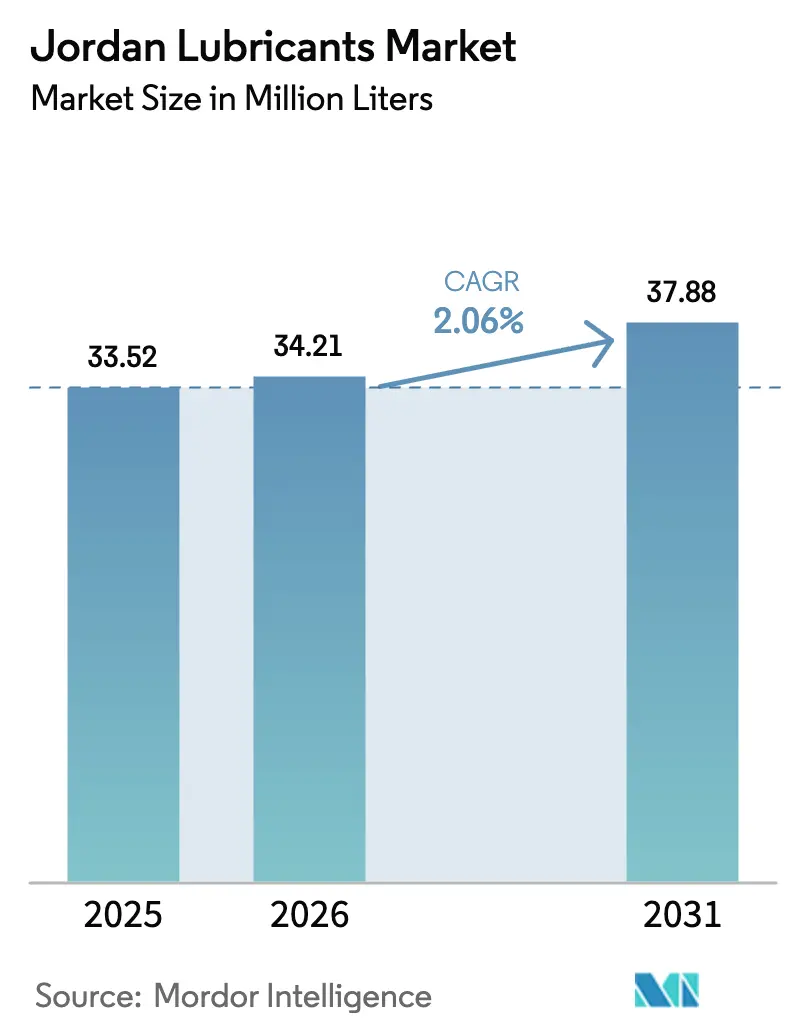
The Jordan Lubricants Market size is expected to increase from 33.52 Million liters in 2025 to 34.21 Million liters in 2026 and reach 37.88 Million liters by 2031, growing at a CAGR of 2.06% over 2026-2031. Expansion in passenger-car ownership, a steady pipeline of power-plant projects, and growing phosphate and potash output underpin demand, while faster adoption of electric and hybrid powertrains and longer drain intervals limit absolute volume growth. The cabinet’s 2025 tax cuts on gasoline, hybrid, and electric vehicles have rebalanced new-car mix toward fuel-efficient models that consume less oil, yet the shift simultaneously accelerates penetration of low-viscosity synthetic formulations that command higher margins. Industrial consumption benefits from the National Electric Power Company’s (NEPCO) 5,200 MW installed base and a planned 700 MW combined-cycle gas-turbine (CCGT) project, both of which require ISO 8068:2024-compliant turbine oils. Bio-based and re-refined lubricants gain policy tailwinds from the Ministry of Environment’s Energy Sector Green Growth National Action Plan 2021–2025, which prioritizes renewable feedstocks and tighter hazardous-waste controls.
Key Report Takeaways
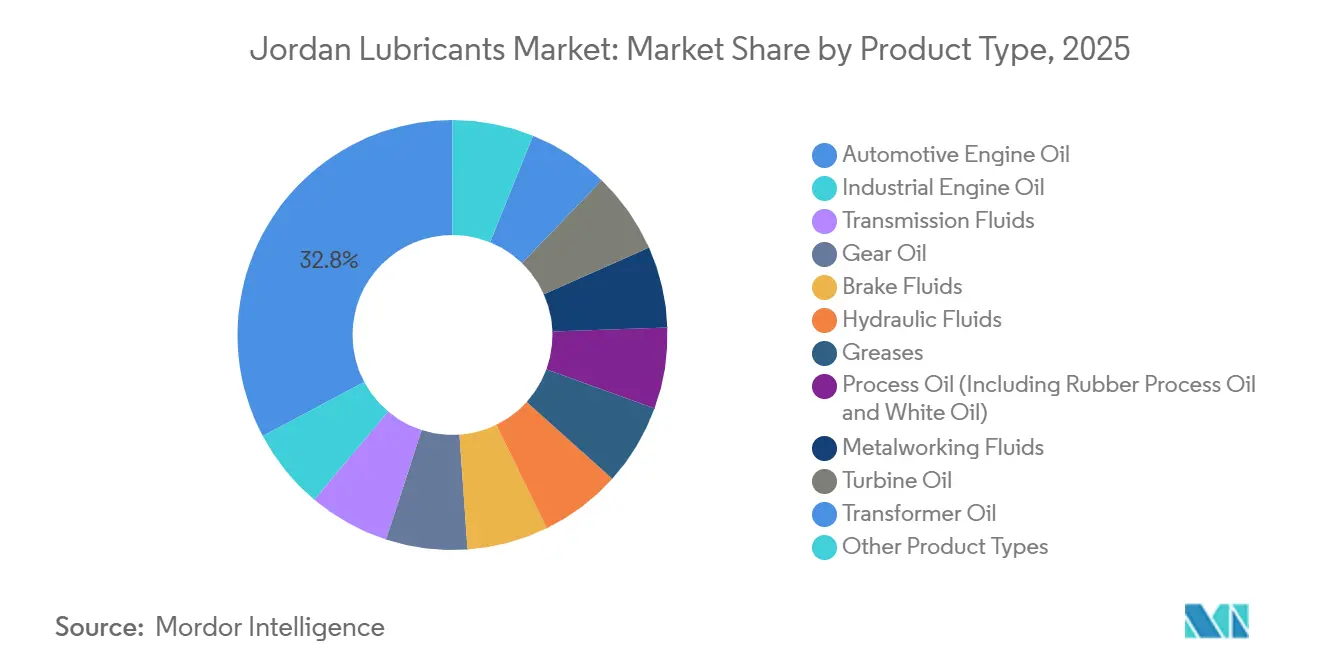
- By product type, automotive engine oil led with 32.78% Jordan lubricants market share in 2025, while industrial engine oil is set to expand at a 2.45% CAGR through 2031.
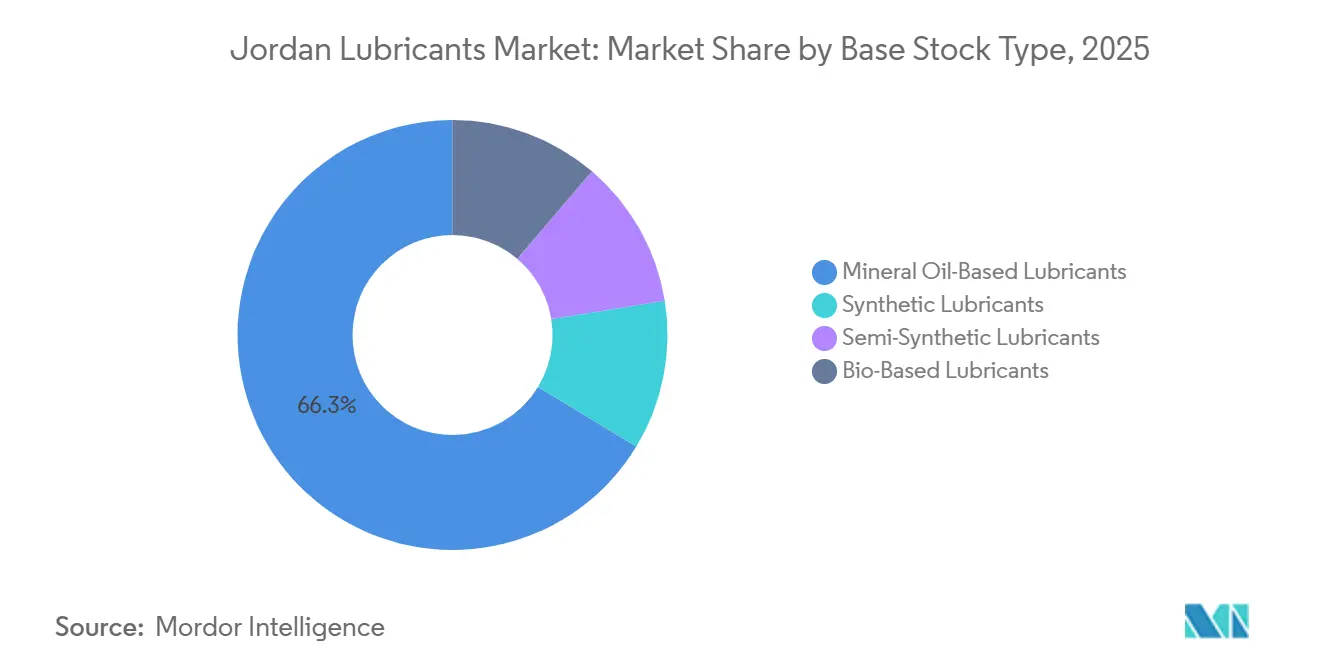
- By base stock type, mineral oil-based lubricants dominated with a 66.32% share in 2025, whereas bio-based lubricants are forecast to post a 2.89% CAGR to 2031.
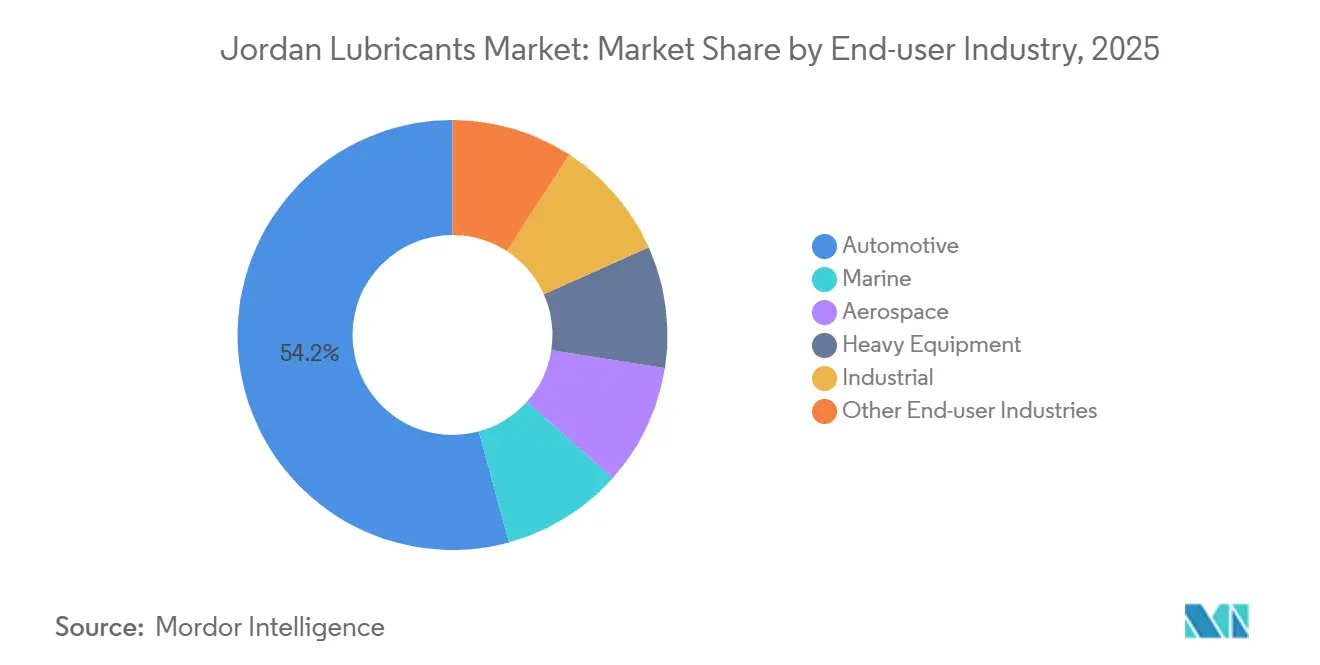
- By end-user industry, automotive accounted for 54.23% of volume in 2025; the industrial segment, however, is projected to grow at a 2.35% CAGR through 2031.
Note: Market size and forecast figures in this report are generated using Mordor Intelligence’s proprietary estimation framework, updated with the latest available data and insights as of January 2026.
Jordan Lubricants Market Trends and Insights
Drivers Impact Analysis*
| Driver | (~) % Impact on CAGR Forecast | Geographic Relevance | Impact Timeline |
|---|---|---|---|
| Surging Vehicle Population in Jordan | +0.6% | National, with concentration in Amman, Irbid, Zarqa governorates | Medium term (2–4 years) |
| Renewed Downstream Investments at Zarqa Refinery | +0.3% | National, supply-chain benefits for Amman industrial zone | Long term (≥ 4 years) |
| Accelerated Roll-Out of Combined-Cycle Gas-Turbine (CCGT) Plants | +0.4% | National, peak demand in Amman East, Samra, Al Qatrana power hubs | Medium term (2–4 years) |
| Mandatory Engine-Efficiency Standards from 2027 | +0.5% | National, early adoption in Greater Amman Municipality fleet procurement | Short term (≤ 2 years) |
| Rapid Growth of Ride-Hailing and Delivery Fleets | +0.2% | Urban centers: Amman, Irbid, Aqaba | Short term (≤ 2 years) |
| Source: Mordor Intelligence | |||
Surging Vehicle Population in Jordan
Vehicle registrations surpassed 2 million in 2024 and are on track to exceed 2.3 million by 2030, anchoring baseline demand for engine, transmission, and brake fluids. Hybrid clearances grew 27% year on year in 2025 following tax cuts, pushing SAE 0W-20 and 5W-30 synthetics deeper into the aftermarket. Private ownership climbed 6.4% during 2024, yet new import rules effective November 2025 restrict electric vehicles older than three years, lifting quality benchmarks that indirectly elevate lubricant performance requirements. The Jordan Standards and Metrology Organization (JSMO) tests every batch at its ISO/IEC 17025:2017-accredited lab, ensuring minimum viscosity, flash point, and base-number thresholds are met[1].
Renewed Downstream Investments at Zarqa Refinery
Jordan Petroleum Refinery Company (JPRC) plans a USD 2.6 billion upgrade to lift crude capacity to 120,000 bpd, though talks with the Sinopec-Itochu consortium remain unresolved. Even during delay, JPRC’s 25,000 t/yr blending plant, certified to ISO 9001:2015 and approved by Mercedes-Benz and GE, supplies more than 100 grades locally. A successful expansion would unlock domestic Group II/III base oil streams, reducing import dependence and enabling premium synthetic blends.
Accelerated Roll-Out of CCGT Plants
NEPCO’s installed 5,200 MW fleet includes several CCGT units, and a 700 MW tender published in November 2025 signals more turbines to come. ISO 8068:2024 raises oxidative-stability and volatility bars for turbine oils, promoting Group III+ and ester chemistries that support extended drain intervals. Reliable baseload gas capacity remains essential as Jordan targets 31% renewable electricity by 2030.
Mandatory Engine-Efficiency Standards from 2027
Jordan intends to align with Euro 6 norms starting in 2027, driving demand for low-SAPS oils that protect diesel particulate filters. The Gulf Standards Organization’s GSO 1785-2:2023 already references ACEA sequences and provides a regional template. OEMs consequently specify thinner grades—SAE 0W-20 and below—that rely on Group III+ or PAO base stocks for cold-crank and volatility targets.
Restraints Impact Analysis*
| Restraint | (~) % Impact on CAGR Forecast | Geographic Relevance | Impact Timeline |
|---|---|---|---|
| Political and Economic Instability | -0.4% | National, spillover from regional tensions (Gaza, Syria) | Medium term (2–4 years) |
| Premium-Grade Lubricant Price Inflation Vs. Regional Peers | -0.3% | National, competitive pressure from GCC imports (Saudi Arabia, UAE, Kuwait) | Short term (≤ 2 years) |
| Expansion of Electric-Bus Pilots in Amman Reducing Engine Oil Demand | -0.2% | Greater Amman Municipality, planned expansion to 4 additional BRT lines | Medium term (2–4 years) |
| Source: Mordor Intelligence | |||
Political and Economic Instability
Public debt stood at 112.5% of GDP in 2023, and the USD 1.2 billion IMF facility effective March 2024 obliges fiscal tightening, limiting public spending on fleet renewal. GDP grew only 2.6% in 2024 with similar expectations for 2025, slowing discretionary upgrades. Regional shocks from the Gaza crisis and the Syrian refugee burden dilute tourism receipts and remittances, reducing lubricant purchases. Environmental fines under the 2017 Protection Law reach JOD 10 million for severe contamination, adding compliance costs that smaller blenders struggle to absorb.
Premium-Grade Lubricant Price Inflation Vs. Regional Peers
Absence of integrated Group II/III refining inflates import bills; Saudi, UAE, and Kuwaiti suppliers land synthetics 10–15% cheaper, squeezing Jordanian distributors. Castrol’s MoreCircular initiative showcases lower-carbon, re-refined base oils, but Jordan lacks a robust used-oil collection network, limiting local circular supply. JSMO’s four-stage certification secures product quality, yet the process adds cost and time to market entry[2].
*Our forecasts treat driver/restraint impacts as directional, not additive. The impact forecasts reflect baseline growth, mix effects, and variable interactions.
Segment Analysis
By Product Type: Industrial Engine Oil Outpaces Automotive Growth
Automotive engine oil held 32.78% of Jordan lubricants market share in 2025, yet industrial engine oil is forecast to register a 2.45% CAGR to 2031, outstripping every other category. Heavy-duty CK-4 and ACEA E9 oils serve haul trucks at Jordan Phosphate Mines Company and Arab Potash Company, while turbine oils meet ISO 8068:2024 standards in NEPCO’s CCGT fleet. Transmission, gear, and hydraulic fluids support the USD 2.5 billion Aqaba–Amman desalination build, with thousands of pumps and actuators coming online.
Castrol’s MoreCircular program validated re-refined base oils globally, but Jordan’s collection rate remains low, limiting near-term supply. JSMO’s ISO/IEC 17025 lab tests viscosity, density, flash point, pour point, and base number, underpinning product credibility. JPRC’s 25,000 t/yr plant offers 100-plus grades, positioning JoPetrol to win tenders once domestic base-oil supply materializes through the refinery upgrade.

By Base Stock Type: Bio-Based Gains Traction amid Mineral Dominance
Mineral oil-based lubricants captured 66.32% of volume in 2025, yet bio-based lubricants are projected to clock a 2.89% CAGR through 2031, the fastest across base-stock groups. The Energy Sector Green Growth plan encourages biodegradable fluids in forestry, agriculture, and open-system hydraulics. Scientific literature reports 60–80% biodegradability within 28 days for ester-based lubricants, well above mineral benchmarks.
Synthetic and semi-synthetic blends fulfill low-viscosity passenger-car requirements—SAE 0W-16 and below—that hinge on Group III+ or PAO chemistries. Jordan’s 2017 Environmental Protection Law sets stiff fines and even prison for hazardous-waste violations, nudging users toward lower-toxicity products. Shell’s local distributor already supplies biodegradable hydraulic fluids to Aqaba port, signaling early adoption.
By End-user Industry: Industrial Segment Accelerates on Power and Mining
Automotive represented 54.23% of volume in 2025; however, the industrial segment is on course for a 2.35% CAGR to 2031, lifted by power generation, mining, and infrastructure spending. The planned 700 MW CCGT facility and existing 5,200 MW portfolio sustain turbine-oil and transformer-oil demand.
Mining consumes large volumes of diesel engine oil, gear oil, and hydraulic fluid in phosphate and potash operations. The two-wheeler fleet expands after 2025 duty cuts, supporting small but rising volumes of motorcycle oils. Greater Amman’s electric-bus roll-out trims diesel demand yet opens a niche for e-driveline lubricants.
Geography Analysis
Amman, Irbid, and Zarqa anchor more than half of lubricant consumption, mirroring vehicle registrations and industrial load centers. Amman hosts the BRT Green Line, ride-hailing fleets, and premium-oil retailers, while Zarqa is home to JPRC’s blending facility and the prospective refinery upgrade. Aqaba port drives marine-oil demand and functions as the entry gate for imported base stocks from GCC refiners, although land transport costs erode price competitiveness.
The cabinet’s 2025 tax reforms and the November 2025 import-quality mandate improve fleet efficiency but tilt usage toward low-viscosity synthetics, primarily in urban zones. Rural governorates lag in charging infrastructure despite USD 15 million earmarked for Greater Amman chargers, creating an uneven transition to electric powertrains. Cross-border competition persists; GCC suppliers leverage economies of scale to land synthetics at double-digit discounts.
Environmental oversight remains strict, especially near Aqaba’s marine ecosystem and in mining districts. Fines that reach JOD 10 million for severe contamination push operators toward biodegradables and certified waste-oil collection programs. NEPCO’s grid-expansion plans sustain transformer-oil demand countrywide, while smart-meter roll-outs will enlarge the pool of dielectric fluids required in distribution assets.
Regulatory Landscape
Jordan lubricants quality and labeling requirements are governed primarily by the Jordan Standards and Metrology Organization (JSMO), which issues and updates national standards and enforces compliance through market inspections and batch testing. Enforcement activity remained visible in July 2026, when JSMO reported seizing 1,212 non-compliant engine-oil bottles, reinforcing the need for documented conformity across viscosity and performance claims.
Downstream petroleum activities, including petroleum-derivatives marketing, operate under licensing and oversight frameworks involving the Energy and Minerals Regulatory Commission (EMRC). Testing and competence assurance are supported by accredited laboratories under the Jordan Accreditation System, including services such as the Royal Scientific Society (RSS) petroleum and chemical laboratories. On the trade side, the Jordan Integrated Customs Tariff classifies many lubricants and lubricating preparations under HS 2710, which commonly carries a 15% customs duty, shaping landed cost versus GCC imports.
Value Chain Analysis
Jordan’s lubricants value chain starts with imported base oils and additive packages, given limited domestic base-oil production, and moves into local blending, packaging, and quality assurance. Domestic supply is anchored by Jordan Petroleum Refinery Company (JoPetrol/JPRC), which operates a lubricants blending facility cited at about 25,000 tons per single shift and supplies a broad slate of automotive and industrial grades, and by Jordan National Lube Oil Company (JNLO, Zaitak under Sayegh Group), which is positioned as an additional local blender using virgin base stocks and imported additives.
Quality control and compliance testing sit mid-chain as a gating step for market access, with JSMO requirements and accredited lab testing (including RSS capabilities) influencing formulation, labeling, and release schedules. Distribution runs through fuel-station networks, workshops, fleet and industrial tenders, and specialty distributors that bring in premium international brands (for example, FUCHS via a local agent), while Aqaba functions as an import gateway for base oils and finished lubricants. Procurement actions such as JoPetrol’s 2025 tender for static dissipator additives illustrate the ongoing need to source specialty chemicals, creating entry points for additive suppliers and logistics providers that can meet documentation and specification demands.
Competitive Landscape
Global majors—Shell, TotalEnergies, ExxonMobil, Castrol, and Chevron—share shelves with JoPetrol and ADNOC Distribution in a moderately fragmented arena. Shell’s distributor, International Overseas Trading EST., supplies industrial and marine customers, leveraging Tellus hydraulics and Corena compressor oils. TotalEnergies managed roughly 180 filling stations until Vivo Energy agreed to acquire the business in November 2025, a move that will bring the Engen brand and may realign lubricant portfolios.
JoPetrol generated JOD 73 million net profit in fiscal 2024, backed by ISO 9001 quality systems and OEM seals from Mercedes-Benz and GE. The stalled refinery upgrade caps vertical integration, yet local blending still offers responsiveness and lower freight costs for domestic customers. Castrol relies on multiple third-party distributors and promotes re-refined MoreCircular lines to differentiate.
Barriers to entry remain high due to JSMO’s certification regime and capital requirements for blending plants. Strategy focus centers on technical support, OEM approvals, and specialty niches like low-SAPS or biodegradable fluids. Price pressure from GCC imports forces Jordanian suppliers to emphasize service, lab testing, and rapid delivery instead of discounts.
Jordan Lubricants Industry Leaders
-
TotalEnergies
-
Zaitak (Jordan National Lube Oil Company LLT)
-
Shell plc
-
Castrol Limited
-
Scope Lubricants
- *Disclaimer: Major Players sorted in no particular order
Market Opportunities and Future Outlook
One clear whitespace in Jordan is the build-out of premium, low-viscosity and low-SAPS formulations aligned with tighter engine-efficiency and emissions requirements. This is supported by the planned Euro 6-aligned move starting in 2027 and by JSMO’s batch-testing and enforcement posture. Hybrid adoption accelerated after the cabinet’s 2025 tax cuts, shifting the in-use fleet toward specifications such as SAE 0W-20 and 5W-30 that lean on higher-quality base stocks and additive systems. That shift creates room for OEM-approved synthetics and stronger technical service through the workshop channel.
Industrial opportunities focus on turbine, transformer, hydraulic, and heavy-duty diesel oils tied to power generation and large projects. They include NEPCO’s 5,200 MW installed base and the 700 MW CCGT tender published in November 2025, which increases the installed turbine population requiring ISO 8068:2024-compliant turbine oils. Circular and lower-toxicity lubricants are another opening: the Ministry of Environment’s Energy Sector Green Growth National Action Plan 2021-2025 prioritizes renewable feedstocks and tighter hazardous-waste controls. At the same time, Jordan still lacks a robust used-oil collection network, leaving scope for organized collection, re-refining partnerships, and biodegradable product adoption in open-system hydraulics and sensitive operating zones such as Aqaba.
Recent Industry Developments
- July 2026: Vivo Energy completed the acquisition of TotalEnergies Marketing Jordan, bringing the acquired fuels and lubricants operations under its ownership and introducing the Engen retail brand to the Kingdom. The combination provides a larger forecourt and commercial footprint to rebalance lubricant portfolios, strengthen route-to-market control, and expand bundled offers to fleets and industrial customers.
- July 2026: The Jordan Standards and Metrology Organization (JSMO) seized 1,212 non-compliant engine-oil bottles during market inspections. The action raised the compliance bar for importers, blenders, and distributors by increasing the commercial risk of sub-spec products and reinforced the role of testing and certification in protecting branded channels.
- November 2025: Vivo Energy signed an agreement to acquire TotalEnergies Marketing Jordan, covering about 180 service stations along with the fuels and lubricants business. The deal marks Vivo Energy entry into the Jordan market and sets up a platform for portfolio reshaping and network-driven lubricant penetration once regulatory clearance is obtained.
Research Methodology Framework and Report Scope
Market Definition and Coverage
This market covers lubricants consumed within Jordan across automotive and industrial use, measured as finished lubricant volumes sold into end users through all major channels during the year.
Scope exclusions: Excluded from this sizing are fuel additives and non-lubricating process chemicals that are not used mainly for lubrication.
Segmentation Overview
- By Product Type
- Automotive Engine Oil
- Industrial Engine Oil
- Transmission Fluids
- Gear Oil
- Brake Fluids
- Hydraulic Fluids
- Greases
- Process Oil (Including Rubber Process Oil and White Oil)
- Metalworking Fluids
- Turbine Oil
- Transformer Oil
- Other Product Types
- By Base Stock Type
- Mineral Oil-Based Lubricants
- Synthetic Lubricants
- Semi-Synthetic Lubricants
- Bio-Based Lubricants
- By End-user Industry
- Automotive
- Passenger Vehicles
- Commercial Vehicles
- Two-Wheelers
- Marine
- Aerospace
- Heavy Equipment
- Construction
- Mining
- Agriculture
- Industrial
- Power Generation
- Metallurgy and Metalworking
- Textiles
- Oil and Gas
- Other End-user Industries
- Automotive
Data Sources, Market Sizing, and Validation
Desk Research
Desk research was used to build the baseline demand context for lubricants in Jordan and to anchor realistic volume movement by application. We referred to public sources such as Jordan Department of Statistics releases, Jordan Customs trade statistics, the International Energy Agency for energy demand indicators, and OICA type vehicle parc and sales references where applicable.
To interpret how those numbers translate into lubricant demand, we also reviewed technical references and standards bodies such as API and SAE publications, along with peer reviewed articles on drain intervals and viscosity migration. We then cross checked with company annual reports, investor presentations, and credible local business press. For trade flows and price direction checks, we supplemented with an import and export shipment-level database and a news and financials subscription to confirm timing of notable market events. The sources listed here are illustrative only, and many other public and paid references were also used for data collection, validation, and clarification.
Primary Interviews and Surveys
We use interviews and surveys with lubricant distributors, workshops, fleet operators, industrial maintenance teams, and public-sector energy or transport specialists in Jordan. Their feedback tests drain intervals, product mix, channel margins, local blending, stock changes, and demand gaps, helping us adjust secondary series and final assumptions.
Distribution of primary research fieldwork respondents
| Company type | Respondent position |
|---|---|
| Top tier: 28% | CXOs: 18% |
| Mid tier: 47% | Functional/Unit leaders: 31% |
| Smaller Players: 25% | Managers: 51% |
Market-Sizing & Forecasting
Sizing started with a top-down demand-pool build where the vehicle parc and activity indicators were converted into lubricant consumption using typical drain intervals and average sump fills. Industrial demand was added using output proxies tied to power generation and heavy equipment activity. After forming the first total, we stress tested it with selective bottom-up checks, including sampled distributor throughput, workshop consumption patterns, and an average selling price times volume sense check to keep the totals realistic.
Key inputs used in the model included the on-road vehicle parc trend, engine oil change intervals by vehicle type, and the mix shift from mineral to synthetic and semi-synthetic oils. For industrial activity, we used signals linked to power generation and metals or general manufacturing, and we tracked import intensity for finished lubricants. Forecasts were produced using scenario analysis supported by simple trend fitting, where the main drivers were adjusted based on what interviewees expected for vehicle utilization, industrial projects, and lubricant grade migration. When bottom-up signals were incomplete for smaller channels, we handled the gaps by applying validated channel shares and then reconciling back to the demand-pool total.
Data Validation & Update Cycle
Outputs were checked against independent signals such as import volumes, major category mix expectations, and whether implied per-vehicle consumption stayed within a reasonable band for Jordan. Any unusual jumps were reviewed again, and follow-up calls were triggered when the gap could not be explained by a known event such as a price swing or a temporary trade disruption.
Before sign-off, another analyst rechecked formulas, units, and assumptions to ensure the story aligns with the numbers. The report is refreshed annually, and if a material event occurs, for example a major regulation change or a sharp shift in base oil pricing, we revisit key inputs and update the model. Right before delivery, we run a final quick pass to confirm the latest data points are reflected.
Mordor Intelligence's Jordan Lubricants Market Size Versus Other Published Estimates
Published market sizes for Jordan lubricants can look far apart even when they cover the same country, because they may measure value versus volume, apply different product boundaries, or assume different pricing and grade mixes. We treat these differences as normal, so the right way to read any number is to check what is included, what is excluded, and which year and unit it represents.
The table also shows that the largest gaps often come from unit choice and scope choice, where value-based figures move with price assumptions and currency timing, while volume-based figures track physical consumption more directly. It also helps to confirm whether estimates include greases and process oils, and whether the forecast path assumes a faster shift toward synthetics or keeps the mix closer to the current profile.
Benchmark comparison
| Source | Market Size | Gaps in Research Methodology |
|---|---|---|
| Mordor Intelligence | USD 0.03 B (2025) | |
| Industry Publisher A | USD 0.14 B (2026) | This figure is reported in value terms and can move materially based on assumed average prices, synthetic share ramp, and currency conversion timing. It also appears to project a faster growth path, which lifts the reported year even if underlying volumes grow slowly. |
| Trade Commentary B | USD 0.03 B (2025) | This estimate is presented as a single point projection and does not show how industrial categories, greases, or specialty fluids are treated. Limited visibility on validation checks makes it hard to see whether the number was reconciled against trade flows and service-channel consumption. |
The table shows that the spread is driven more by how pricing and scope are handled than by a disagreement on basic demand direction. In Mordor Intelligence's model, the market is sized from stated liters and then expressed in USD using a simple implied value, which avoids overstating the total when price assumptions are aggressive. With clear unit tracking and repeatable checks, users can map the number back to real consumption drivers and update it when the key inputs change.
Key Questions Answered in the Report
How large is the Jordan lubricants market in 2026?
The Jordan lubricants market size stands at 34.21 million liters in 2026 and is projected to reach 37.88 million liters by 2031.
What impact will electric-bus deployments have on lubricant consumption?
Electric buses reduce diesel-engine oil volumes but still require drivetrain fluids, greases, and coolants, slightly reshaping but not eliminating fleet lubricant needs.
Which lubricant product segment is expanding the fastest?
Industrial engine oil is projected to record the highest growth, at 2.45% CAGR through 2031.
How will upcoming emission standards affect lubricant specifications?
Planned Euro 6-aligned rules in 2027 will boost demand for low-SAPS, low-viscosity synthetic oils that protect after-treatment devices.