
Market Overview
| Study Period | 2018 - 2031 |
|---|---|
| Forecast Data Period | 2026 - 2031 |
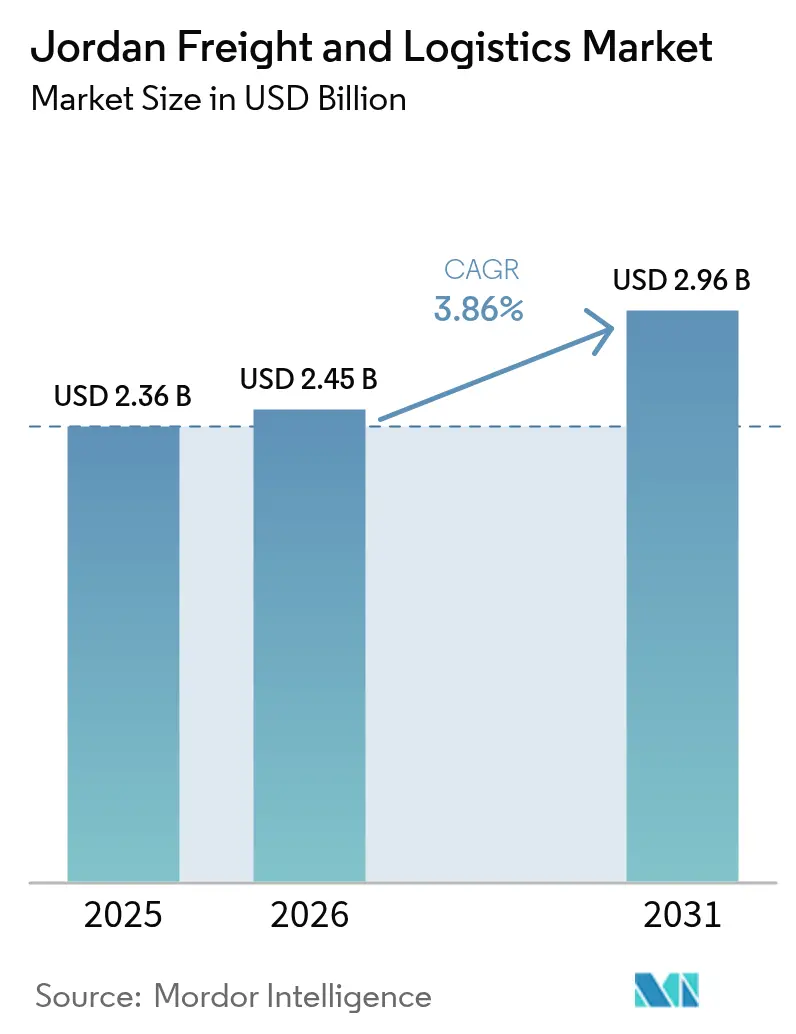
| Base Year Market Size (2025) | USD 2.36 Billion |
| Market Size (2026) | USD 2.45 Billion |
| Market Size (2031) | USD 2.96 Billion |
| Growth Rate (2026 - 2031) | 3.86 % |
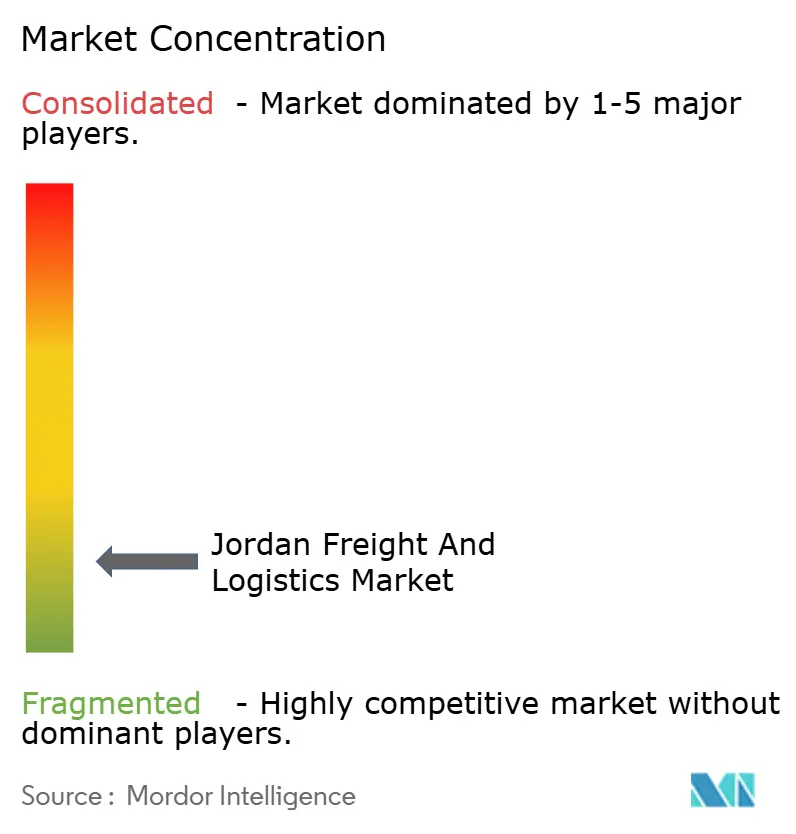
| Market Concentration | Low |
Major Players *Disclaimer: Major Players sorted in no particular order Image © Mordor Intelligence. Reuse requires attribution under CC BY 4.0. | |
Jordan Freight And Logistics Market Analysis by Mordor Intelligence
The Jordan freight and logistics market size is expected to grow from USD 2.36 billion in 2025 to USD 2.45 billion in 2026 and is forecast to reach USD 2.96 billion by 2031 at 3.86% CAGR over 2026-2031. Rising Gulf investment, steady manufacturing output, and steady e-commerce adoption keep freight volumes expanding even as regional shipping lanes realign. Public–private partnerships under the Economic Modernization Vision channel USD 2.3 billion into roads, rail, and port upgrades, anchoring Jordan’s role as a transit gateway for cargo moving between Asia, the Levant, and the Gulf. Container diversions caused by Red Sea disruptions are funneling additional throughput through Aqaba Port, while airport cold-chain expansions lift the share of high-value perishables and pharmaceuticals. Digital freight platforms, government vehicle-tracking mandates, and 960 automated public services collectively improve shipment visibility, reduce empty back-haul ratios, and reinforce the Jordan freight and logistics market as a regional reliability hedge.
Key Report Takeaways
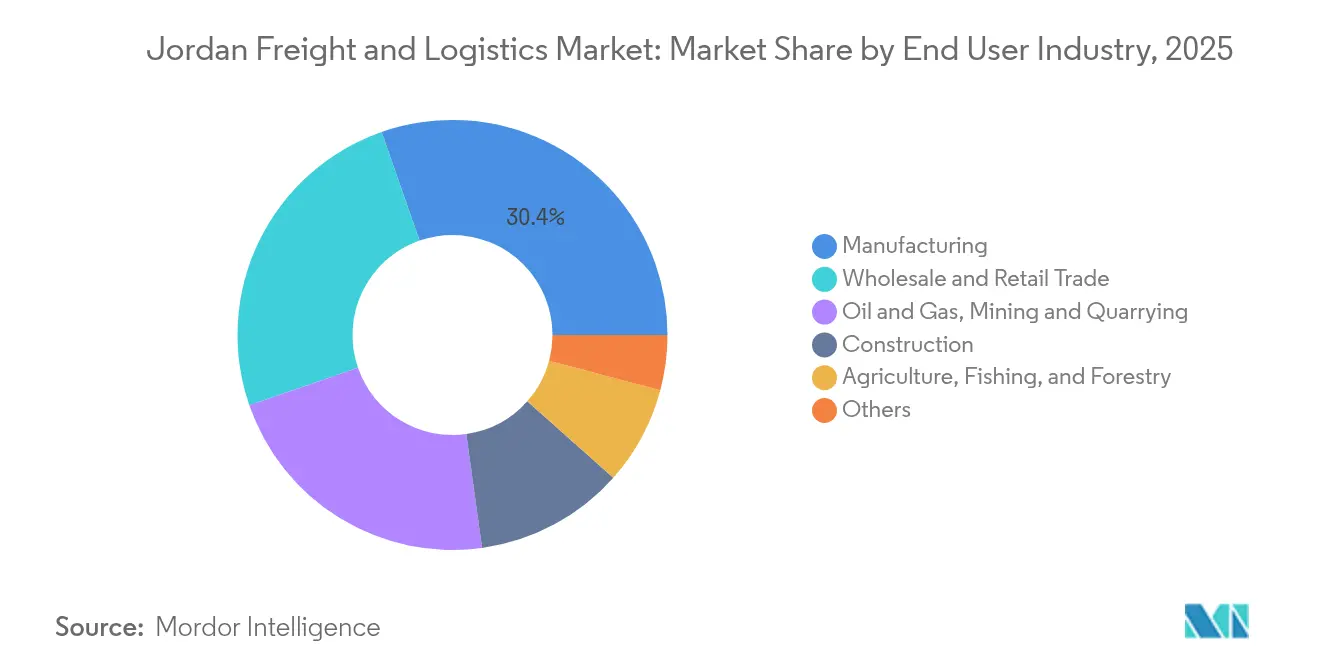
- By end user industry, manufacturing generated 30.35% of the Jordan freight and logistics market share in 2025, while wholesale and retail trade is projected to expand at a 4.18% CAGR between 2026 and 2031.
- By logistics function, freight transport led with 53.55% of the Jordan freight and logistics market size in 2025, while courier, express, and parcel (CEP) posted the fastest projected CAGR at 4.55% between 2026 and 2031.
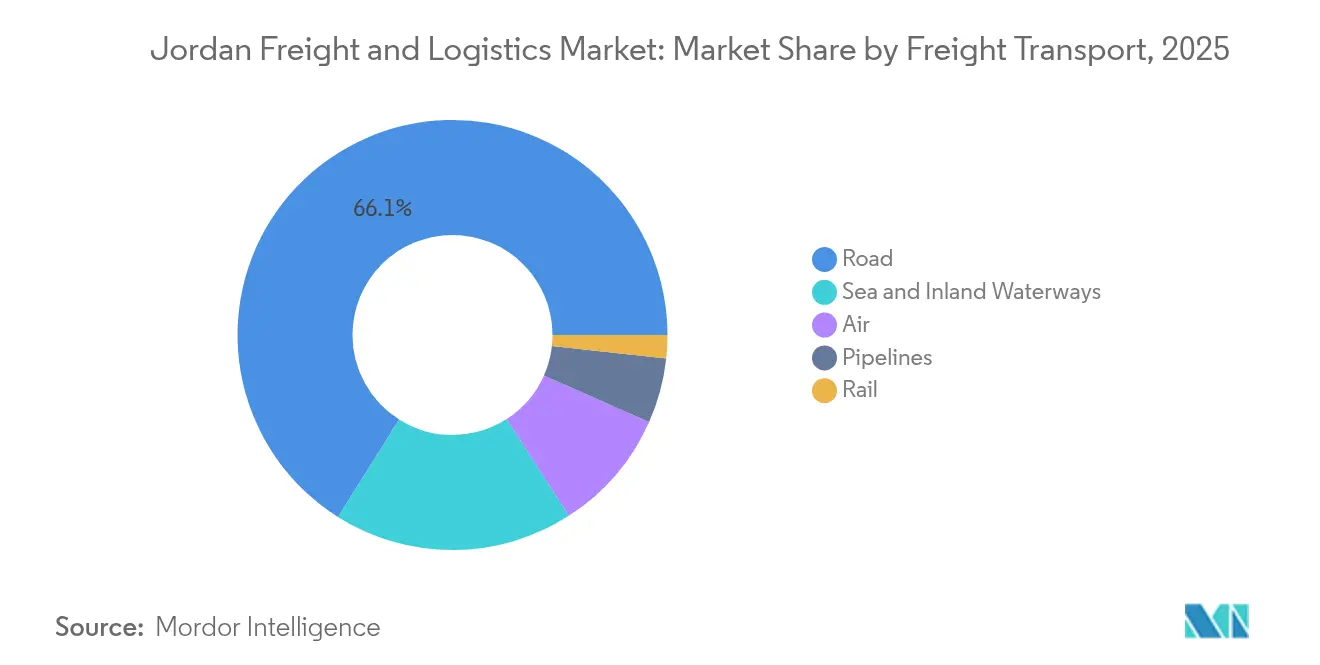
- By freight transport mode, road freight transport captured 66.05% revenue share in 2025; air freight transport is projected to advance at a 5.02% CAGR between 2026 and 2031.
- By CEP segment, domestic services held 64.85% revenue share in 2025, whereas international CEP is forecast to climb at a 4.71% CAGR between 2026 and 2031.
- By warehousing and storage, non-temperature controlled facilities accounted for 91.88% of the revenue share in 2025; temperature controlled space records the highest segment CAGR (2026-2031) at 4.55%.
- By freight forwarding mode, sea and inland waterways freight forwarding commanded 67.95% revenue share in 2025, and air freight forwarding shows the quickest projected 4.46% CAGR between 2026 and 2031.
Note: Market size and forecast figures in this report are generated using Mordor Intelligence’s proprietary estimation framework, updated with the latest available data and insights as of 2026.
Jordan Freight And Logistics Market Trends and Insights
Drivers Impact Analysis*
| Driver | (~) % Impact on CAGR Forecast | Geographic Relevance | Impact Timeline |
|---|---|---|---|
| Jordan allocates USD 2.3 billion for logistics CapEx under economic modernization vision 2023-25 | +0.8% | National, focused on the Amman–Aqaba corridor | Medium term (2-4 years) |
| Aqaba port in Jordan sees a significant surge in container throughput, bolstered by the impending GCC rail link | +0.6% | Southern Jordan, extending to GCC markets | Long term (≥ 4 years) |
| EU near-shored cargo volume routed through Jordan sees a considerable increase | +0.5% | National, emphasis on northern trade routes | Short term (≤ 2 years) |
| Queen Alia airport in Jordan sees a significant surge in air-reefer exports for pharma and fresh produce | +0.4% | Central Jordan, global export reach | Medium term (2-4 years) |
| Rising government regulatory reforms and trade facilitation initiatives | +0.4% | National, with border crossing focus | Medium term (2-4 years) |
| Accelerated adoption of digital freight platforms e.g., Trella | +0.3% | National, urban concentration | Short term (≤ 2 years) |
| Source: Mordor Intelligence | |||
Jordan Allocates USD 2.3 Billion for Logistics CapEx under the Economic Modernization Vision
Capital commitments across 344 projects fund modern roads, a north–south rail spine, and first-mile digitization for customs clearances. The program integrates private finance to accelerate design–build cycles and targets one million youth job placements by 2033. A dedicated freight line between Aqaba and Maan will remove heavy trucks from key highway segments, cut fuel burn, and allow 25-car unit trains to haul minerals and containers. Expanded truck rest areas, weigh-in-motion sensors, and smart tolling are set to trim journey times on the Amman Ring Road. Early macro signals already show national exports up 8.1% year-on-year in February 2025, while FDI climbed 3.7% in 2024, underscoring the Vision’s near-term stimulus.
Aqaba Port Sees Higher Throughput, Boosted by the Future GCC Rail Link
The three-berth container terminal now works with larger Post-Panamax vessels after recent quay dredging and yard automation upgrades[1]Jordan Logistics Cluster, “Aqaba Port Factsheet,” lca.logcluster.org. With Suez Canal volumes down 82% during security incidents, carriers repositioned strings to Aqaba, swelling import flows to Jordan and re-export cargo to Saudi Arabia and Iraq. Planned rail interoperability will connect the port to the 2,177 km GCC network engineered to shift up to 31 million tons annually, unlocking long-haul, low-carbon inland corridors. Maersk alone has invested USD 300 million since 2006 and targets a 70% cut in terminal emissions by 2030.
Queen Alia Airport Captures High-Value Cold-Chain Exports
Pharmaceuticals and fresh produce benefit from new apron-side cool rooms, GDP-certified handling, and upgraded reefers. The Cool Up program backs technology retrofits and technician training that lift temperature-compliance rates above 98%[2]Cool Up Programme, “Cold-Chain Retrofit Case Studies,” coolupprogramme.org. Etihad Cargo doubled its regional cool-chain lift, while WDA(H)-licensed forwarders such as Aramex ensure audit trails that satisfy EU Good Distribution Practice for vaccines. Ongoing USAID support for IoT sensor deployment lets customs and shippers scan real-time temperature logs, reducing claims and deepening exporter confidence.
EU Near-Shored Cargo Volume Through Jordan Jumps
Retailers and automotive OEMs seeking swift replenishment now truck containers from Haifa and Aqaba across Jordan to Gulf free zones, trimming door-to-door times by as much as 10 days. Jordan’s road network ranks 35th globally for competitiveness and supports 40-ton semitrailers on multilane highways. Customs fee waivers and 5% corporate income tax inside investment zones reinforce Jordan’s draw as an inflation-hedge hub for European shippers. Automated single-window customs clearance, live in 2025, now clears compliant consignments in under two hours, supporting the Jordan freight and logistics market in absorbing redirected European orders.
Restraints Impact Analysis*
| Restraint | (~) % Impact on CAGR Forecast | Geographic Relevance | Impact Timeline |
|---|---|---|---|
| Outside Amman, Jordan, most warehousing facilities lack temperature control | -0.4% | Rural and secondary urban areas | Medium term (2-4 years) |
| At Al-Omari, the median border dwell time stands at 22 hours, significantly higher than the GCC average of 6 hours | -0.3% | Northern border with Syria | Short term (≤ 2 years) |
| Rail freight accounts for a significantly smaller share of the national ton-km | -0.2% | Nationwide rail network | Long term (≥ 4 years) |
| Agri trucks face a high dead-head ratio on back-hauls due to water scarcity | -0.2% | Agricultural regions, especially Jordan Valley | Medium term (2-4 years) |
| Source: Mordor Intelligence | |||
Outside Amman, Most Warehousing Stock Lacks Temperature Control
Less than 8% of nationwide space meets GDP-level cold-chain specifications, leaving a service gap for pharmaceuticals, dairy, and floriculture exports. Rural growers often move produce 200 km to Amman for pre-cooling, adding costs and spoilage risk. Cool Up pilot projects are installing solar-powered ammonia CO₂ systems in Mafraq and Irbid, yet network-wide rollout remains years away. The government has earmarked part of the USD 2.3 billion logistics fund for cold-room grants, but land pricing and fragmented ownership slow site aggregation.
Border Dwell Time at Al-Omari Remains Four Times the GCC Average
Trucks queue for security inspections, veterinary checks, and paper manifests, turning the northern crossing into a chronic bottleneck that erodes Jordan’s hub credentials. Each extra hour of waiting inflates operating costs by USD 27 per truck, research by the Ministry of Transport shows[3]Ministry of Transport, “National Transport Strategy 2025,” mot.gov.jo. Planned biometric driver cards and pre-arrival data lodgment are expected to cut hold-ups, but the capital works for extra inspection bays will not finish before 2027. High perishables risk forces exporters to reroute via Saudi entry points, diverting potential traffic away from the Jordan freight and logistics market.
*Our forecasts treat driver/restraint impacts as directional, not additive. The impact forecasts reflect baseline growth, mix effects, and variable interactions.
Segment Analysis
By End User Industry: Manufacturing Leads Logistics Demand
Manufacturing produced 30.35% of logistics revenue in 2025, with chemicals, textiles, and potash processors moving high-frequency loads. Bonded factories in Qualified Industrial Zones exploit duty-free access to the United States, creating steady container flows. Wholesale and retail trade grows at 4.18% CAGR (2026-2031) as omnichannel grocers push regional store penetration and same-day click-and-collect.
Energy projects and civil infrastructure sustain bulky inbound shipments of turbines, steel, and cement. Potash miners near the Dead Sea dispatch 2.5 million tons annually to Asian fertilizer markets via Aqaba, underpinning demand for covered bulk wagons once rail goes live. Agricultural co-operatives, meanwhile, rely on reefer trucks to reach Saudi buyers, although water scarcity keeps back-haul ratios elevated.


By Logistics Function: Freight Transport Dominates Market Structure
Freight Transport generated 53.55% of 2025 revenue, confirming its pivotal role in the Jordan freight and logistics market. General cargo, break-bulk fertilizers, and containerized consumer goods feed stable lane density between Aqaba, Amman, and the Iraqi border. The segment benefits from continuous highway resurfacing and GPS-based weight compliance that limit axle damage and extend fleet life. CEP, though smaller, scales quickly with smartphone adoption and a youthful online shopper base that exceeded 75% of Jordanian internet users in 2024. Digital booking portals bundle transport, customs, and last-mile options, shrinking lead times and boosting pickup density across urban rings.
The Jordan freight and logistics market sees value-added warehousing and freight forwarding integrating more tightly with transport operators to secure end-to-end contracts for big-box retailers. Supply-chain orchestration platforms such as Trella enhance load matching and cut empty mileage. Government tax rebates on Euro 5 trucks sweeten fleet renewal economics and underpin the 3.86% freight and logistics market CAGR (2026-2031). CEP companies ride e-commerce peaks by offering subscription lockers and evening deliveries, while traditional 3PLs tap spare van capacity to penetrate small-parcel flows.
By Courier, Express, and Parcel (CEP): Domestic Services Lead Market Penetration
Domestic CEP accounted for 64.85% of revenue share in 2025, propelled by dense drops inside Greater Amman and Irbid. Same-day services, once a premium add-on, now cover more than half of intra-city orders after vehicle routing algorithms lifted stop counts per van. International parcels grow more briskly at a 4.71% CAGR (2026-2031) as MSMEs export craft wear to Europe under preferential rules of origin. Aggregated return-management hubs in Zarqa pool reverse flows, driving down per-item handling costs.
Cross-border shoppers benefit from live duty calculators and flat-rate clearance fees that the customs single window rolled out in 2025. Major CEP players adopt smart lockers at gas stations, raising first-attempt delivery success above 96%. Blockchain verification for high-value items reduces fraud, reinforcing consumer trust and supporting the Jordan freight and logistics market.
By Warehousing and Storage: Non-Temperature Facilities Dominate Infrastructure
Non-temperature controlled warehouses represented 91.88% of revenue share in 2025, reflecting the historical tilt toward durable consumer goods, garments, and mechanical parts. Such sites cluster along Amman’s Airport Road and the Sahab industrial estate, leveraging six-lane access and high dock density. Temperature controlled space, though only 8.12% in 2025, expands at a 4.55% CAGR (2026-2031) as pharmaceutical majors re-shore regional distribution hubs to Jordan’s free zones.
Demand for 2–8°C rooms outpaces construction as vaccine producers and supermarket chains lock in multi-year leases. Developers retrofit idle sites with insulated panels and trans-critical CO₂ systems, taking advantage of Jordan’s solar abundance to cap energy bills. Cold-room investments also unlock fresh export lanes for strawberries and cherries routed by air to Gulf supermarkets within 24 hours.
By Freight Transport: Road Infrastructure Drives Modal Dominance
Road freight transport commanded 66.05% of segment share in 2025, anchoring the Jordan freight and logistics market on a backbone of 7,000 km of paved highways. Fleet telemetry and a government tracking mandate allow carriers to optimize routing and curb fuel wastage. The 5.02% CAGR (2026-2031) projected for air freight transport reflects expanded cool-chain lift and new weekly pharma charters from Queen Alia Airport into Frankfurt and Singapore. Sea and inland waterways, served by Aqaba, handle heavyweights such as autos and grains, while pipelines continue to move crude and refined products to refinery gates.
The upcoming GCC railway spur promises to recalibrate modal economics by shifting long-haul containers and bulk moves from road to steel wheel. Shippers eye a 30% cost reduction once 1,200-meter-long trains link Aqaba to the Saudi border. Until commissioning, the road remains indispensable for farm-to-port hauls, cement and potash distribution, and aid shipments to Syria. Air freight’s weight share stays minor, yet its value share rises as Jordanians shop cross-border fashion and time-critical medical spare parts.
By Freight Forwarding: Sea and Inland Waterways Routes Leverage Port Connectivity
Sea and inland waterways freight forwarding secured 67.95% of 2025 revenue share, mirroring Aqaba’s status as Jordan’s sole deep-water gateway. Maersk and CMA CGM deploy feeders to Jeddah and Port Said, enabling weekly transshipment cycles. The Jordan freight and logistics market expects air freight forwarding to lift margins faster at 4.46% CAGR (2026-2031) as semiconductor tooling, dialysis consumables, and aerospace spare parts transit through Queen Alia.
Forwarders embed emission dashboards to help shippers compare mode-wise carbon footprints, a feature winning bids from European retailers facing Scope 3 reporting mandates. Rail forwarding remains nascent, but feasibility studies plan roll-on/roll-off wagons that let trucks drive onto flat cars for the Aqaba–Amman trip, shaving five hours off transit.
Geography Analysis
The Amman-Aqaba corridor funnels a majority of national freight, supported by six-lane highways, double-stack container yards, and a steady pipeline of donor-funded upgrades. Gulf investors have placed USD 4 billion on the Amman Stock Exchange since 2020, signaling confidence in the corridor’s continued throughput growth. Expansion of Aqaba Container Terminal creates 500,000 m² of paved stacking ground, enabling the Jordan freight and logistics market to accommodate greater transshipment volumes should Red Sea insecurity persist.
Northern gateways lag. At Al-Omari, 22-hour dwell times suppress traffic toward Syria, and refrigerated haulers often reroute via Al Mudawara to dodge delays. Grain silos at Irbid and Mafraq require better last-mile roads to absorb future rail-to-road handovers. USAID-funded weigh-in-motion sensors are now being installed, a first step toward harmonizing axle standards with GCC neighbours.
Secondary cities such as Zarqa, Karak, and Salt witness rising demand for 3PL services as retail chains spread warehouse spokes beyond the capital. Yet land scarcity and zoning rules keep new builds slow. Mobile cargo apps now link rural drivers with city shippers, improving load factors and incorporating these peripheries into the Jordan freight and logistics market. Once the GCC rail spur is commissioned, planners anticipate dry ports in Mafraq and Ma’an, accelerating hinterland development and balancing today’s corridor concentration.
Regulatory Landscape
Jordan’s freight and logistics regulatory framework is anchored by the Ministry of Transport and the Land Transport Regulatory Commission (LTRC) for land transport oversight, while Jordan Customs governs trade compliance through its Integrated Customs Tariff System and ASYCUDA-based digital tools. In July 2025, the Cabinet approved an agreement to manage and monitor trucks in the Aqaba Special Economic Zone (ASEZA) through a digital Truck Control Project, tightening compliance, visibility, and throughput management around the country’s main maritime gateway.
In May 2026, the Cabinet approved amendments to the Railway Services Licensing Bylaw to modernize rail regulation and align it with international standards, alongside land transport measures to modernize the truck fleet. The package included reducing the maximum import age for tractor-trailer units to five years, requiring decommissioning or re-export of trucks older than 20 years, and offering financial incentives such as exemption from the 16% general sales tax and waivers on registration and licensing fees for two years, which directly affects fleet renewal economics and service quality across the Jordan freight and logistics market.
Value Chain Analysis
Jordan’s logistics value chain starts with shippers in manufacturing, mining (phosphate and potash), wholesale and retail, and agriculture, moving into transport operators (road carriers dominating domestic distribution), freight forwarders and customs brokers, and warehousing providers clustered around Greater Amman and key border and port nodes. The gateway layer is led by Aqaba for maritime flows and Queen Alia International Airport for time-sensitive and cold-chain exports, with Jordan Customs digitalizing trade processes through ASYCUDA modules and maritime facilitation tools, including sector digitization initiatives such as ASYHUB/Golden List modules.
Aqaba’s port and terminal ecosystem remains central to international forwarding and inland distribution, supported by long-duration PPP structures such as the Aqaba Container Terminal concession with APM Terminals extended until 2046. Upgrades are visible both upstream and downstream, with the April 2025 arrival of a USD 13 million ship-to-shore gantry crane at Aqaba Container Terminal (part of a modernization program targeting +180,000 TEU capacity) strengthening quayside productivity, and the July 2025 ASEZA digital truck control and monitoring project aiming to improve gate operations and compliance. Bottlenecks persist at land borders, where dwell time and inspection processes can constrain corridor reliability and lead shippers to use alternate crossings or build in time buffers.
Competitive Landscape
Competition remains fragmented despite the presence of global integrators. Multinationals leverage standardized IT and procurement muscle, while domestic fleets of fewer than 50 trucks still dominate primary haulage corridors. Scale is changing: the April 2025 acquisition of DB Schenker by DSV unites roughly 160,000 employees under one banner, raising the service ceiling for complex aerospace and life-science contracts. Local champions respond by forming asset-light alliances, pooling yards, and sharing customs brokers to retain their share.
Partnerships between global and regional specialists grow. CEVA and Almajdouie’s Saudi JV combines CEVA’s network tools with 2,000 regional tractors, allowing through-billing for Riyadh–Amman milk runs. Jordanian SMEs concentrate on last-mile niches, serving remote villages and offering cash-on-delivery, a must-have option for 55% of e-commerce shoppers in 2024. Market entrants with cold-chain expertise find white-space as only a handful of facilities outside Amman meet GDP certification.
Technology adoption separates leaders from laggards. Major forwarders deploy predictive ETA engines that ingest border wait-time data. Smaller fleets tap shared telematics subscriptions, gaining compliance without large CAPEX. Sustainability credentials also win business; Maersk’s target to cut terminal CO₂ by 70% resonates with European shippers seeking low-carbon corridors. Such differentiated offerings support a vibrant Jordan freight and logistics market even as consolidation progresses.
Jordan Freight And Logistics Industry Leaders
Aramex (Including Aslas)
Naouri Group
DHL Group
A.P. Moller - Maersk
GAC Group (Holdings), Ltd.
- *Disclaimer: Major Players sorted in no particular order

Market Opportunities and Future Outlook
Port operations upgrades and hinterland connectivity programs are creating clearer whitespace around Aqaba-centered multimodal solutions, including bulk-to-port rail flows and higher-productivity terminal handling. In February 2026, AD Ports Group signed a 30-year concession with Aqaba Development Corporation to manage and operate the Aqaba Multipurpose Port, backed by direct capital investment exceeding JOD 130 million, supporting new service offerings for project cargo, general cargo, and integrated port logistics. In April 2026, Aqaba Development Corporation also issued a bid notice (26/A/2026) for the Aqaba Oil and Gas Terminal Development Project, signaling added demand for specialized logistics, safety-compliant storage, and handling services tied to energy cargo.
Rail execution is moving along a more defined pathway for mining-linked freight corridors that can support broader inland logistics networks. In April 2026, definitive agreements were signed to establish a 50-50 joint venture (UAE-Jordan Railway Co.) for the USD 2.3 billion Aqaba Port Railway Project, a 360 km line connecting phosphate and potash mines (including Al Shidiyah and Ghor Al-Safi) to Aqaba. Alongside infrastructure, the Economic Modernisation Vision Executive Program (2026-2029) explicitly prioritizes logistics zones (including in Mafraq) and axle load monitoring systems by 2026, reinforcing opportunities for compliant fleet operators, weigh-in-motion and telematics providers, and 3PLs building hub-and-spoke distribution and bonded/FTZ-linked services. The Jordan-UAE CEPA in effect since May 2025 provides an additional commercial enabler for cross-border logistics and transport services liberalization, supporting new lane development and partnership models between Jordan-based providers and Gulf networks.
Recent Industry Developments
- June 2026: Naouri Logistics announced the opening of a new warehouse facility to expand storage, inventory management, order processing, and distribution capabilities. The added capacity supports higher service levels for domestic distribution and cross-border staging, particularly as transit volumes fluctuate with regional route realignments.
- May 2026: Aramex Jordan launched a tripartite partnership with Jordan Kuwait Bank and Yasir United E-Commerce to combine logistics operations with SME-focused financing and e-commerce enablement. The model targets smoother working-capital access and fulfillment execution for smaller merchants, strengthening domestic CEP and B2B parcel flows across Jordan.
- May 2025: Aramex partnered with Sprinklr to automate 99% of customer service cases and save over 1 million agent hours annually. The initiative supports faster issue resolution and higher delivery success rates at scale, which is important for CEP performance in Greater Amman and other dense urban delivery areas.


Research Methodology Framework and Report Scope
Market Definition and Coverage
This market covers paid freight transportation and logistics services delivered within Jordan, including domestic moves and international legs handled by providers operating in-country. It includes freight transport, freight forwarding, express delivery, and warehousing and related value-added handling, measured as service revenue.
Scope exclusions: We exclude private in-house fleets and internal logistics activities that do not charge a clear service fee.
Segmentation Overview
- End User Industry
- Agriculture, Fishing, and Forestry
- Construction
- Manufacturing
- Oil and Gas, Mining and Quarrying
- Wholesale and Retail Trade
- Others
- Logistics Function
- Courier, Express, and Parcel (CEP)
- By Destination Type
- Domestic
- International
- By Destination Type
- Freight Forwarding
- By Mode of Transport
- Air
- Sea and Inland Waterways
- Others
- By Mode of Transport
- Freight Transport
- By Mode of Transport
- Air
- Pipelines
- Rail
- Road
- Sea and Inland Waterways
- By Mode of Transport
- Warehousing and Storage
- By Temperature Control
- Non-Temperature Controlled
- Temperature Controlled
- By Temperature Control
- Other Services
- Courier, Express, and Parcel (CEP)
Data Sources, Market Sizing, and Validation
Desk Research
Desk research was used to set the size boundaries, build the demand drivers, and sanity-check the trend lines before any interview inputs were applied. For Jordan, we leaned on public macro and trade indicators that tie directly to freight activity, such as Ministry of Transport publications, Jordan Customs statistics, Central Bank of Jordan external sector tables, and Department of Statistics releases.
To ground cross-border flows and modal direction, we also reviewed international datasets such as World Bank trade indicators and UN Comtrade style trade series, along with port and airport statistics where available through official channels. Company annual reports, investor presentations, reputable press coverage, and association updates were reviewed to interpret capacity additions, corridor shifts, and service-mix changes. In addition, paid subscriptions were used selectively for company financials, news and financials, and an import/export shipment-level view to validate assumptions. These desk sources are not exhaustive, and other public documents were also used to collect, cross-check, and clarify specific data points.
Primary Interviews and Surveys
We use expert interviews and surveys with freight forwarders, carriers, warehouse operators, customs agents, shippers, and public-sector transport specialists in Jordan. Their input helps test trade-to-revenue conversion, average charges, empty returns, capacity use, and missing informal activity within the Jordanian market. These discussions also help triangulate assumptions and final estimates against desk evidence. Re-contact is requested when answers conflict materially.
Distribution of primary research fieldwork respondents
| Company type | Respondent position |
|---|---|
| Top tier: 30% | CXOs: 15% |
| Mid tier: 45% | Functional/Unit leaders: 30% |
| Smaller Players: 25% | Managers: 55% |
Market-Sizing & Forecasting
Sizing starts from a top-down build where Jordan trade activity, sector output, and transport service intensity are translated into a country revenue pool for freight and logistics, and then split across service types using interview-backed shares. Once the structure is in place, we corroborate totals with selective bottom-up checks, such as sampled operator revenues, lane and facility level pricing benchmarks, and volume-by-rate approximations where reliable public or interview inputs exist.
Key inputs used in the model include Jordan import and export trends, the mix of domestic distribution versus cross-border movements, warehousing footprint utilization (including multi-client storage), express shipment intensity tied to retail and small parcel flows, and typical rate movements tied to fuel and corridor constraints. When a variable could not be observed directly, the gap was handled through bounded assumptions that were tested with multiple respondents, and the model was only adjusted when a consistent explanation emerged.
Forecasting uses scenario analysis supported by expert views on trade growth, infrastructure and corridor changes, and expected rate progression, and then the final outlook is converted into a single base case path. Because the market can be sensitive to policy shifts and regional disruptions, assumptions were kept visible so they can be re-tested during updates.
Data Validation & Update Cycle
Outputs are checked against independent signals, including trade totals, transport services indicators, and observed pricing direction, before any final figures are locked. If a segment shows a sharp jump that is not supported by trade movement or capacity reality, the driver is traced back to the specific assumption and reviewed again with additional notes from primary calls.
Before sign-off, a second analyst reviews the model logic, unit consistency, and year-on-year movements to catch variance issues that can come from mixed sources or timing differences. Reports are refreshed annually, and interim updates are triggered when material events occur, such as major policy changes affecting border movement or meaningful infrastructure openings. Right before delivery, we do a fresh review pass so clients receive the latest updated view.
Mordor Intelligence's Jordan Freight and Logistics Market Size Compared Against Other Published Estimates
Published market sizes for Jordan freight and logistics often do not match because the underlying scope is not consistent, and the revenue line being counted can shift from one study to another. Differences also come from the handling of cross-border services, the split between transport and warehousing revenue, and how fast rates are assumed to grow over time.
The table shows a noticeable spread that is mainly explained by what is treated as in-scope logistics revenue and what is treated as a broader transport sector total. In the Mordor Intelligence model, the value is limited to paid freight transport, forwarding, express, and third-party warehousing revenue generated within Jordan by licensed providers (which excludes non-charged in-house fleets).
Benchmark comparison
| Source | Market Size | Gaps in Research Methodology |
|---|---|---|
| Mordor Intelligence | USD 2.36 B (2025) | |
| Industry Briefing A | USD 13.30 B (2025) | Uses a wider transport and logistics sector framing that can blend passenger transport, public infrastructure activity, and non-fee internal logistics into the total, which inflates the service-revenue view. |
| Regional Consultancy B | USD 2.57 B (2026) | Starts from a later base year and appears to apply a different rate and growth path for cross-border corridor demand, with limited transparency on whether express and warehousing are fully netted to in-country provider revenue. |
Across the three figures, the biggest drivers are scope boundaries and the year and pricing assumptions used to translate activity into revenue. A scope that stays tied to paid service revenue inside Jordan, and that is cross-checked with trade signals and operator feedback, typically produces a tighter, repeatable market total that can be updated without rewriting the model.


Key Questions Answered in the Report
What is the current value of the Jordan freight and logistics market?
The market is valued at USD 2.45 billion in 2026 and is projected to rise to USD 2.96 billion by 2031.
Which segment holds the largest Jordan freight and logistics market share?
Freight Transport leads, accounting for 53.55% of overall revenue in 2025.
Which freight transport mode is expected to grow the fastest?
Air freight transport is forecast to register the highest 5.02% CAGR between 2026 and 2031, driven by pharmaceuticals and perishables.
How will the GCC railway affect Jordan’s logistics sector?
The 2,177 km network will create a cost-efficient rail option for 31 million t of freight annually, easing road congestion and lowering shipping costs.
Why is temperature-controlled warehousing a growth area?
Rising pharmaceutical output and perishable exports require GDP-compliant cold rooms; current share of the segment is only 8.12% as of 2025, spurring new builds.
What digital initiatives are improving logistics efficiency in Jordan?
A 960-service government single window, vehicle-tracking mandates, and blockchain-enabled courier chains are cutting border delays and enhancing shipment transparency.
Page last updated on:


 Your data is secure and never sold or shared.


