Jet Fuel Market Size and Share
Market Overview
| Study Period | 2021 - 2031 |
|---|---|
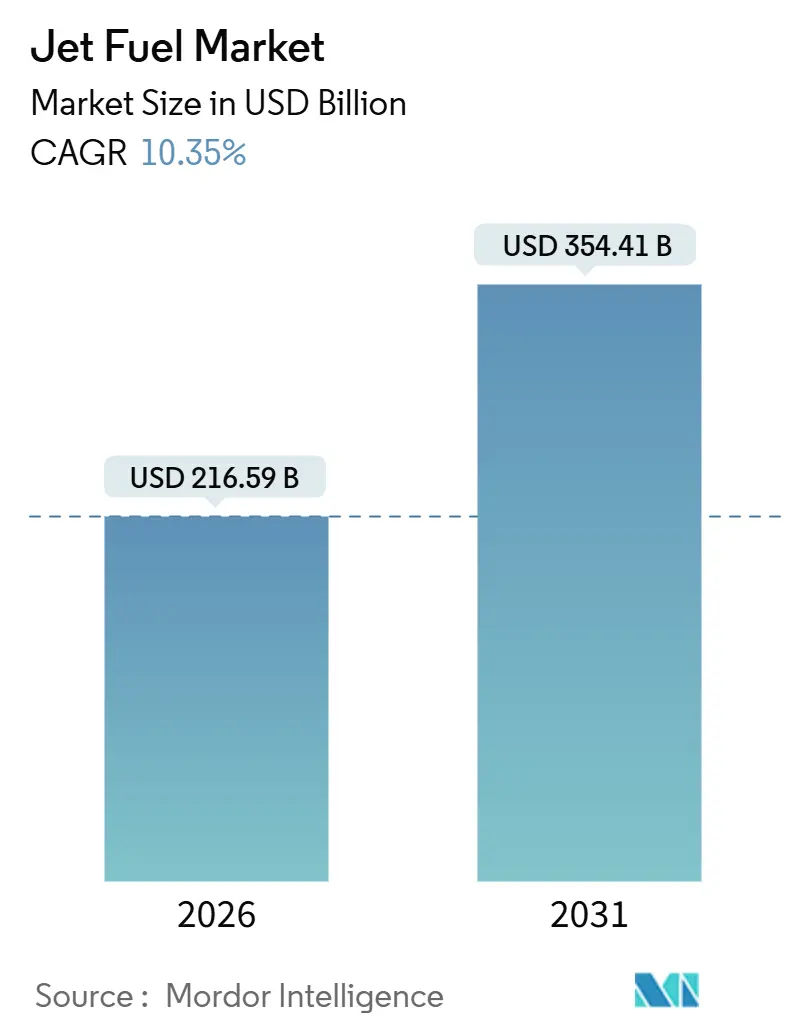
| Market Size (2026) | USD 216.59 Billion |
| Market Size (2031) | USD 354.41 Billion |
| Growth Rate (2026 - 2031) | 10.35% CAGR |
| Fastest Growing Market | Asia Pacific |
| Largest Market | Asia Pacific |
| Market Concentration | Low |
Major Players *Disclaimer: Major Players sorted in no particular order Image © Mordor Intelligence. Reuse requires attribution under CC BY 4.0. | |
Jet Fuel Market Analysis by Mordor Intelligence
The Jet Fuel Market size is estimated at USD 216.59 billion in 2026, and is expected to reach USD 354.41 billion by 2031, at a CAGR of 10.35% during the forecast period (2026-2031).
Accelerating seat-capacity recovery in Asia-Pacific, sustained wide-body freighter deliveries on trans-Pacific lanes, and regulatory mandates that blend sustainable aviation fuel (SAF) into conventional kerosene collectively underpin this expansion of the jet fuel market. Record-high passenger load factors in January 2025 pushed airlines to up-gauge fleets rather than cap traffic, lifting per-flight fuel uplift even as next-generation aircraft promise lower burn per seat. Concurrently, the European Union’s ReFuelEU Aviation rule compels carriers to use SAF blends that possess slightly lower energy density, so total liters demanded rise despite efficiency gains. Integrated majors that control refineries, pipelines, and airport hydrant rights earn margin resilience as airlines seek one-stop contracts covering both SAF and Jet A-1, while specialist producers such as Neste and LanzaJet capture premiums in the nascent SAF niche.
Key Report Takeaways
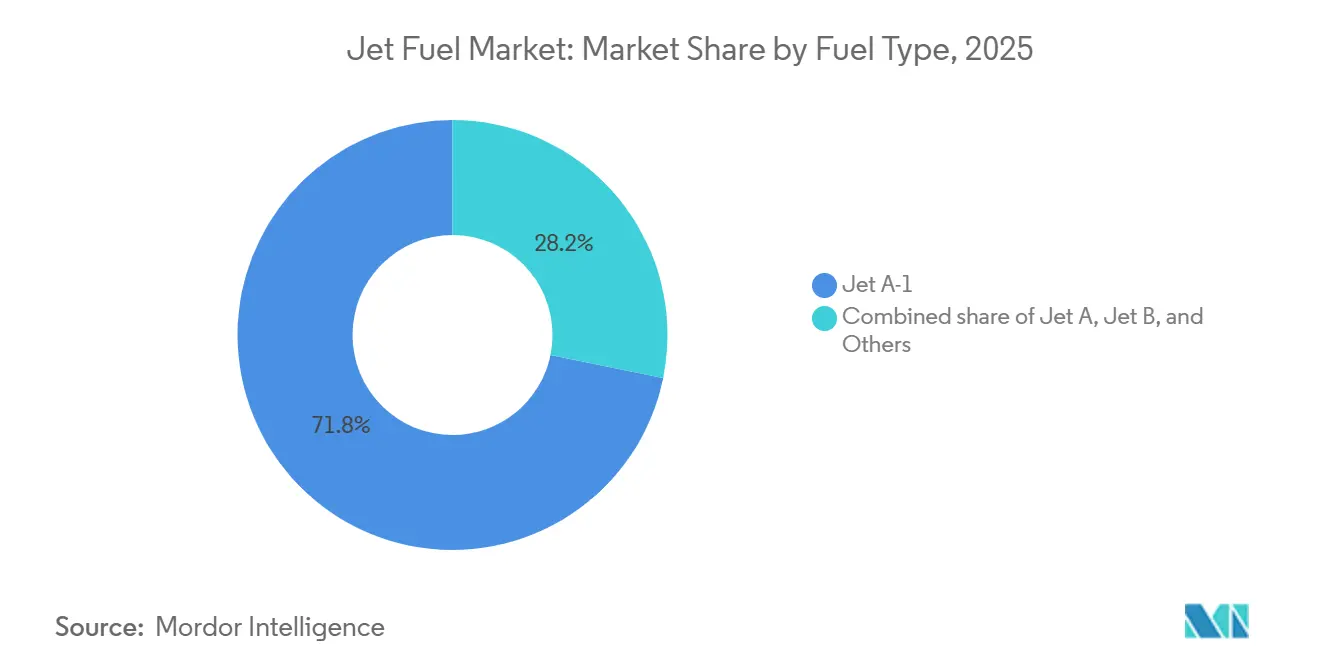
- By fuel type, Jet A-1 held 71.8% of the jet fuel market share in 2025; the “Others” category, led by SAF, is forecast to expand at a 17.4% CAGR through 2031.
- By application, commercial aviation commanded 78.3% of the jet fuel market size in 2025 and is advancing at an 11.1% CAGR to 2031.
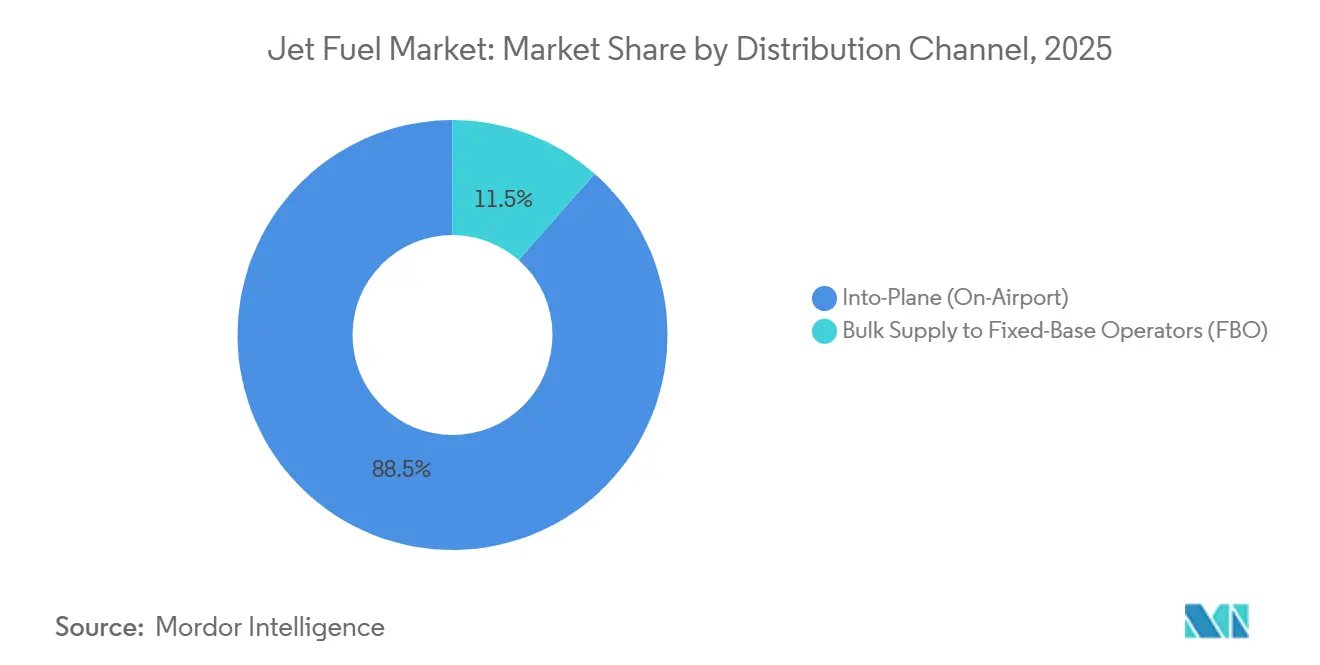
- By distribution channel, into-plane fueling captured 88.5% of the jet fuel market share in 2025, while bulk supply to FBOs posts a lower 8.9% CAGR through 2031.
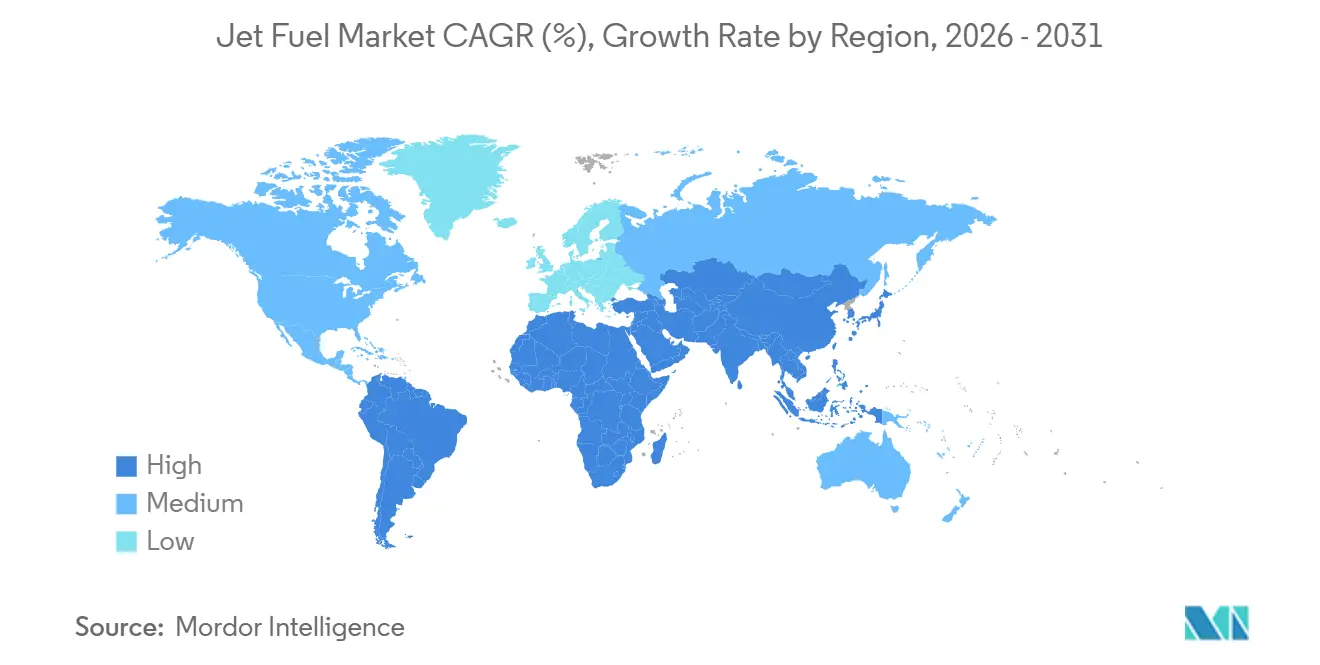
- By geography, Asia-Pacific held 36.9% of the global jet fuel market share in 2025 and is forecast to grow at an 11.7% CAGR during 2026-2031.
Note: Market size and forecast figures in this report are generated using Mordor Intelligence’s proprietary estimation framework, updated with the latest available data and insights as of January 2026.
Global Jet Fuel Market Trends and Insights
Drivers Impact Analysis
| Driver | % Impact on CAGR Forecast | Geographic Relevance | Impact Timeline |
|---|---|---|---|
| Post-COVID load-factor rebound lifting Asia Jet A demand | +2.1% | Asia-Pacific core, spillover to Middle East hubs | Short term (≤ 2 years) |
| Expansion of low-cost carriers across Africa & ASEAN | +1.8% | ASEAN, Sub-Saharan Africa, India | Medium term (2–4 years) |
| Surge in wide-body freighter orders on trans-Pacific routes | +1.3% | North America, Asia-Pacific (China, Japan, South Korea) | Medium term (2–4 years) |
| Mega-hub capacity builds in Middle East fuel farm investments | +1.0% | Middle East (UAE, Qatar, Saudi Arabia), connecting traffic to Asia & Europe | Long term (≥ 4 years) |
| Large-scale U.S. & NATO air exercises boosting JP-8 offtake | +0.7% | North America, Europe (NATO member states) | Short term (≤ 2 years) |
| EU 2% SAF blend mandate raising pool volumes via density loss | +0.9% | Europe (EU-27), spillover to UK & Switzerland | Medium term (2–4 years) |
| Source: Mordor Intelligence | |||
Post-COVID Load-Factor Rebound Lifting Asia Jet A Demand
Asia-Pacific passenger load factors averaged 82.1% in January 2025, a level that obligated carriers to increase flight frequency and deploy larger twin-aisle aircraft, boosting jet fuel market demand.[1]International Air Transport Association, “Air Passenger Market Analysis,” iata.org China’s domestic network recovered to 95% of 2019 capacity by mid-2025, yet international long-haul frequencies stayed 15–20% below pre-pandemic norms, creating latent demand that airlines expect to unlock once visa processing fully normalizes in 2026.[2]Airports Council International, “World Airport Traffic Report,” aci.aero India’s twelve-month passenger growth of 14.2% to March 2025, buoyed by IndiGo’s order for 500 Airbus A320neo-family jets, cements South Asia as a structural growth engine for the jet fuel market. ASEAN low-cost carriers added 87 aircraft in 2024 with high-density layouts that intensify per-turn fuel uplift at primary hubs. Regional passenger traffic is now projected at a 6.3% CAGR to 2028, surpassing the global average and ensuring a double-digit rise in aviation kerosene consumption across India, Bangladesh, and Sri Lanka.
Expansion of Low-Cost Carriers Across Africa & ASEAN
Budget operators in Sub-Saharan Africa and Southeast Asia replicate Southwest Airlines’ single-type, point-to-point playbook but contend with nascent fuel infrastructure. Ethiopian Airlines’ low-cost arm deployed four Boeing 737-800s in 2024 to secondary East-African airports lacking robust hydrant systems, forcing trucked fuel sets that inflate costs by 10–15%. VietJet’s launch of 12 cross-border routes in 2024 under ASEAN open-skies drives episodic fuel shortages, where only one into-plane supplier operates. Boeing forecasts Southeast Asia will require 4,720 new aircraft by 2043, underpinning sustained growth for the jet fuel market. However, in Myanmar, Laos, and Cambodia, limited storage forces carriers to tanker fuel from coastal refineries, compressing the low-cost model’s margin buffer.
Surge in Wide-Body Freighter Orders on Trans-Pacific Routes
Boeing handed over 70 production freighters in 2024, and demand for the 777-8F and Airbus A350F endures as e-commerce reshapes global logistics. FedEx and UPS fleets already exceed 220 dedicated freighters each, and new twin-engine designs burn 15–20% less per tonne-kilometer yet require larger single-sector uplifts owing to extended range. SF Airlines and Cargolux filled order books for 34 Boeing 777-8Fs capable of nonstop Shanghai–Los Angeles lanes that consume up to 100 t of Jet A-1 per trip. IATA’s January 2025 data showed cargo-tonne-kilometers 8.3% higher year on year, with 65% of global freight originating or terminating in Asia-Pacific and North America. Cargo hubs at Anchorage, Memphis, Louisville, and Hong Kong thus lock in durable volume for the jet fuel market.
Mega-Hub Capacity Builds in Middle East Fuel Farm Investments
Dubai International processed 44.9 million travelers in H1 2024 as Emirates’ 260 wide-body fleet uplifted more than 2 million tons of fuel at the airport, ranking it the world’s single largest customer. Qatar Jet Fuel Company added 50 million L of underground storage at Hamad International, enabling simultaneous fueling of 12 Airbus A350-1000s without pressure drops. Saudi Aramco and Saudia invested USD 150 million in a SAF blending terminal targeting 5% blends by 2028, positioning Jeddah as a re-export node to African and South Asian carriers. These expansions safeguard hydrant pressure and inventory, supporting double-digit throughput growth that benefits the jet fuel market.
Restraints Impact Analysis
| Restraint | (~) % Impact on CAGR Forecast | Geographic Relevance | Impact Timeline |
|---|---|---|---|
| EU-ETS Phase IV ticket surcharges curtail leisure flying | -1.4% | Europe (EU-27, UK, Switzerland, Norway) | Short term (≤ 2 years) |
| Fleet renewal toward fuel-efficient aircraft cuts per-flight burn | -1.9% | Global, with fastest adoption in North America, Europe, Asia-Pacific | Medium term (2–4 years) |
| High SAF premium squeezes airline hedging & fuel uplift | -0.8% | Europe, North America (California, Washington), emerging in Asia-Pacific | Medium term (2–4 years) |
| Aromatics-rich crude shortage lowering USGC jet yield | -0.6% | North America (U.S. Gulf Coast refining complex) | Short term (≤ 2 years) |
| Source: Mordor Intelligence | |||
EU-ETS Phase IV Ticket Surcharges Curtail Leisure Flying
Phase IV of the EU Emissions Trading System raised carbon prices above EUR 80 t and rescinded free allowances for intra-EU flights, elevating per-sector costs by EUR 700–880 on a London–Barcelona A320neo leg.[3]European Commission, “EU ETS Phase IV Guidelines,” ec.europa.eu Airlines such as Ryanair and easyJet added EUR 5–12 surcharges, and easyJet reported a 4.3% fall in leisure bookings under 1,000 km in Q3 2024. IATA expects a 2–3% annual drop in intra-European passenger-kilometers through 2027, dampening jet fuel market volumes on price-sensitive routes.
Fleet Renewal Toward Fuel-Efficient Aircraft Cuts Per-Flight Burn
The Airbus A320neo saves 20% fuel per seat versus the A320ceo, and Boeing 737 MAX cuts 14–20% against the 737NG, decoupling traffic growth from consumption.[4]Airbus, “Aircraft Characteristics A320 Family,” airbus.com United Airlines’ deployment of 50 MAX 9 jets in 2024 lowered domestic fuel burn by 3.2% despite a 5% seat-mile rise. Fleet retirement cycles imply 40% of today’s 28,000 aircraft will be replaced by 2035, hindering the jet fuel market.
Segment Analysis
By Fuel Type: SAF Mandates Accelerate “Others” Growth
Jet A-1 retained 71.8% of 2025 volume owing to global standardization outside North America, while Jet A dominates U.S. domestic uplift because its freeze-point, relaxed to −40 °C, suits shorter leg operations. The jet fuel market size for “Others,” comprising TS-1, Jet B, and SAF, is projected to climb at a 17.4% CAGR, the fastest among fuel classes, propelled by binding SAF targets in the EU, UK, and California. Neste’s 1.3 million t Rotterdam expansion and LanzaJet’s 10 million gal Freedom Pines line typify the capital intensity needed to supply mandated volumes.
Market-share growth within the jet fuel industry remains constrained by feedstock scarcity; used cooking oil, tallow, and municipal waste streams cannot yet scale to the multi-million-tonne thresholds regulators envision. Jet B is relegated to extreme-cold markets and faces accelerated retirement as Canadian bush operators modernize fleets. Russia’s TS-1 continues in domestic service, but sanctions freeze technology upgrades, limiting refinery flexibility. CORSIA’s emissions-credit mechanism, nevertheless, should pull an extra 5–8 million t of SAF into circulation by 2030, ensuring the “Others” aggregate captures disproportionate jet fuel market share gains.
Note: Segment shares of all individual segments available upon report purchase
By Application: Commercial Dominance versus Defense Resilience
Commercial airlines accounted for 78.3% of 2025 consumption and will sustain an 11.1% CAGR as Asia-Pacific low-cost carriers and Middle East connectors upgauge capacity. Record 82.1% load factors suggest airlines must add frequencies or larger aircraft, both scenarios that lift jet fuel market demand. Defense aviation, representing about 15% of demand, grows at a steadier 7–8% clip; the U.S. Air Force alone took 85 million bbl in FY 2024 as F-35A adoption widens.
General aviation’s 7% slice of the jet fuel market benefits from fractional ownership demand growth of 12–15% flight hours in 2024, yet its disproportionate emissions per passenger attract regulatory scrutiny. The FAA reported increasing adoption of diesel flight-training aircraft that burn Jet A, incrementally lifting segment demand 2–3% annually. Military logistics contracts, often indexed to Brent plus differential, provide a consumption floor when commercial volumes soften, underscoring the application mix’s balancing effect on the jet fuel industry.
By Distribution Channel: Hydrant Infrastructure Consolidates Into-Plane Share
Into-plane fueling supplied 88.5% of world volume in 2025 and is forecast to expand at 11.0%, mirroring hub-airport traffic recovery and airlines’ preference for hydrant-based rapid turns. Dubai, Changi, and Heathrow each dispense 5–8 million t annually through dedicated pipelines, eliminating truck contamination risk and supporting large-scale jet fuel market contracts. Emirates’ USD 6 billion annual Dubai contract showcases oligopolistic supply at mega-hubs, where Shell, BP, and ExxonMobil run joint ventures that bundle SAF options.
Bulk supply to fixed-base operators holds 11.5% share, concentrated at secondary fields where traffic cannot justify hydrants. Signature Flight Support and Atlantic Aviation manage more than 200 U.S. sites but charge 5–10 c/gal mark-ups as storage turns slower. Regional jets’ migration from 50-seat ERJ-145s to 76-seat E175s shifted 15–20% of former FBO volumes into hub hydrant networks, reinforcing in-plane dominance within the jet fuel market.
Note: Segment shares of all individual segments available upon report purchase
Geography Analysis
Asia-Pacific commanded 36.9% of 2025 demand and is on track for an 11.7% CAGR through 2031, the fastest worldwide. China’s domestic recovery to 95% of 2019 passenger levels and India’s 14.2% annual traffic surge, propelled by IndiGo’s record 500-aircraft order, anchor regional momentum. ASEAN open-skies lets VietJet and AirAsia add 19 new cross-border sectors in 2024, concentrating fuel uplift where single suppliers control hydrants, boosting regional jet fuel market margins. Japan’s 10% SAF blend goal by 2030 spurs Idemitsu Kosan and ENEOS waste-to-jet investments, positioning the country for possible exports to South Korea and Taiwan.
North America held a roughly 28% share in 2025 and grew at 9.2% through 2031. U.S. consumption of 1.7–1.8 million bpd benefits from trans-Atlantic rebound; United and Delta each logged 18–22% year-on-year international seat-kilometer growth in Q4 2024. Canada’s hub-centric model at Toronto Pearson and Vancouver drives uplift, while Air Canada’s order for 18 Boeing 787-10s lowers per-trip burn 20–25% compared with retiring 767s. Mexico’s 10–12% annual rise ties to nearshoring passenger flows, although limited Pemex refinery investment forces import reliance that tightens jet fuel market supply.
Europe contributed 22% of global demand in 2025, expanding at a slower 8.5% CAGR. EU-ETS surcharges and short-haul rail substitution temper growth, yet density-driven uplift from SAF mandates offsets some volume loss. Heathrow, Charles de Gaulle, and Frankfurt combined moved 12 million t in 2024 through integrated pipelines operated by Shell, BP, TotalEnergies, and ExxonMobil. Ryanair and easyJet carbon add-ons trimmed leisure bookings 4.3% on sub-1,000 km routes, and Russia remains capped at 2019 levels due to sanctions.
The Middle East and Africa share 14% of the demand. Dubai International’s 44.9 million H1 2024 passengers and Emirates’ 2 million t annual uplift signify enduring hub strength. Qatar Jet Fuel’s 50 million L storage extension secures simultaneous A350 fueling, while Saudi Aramco’s 5% SAF target by 2028 aims at re-export opportunities. Ethiopian Airlines’ route launches into Lusaka and Dar es Salaam highlight Sub-Saharan infrastructure gaps where trucked supply adds 10–15% to costs, yet 9.5% CAGR through 2031 keeps the jet fuel market attractive. South America’s 6% share concentrates at São Paulo Guarulhos and Rio Galeão, fed by Petrobras Distribuidora pipelines but constrained by slower fleet renewal.
Competitive Landscape
The jet fuel market is moderately concentrated: Shell, BP, ExxonMobil, Chevron, and TotalEnergies collectively control near 40% of the into-plane volume at the 50 busiest airports, yet none exceeds 12% global share. Capital-intensive hydrant rights and 5–10-year airline contracts erect barriers, but integrated majors face narrowing margin spreads when crude swings compress refining cracks. Vertical integration lets these firms package fixed-differential pricing, carbon offsets, and SAF blending in single invoices that airlines favor for cost transparency.
Secondary suppliers like Vitol Aviation and World Fuel Services leverage trading agility but lack upstream assets, limiting their ability to hedge price volatility embedded in SAF premiums. Neste’s Rotterdam-scale and LanzaJet’s modular alcohol-to-jet licensing prove nimble specialists can monetize green niches, but the majors approach cautiously. National oil companies, Sinopec, PetroChina, and Indian Oil, retrofit hydrocrackers for 5–10% renewable co-processing, surrendering yield but avoiding greenfield outlay.
Technology plays accelerate: Shell’s blockchain-based FuelAssure tracking won a 10-year, USD 12 billion exclusive at Singapore Changi by certifying end-to-end fuel provenance, a selling point for airlines under tightening ESG audits. Divergent national specifications, Russia’s TS-1 sulfur cap, Japan’s aromatic limits, prevent full commoditization and sustain regional pricing differentials that agile traders exploit to arbitrage the jet fuel market.
Jet Fuel Industry Leaders
Shell PLC
Exxon Mobil Corporation
BP PLC
Chevron Corporation
TotalEnergies SE
- *Disclaimer: Major Players sorted in no particular order
Recent Industry Developments
- November 2025: In a major step towards sustainability, DHL Express has inked a pivotal agreement with Phillips 66, a prominent U.S.-based integrated downstream energy provider and producer of Sustainable Aviation Fuel (SAF).
- July 2025: Saneg, a private company that bought the Fergana Oil Refinery in 2022 for USD 100 million, announced the refinery's new venture into producing Jet A1 aviation fuel. Utilizing a synthetic kerosene component sourced from the Uzbekistan GTL plant, the refinery has commenced the serial production of Jet A1 fuel.
- June 2025: Twelve, a pioneering carbon transformation firm, unveiled its "Fuel for the Long Haul™" brand campaign. This initiative highlights an industry-first breakthrough technology and marks the debut market offering of E-Jet Sustainable Aviation Fuel (SAF).
- January 2025: Jet Aviation has inked a deal with World Fuel Services to deliver Sustainable Aviation Fuel (SAF) at its Basel site in Switzerland. With this move, Basel becomes the 12th Jet Aviation facility globally to provide on-site SAF.
Research Methodology Framework and Report Scope
Market Definitions and Key Coverage
According to Mordor Intelligence, the jet fuel market captures every sale of kerosene-grade turbine fuel that meets Jet A, Jet A-1, Jet B, or certified sustainable aviation fuel (SAF) specifications, delivered into commercial, defense, and general-aviation aircraft worldwide. Our value chain begins at the refinery gate, traces bulk transport, storage, and into-plane delivery, and finishes at the price paid by the aircraft operator.
Scope exclusions include piston-engine aviation gasoline, marine or stationary turbine fuels, carbon-credit instruments, and onboard fuel-management hardware, which sit outside this study.
Segmentation Overview
- By Fuel Type
- Jet A
- Jet A-1
- Jet B
- Others [TS-1, Sustainable Aviation Fuel (SAF)]
- By Application
- Commercial Aviation
- Defense Aviation
- General Aviation
- By Distribution Channel
- Into-Plane (On-Airport)
- Bulk Supply to Fixed-Base Operators (FBO)
- By Geography
- North America
- United States
- Canada
- Mexico
- Europe
- United Kingdom
- Germany
- France
- Spain
- Nordic Countries
- Russia
- Rest of Europe
- Asia-Pacific
- China
- India
- Japan
- South Korea
- ASEAN Countries
- Australia
- Rest of Asia-Pacific
- South America
- Brazil
- Argentina
- Colombia
- Rest of South America
- Middle East and Africa
- United Arab Emirates
- Saudi Arabia
- Qatar
- South Africa
- Rest of Middle East and Africa
- North America
Detailed Research Methodology and Data Validation
Desk Research
We start by harvesting factual anchors from tier-1 open sources such as IATA passenger-kilometer data, ICAO traffic forecasts, U.S. EIA refinery yield tables, Eurocontrol flight movements, UN Comtrade jet-fuel trade codes, and regional civil-aviation authorities. Company 10-Ks, airport-authority statistics, investor decks, and analyst call transcripts extend the narrative, while D&B Hoovers and Dow Jones Factiva (our paid databases) confirm operator financials and deal flow. The sources named illustrate the breadth; numerous other documents are reviewed to cross-check figures and resolve discrepancies.
Primary Research
Mordor analysts conduct structured interviews with airline fuel buyers, major refiners, into-plane service providers, and aviation regulators across North America, Europe, Asia-Pacific, and the Middle East. These conversations verify secondary findings, plug information gaps, and stress-test price and volume assumptions before final triangulation.
Market-Sizing & Forecasting
We employ a top-down and bottom-up blend. The model reconstructs global demand from flight hours, average fuel burn per seat-kilometer, and regional load factors, then values it using quarterly average spot and term contract prices. Results are corroborated through selective bottom-up roll-ups of refinery throughput, airport uplift volumes, and sampled average selling prices. Key variables include crude-to-jet crack spreads, fleet renewal rates, SAF blending mandates, GDP-linked air-travel elasticity, and regional capacity-utilization trends. Forecasts rely on multivariate regression anchored to GDP and passenger-traffic outlooks, supplemented by scenario analysis that tests high-oil-price and slower-traffic cases. Gaps for smaller airports are bridged with validated penetration ratios from primary interviews.
Data Validation & Update Cycle
Automated variance checks flag anomalies, which are then reviewed by a second analyst before sign-off. Our reports refresh annually; interim updates trigger when events such as crude-price shocks or major policy shifts materially alter baseline assumptions. A final analyst pass ensures clients receive the most current view.
Why Our Jet Fuel Baseline Commands Reliability
Published estimates often diverge. Differences usually stem from market-boundary choices, valuation points, and refresh cadence. Some publishers merge avgas or broad SAF volumes with jet fuel, others price only refinery-gate sales, and a few rely on static traffic multipliers that age quickly. Mordor's disciplined scope, landed-price valuation, and annual refresh keep our baseline aligned with observable uplift volumes.
Benchmark comparison
| Market Size | Anonymized source | Primary gap driver |
|---|---|---|
| 195.21 (2025E) | Mordor Intelligence | - |
| USD 200.21 B (2024) | Global Consultancy A | Combines avgas and SAF with jet fuel; applies macro consumption ratios |
| USD 204.34 B (2024) | Industry Journal B | Factory-gate revenue model; omits airport-handling margins |
| USD 215.00 B (2024) | Regional Consultancy C | Reports refinery sales only; excludes distribution mark-ups |
The comparison shows that higher figures typically arise when other publishers broaden scope or exclude downstream costs. By grounding calculations in observable uplift volumes, transparent variables, and a documented refresh cycle, Mordor Intelligence provides decision-makers with a balanced, repeatable baseline they can trust.
Key Questions Answered in the Report
How large is the global jet fuel market in 2026 and what growth is expected by 2031?
The jet fuel market size reached USD 216.59 billion in 2026 and is forecast to expand to USD 354.41 billion by 2031 on a 10.35% CAGR.
Which region leads jet fuel demand growth through 2031?
Asia-Pacific leads, holding 36.9% share in 2025 and expanding at an 11.7% CAGR thanks to traffic rebounds in China, India, and ASEAN.
What impact will SAF mandates have on future fuel volumes?
EU, UK, and California SAF blend rules raise total liters demanded because lower energy density means airlines must uplift extra fuel for the same range.
How are fleet renewals affecting jet fuel consumption?
Next-gen aircraft such as the Airbus A320neo and Boeing 737 MAX cut per-seat burn 14–20%, offsetting part of traffic-driven demand growth.
Who are the major suppliers in the jet fuel market?
Shell, BP, ExxonMobil, Chevron, and TotalEnergies collectively control about 40% of into-plane volume at the world’s busiest airports.


