
Market Overview
| Study Period | 2021 - 2031 |
|---|---|
| Forecast Data Period | 2026 - 2031 |
| Base Year Market Size (2025) | 6.95 gigawatt |
| Market Volume (2026) | 8.96 gigawatt |
| Market Volume (2031) | 31.83 gigawatt |
| Growth Rate (2026 - 2031) | 28.87 % |
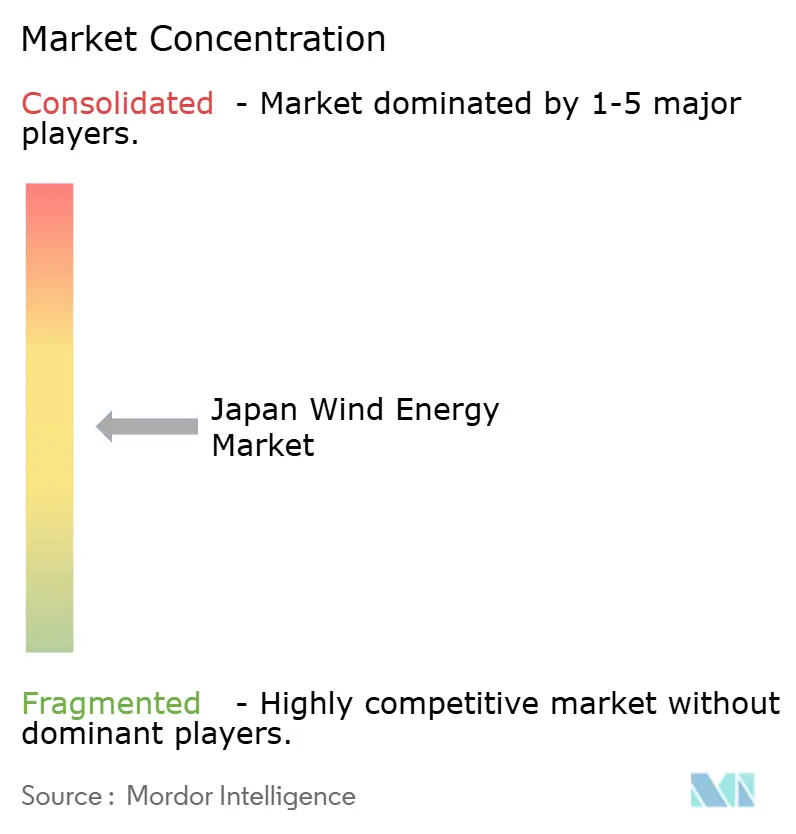
| Market Concentration | Medium |
Major Players *Disclaimer: Major Players sorted in no particular order Image © Mordor Intelligence. Reuse requires attribution under CC BY 4.0. | |
Japan Wind Energy Market Analysis by Mordor Intelligence
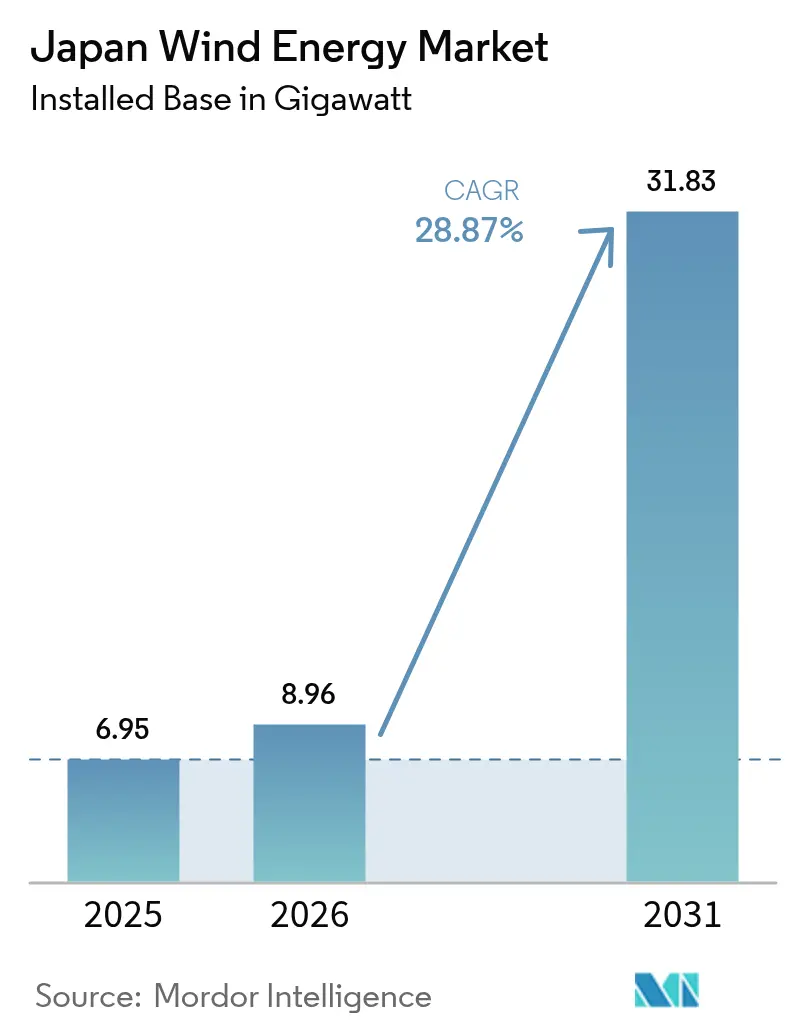
Japan Wind Energy Market size in 2026 is estimated at 8.96 gigawatt, growing from 2025 value of 6.95 gigawatt with 2031 projections showing 31.83 gigawatt, growing at 28.87% CAGR over 2026-2031.
Growth rests on Japan’s policy commitment to curb fossil-fuel dependence and achieve carbon neutrality by 2050, supported by the 7th Strategic Energy Plan that targets 40-50% renewables in the national power mix by 2040. Offshore wind auctions, sovereign transition bonds, and corporate power-purchase agreements (PPAs) channel new capital, while domestic component alliances reduce import risks and shorten project timelines. Floating-platform breakthroughs enlarge the area available for development by a factor of ten, unlocking deeper waters for future capacity. At the same time, grid congestion in wind-rich northern regions and stakeholder opposition in fishing communities temper short-term installation rates.
Key Report Takeaways
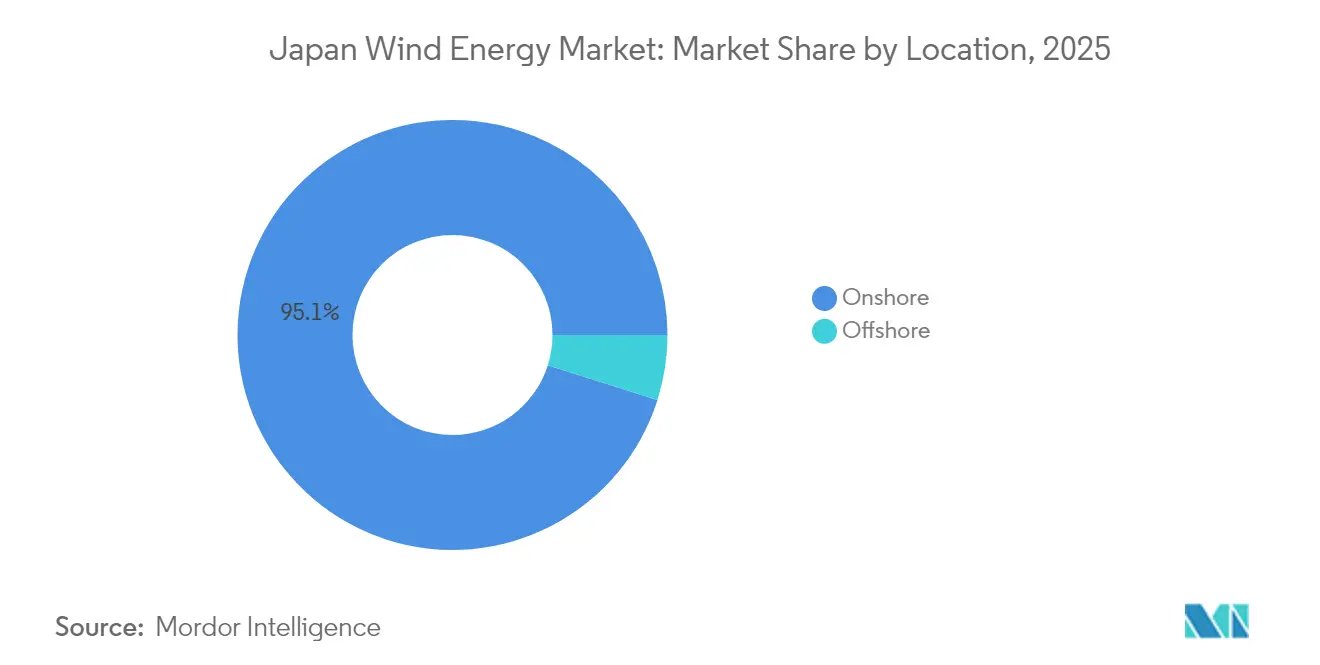
- Onshore projects captured 95.12% of Japan's wind energy market share in 2025, while offshore installations are forecast to grow at a 67.1% CAGR through 2031, signaling an impending realignment in the location mix.
- The 3-6 MW turbine segment held 47.65% share of Japan's wind energy market size in 2025; turbines above 6 MW are set to expand at a 32.93% CAGR on the back of 15 MW platforms specified for Round 3 offshore awards.
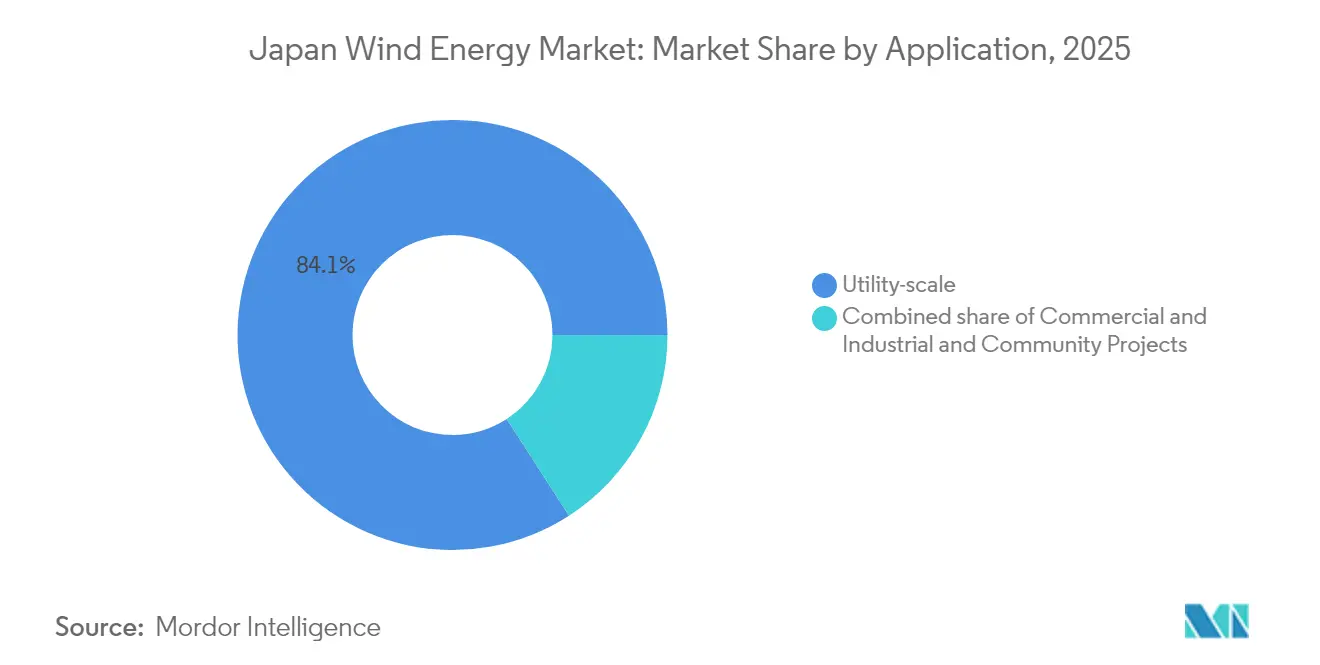
- Utility-scale applications accounted for 84.12% of the Japanese wind energy market in 2025, whereas community projects are poised to advance at a 34.8% CAGR to 2031 as municipal partnerships leverage streamlined permitting.
Note: Market size and forecast figures in this report are generated using Mordor Intelligence’s proprietary estimation framework, updated with the latest available data and insights as of 2026.
Japan Wind Energy Market Trends and Insights
Drivers Impact Analysis*
| Driver | (~) % Impact on CAGR Forecast | Geographic Relevance | Impact Timeline |
|---|---|---|---|
| Surge in offshore-wind auction rounds | +12.50% | National, concentrated in Tohoku, Hokkaido, Kyushu coastal zones | Medium term (2-4 years) |
| Declining onshore LCOE and turbine upgrades | +4.20% | National, with highest adoption in Hokkaido, Tohoku | Short term (≤ 2 years) |
| Capital inflows from green-bond issuances | +3.80% | National, with institutional demand from Tokyo financial centers | Medium term (2-4 years) |
| Corporate PPAs from data-centre & semiconductor clusters | +2.90% | Regional, concentrated in Kumamoto, Hokkaido, Tohoku | Short term (≤ 2 years) |
| Opening of Japan's EEZ for floating wind | +5.10% | National, focused on Sea of Japan and Pacific deep-water tracts | Long term (≥ 4 years) |
| National hydrogen-ammonia strategy boosting wind demand | +1.80% | National, with pilot hubs in Aichi (Hekinan), Fukushima | Long term (≥ 4 years) |
| Source: Mordor Intelligence | |||
Surge in Offshore-Wind Auction Rounds
Round 3 auctions in December 2024 awarded 1 GW across Aomori South and Yuza at JPY 3/kWh with mandated start-up by June 2030. Revised auction rules in January 2025 introduced price-indexation and early-operation incentives to offset cost-inflation risk.[1]These changes signal regulatory agility that preserves competitive pricing while broadening bidder participation. Round 4, slated for 2025, will test whether rule refinements can accelerate capacity awards without compromising local-content requirements. The approach positions auctions as a predictable growth engine for the Japan wind energy market.
Declining Onshore LCOE and Turbine Upgrades
The 147 MW Abukuma wind farm, commissioned in April 2025 with 46 GE Vernova 3.2 MW units, shows how larger turbines cut balance-of-plant costs per megawatt.[2] Domestic switchgear and semiconductor tie-ups between Vestas, Mitsubishi Electric, and Fuji Electric deepen the supply chain and lower import exposure. NEDO-funded floating vertical-axis prototypes extend cost reductions into deep-water environments, supporting broader deployment. Together, these factors lift project internal rates of return and quicken the shift toward larger, more efficient machines, advancing the Japan wind energy market.
Capital Inflows from Green-Bond Issuances
Japan’s JPY 20 trillion sovereign transition-bond program sets a benchmark for climate finance, with the February 2024 tranche of JPY 800 billion attracting strong demand under the Climate Bonds Standard. Lower coupon spreads cascade to corporate issuers, enabling attractive funding for offshore arrays and grid upgrades. Utilities are now layering fifty-year tenors into capital structures, reducing refinancing risk for complex floating-wind assets. Ample liquidity narrows the cost gap versus gas-fired alternatives and expands the Japan wind energy market.
Corporate PPAs from Data-Centre & Semiconductor Clusters
Microsoft’s virtual PPA with Shizen Energy and Equinix’s 30 MW contract with Trina Solar Japan Energy typify surging digital-sector demand for long-term green electricity. Government plans for a 300 MW Hokkaido offshore wind farm aligned to semiconductor output illustrate policy-industry coordination. JERA’s off-site PPA with East Japan Railway demonstrates transferable contract frameworks, reducing transaction costs and driving wider adoption. Corporate appetite for cost-stable wind capacity enlarges offtake certainty, anchoring new build-outs across the Japan wind energy market.
Restraints Impact Analysis*
| Restraint | (~) % Impact on CAGR Forecast | Geographic Relevance | Impact Timeline |
|---|---|---|---|
| Gas-fired capacity additions under the GX roadmap | -2.70% | National, with new CCGT plants in Kanto, Kansai | Medium term (2-4 years) |
| Grid congestion & curtailment risk in Tohoku/Hokkaido | -3.40% | Regional, concentrated in Tohoku, Hokkaido | Short term (≤ 2 years) |
| Typhoon-driven O&M cost inflation | -1.90% | National, with highest impact in Kyushu, Shikoku coastal zones | Short term (≤ 2 years) |
| Fishery & local-stakeholder opposition delaying permits | -2.10% | Regional, affecting Akita, Aomori, Nagasaki offshore zones | Medium term (2-4 years) |
| Source: Mordor Intelligence | |||
Grid Congestion & Curtailment Risk in Tohoku/Hokkaido
Renewable curtailment reached 1.76 TWh in FY 2023, with Kyushu recording a 6.7% rate.[3] Wind-rich Hokkaido and Tohoku lie far from demand hubs, and high-voltage upgrades to Honshu will not finish before 2030. Priority dispatch for nuclear reactors squeezes available capacity in peak-wind seasons. Although Marubeni’s 25 MW/103.7 MWh battery system in Hokkaido offers partial relief, statewide storage needs exceed 2 GW. Persistent congestion threatens revenue stability and delays financing for new entrants in the Japan wind energy market.
Typhoon-Driven O&M Cost Inflation
Japan averages 11 typhoons making landfall annually, stressing turbine blades and subsea cables.[4]Insurance premiums and contingency reserves add 9-12% to total O&M budgets for offshore sites. Developers now specify reinforced leading-edge protections and remote structural-health monitoring, but these upgrades raise upfront costs. While such measures extend asset life, near-term expenditure spikes pressure project economics within the Japan wind energy market.
*Our forecasts treat driver/restraint impacts as directional, not additive. The impact forecasts reflect baseline growth, mix effects, and variable interactions.
Segment Analysis
By Location: Offshore Surge Reshapes Deployment Mix
Offshore capacity is forecast to climb from a negligible base to roughly 12.1 GW by 2031, raising its Japan wind energy market share from 4.88% in 2025 to nearly 39% at the end of the decade. Round 3 awards totaling 1.065 GW cleared at grid-parity prices and specified 15 MW turbines that compress balance-of-system costs by roughly one-fifth. Commercial floating wind receives a legal boost from March 2025 EEZ legislation, which unlocks 150 GW of deep-water potential in the Sea of Japan and Pacific trenches.
Developers still prize onshore repowering opportunities: 1.2 GW of 1990s-era turbines can be swapped for 4-5 MW machines without adding new land footprints, and grid taps are already in place. Yet local moratoriums in Akita and Aomori and environmental reviews on migratory-bird routes hold the onshore pipeline at 800 MW. Offshore projects must contend with a domestic shortage of heavy-lift jack-up vessels; only 3 are available versus 25 in Europe, pushing developers to charter Korean or Chinese assets at premium day rates.

By Turbine Capacity: Gigawatt-Scale Platforms Dominate Offshore
Turbines above 6 MW will command more than 60% of Japan's wind energy market size at the turbine-segment level by 2031 as the country leapfrogs directly to 15 MW machines for sea-based arrays. The 3-6 MW class maintains relevance for repowering and community projects, but new onshore builds are now standardizing on 4-5 MW units that balance Class T resilience with road-transport limits.
Rotor expansion is constrained by typhoon engineering. Reinforced 70-meter blades add USD 50,000-80,000 per MW versus European equivalents. Direct-drive architectures eliminate gearboxes and trim O&M by 10-15%, but nacelles surpass 500 tonnes and need specialized vessels to lift. Repowering older 1.5 MW machines with modern 4.5 MW units can lift site capacity factors from 23% to 35%, offering a short-cycle route to volume gains.
By Application: Community Projects Gain Traction Amid Offtake Diversification
Utility-scale ventures still dominated 84.12% of installed capacity in 2025, yet community projects, defined as 10-50 MW and municipally sponsored, are running a 34.8% CAGR through 2031. Municipal schemes avoid the 3-4-year environmental impact assessments required above 50 MW and can tap local green-bond programs at below-market coupons.
Corporate PPAs underpin this rise. Invenergy’s 60 MW VPPA with Honda fixed a 15-year price that de-risked construction debt by 200 basis points. Semiconductor fabs and hyperscale data centers in Kumamoto and Kanto are evaluating similar contracts to secure baseload renewables. Balancing cost exposure and battery adders remains a hurdle, but regulatory tweaks that extend offshore lease terms from 30 to 40 years could further reduce unit costs and widen the addressable market.
Geography Analysis
Hokkaido and Tohoku supplied 67.45% of 2025 capacity additions thanks to 7-8 m/s average winds and abundant land parcels. Yet the 600 MW HVDC link to Honshu is saturated, producing curtailment rates near 20% in shoulder months. A 6-8 GW replacement line costing at JPY 2.5 trillion (USD 16.7 billion) will not alleviate pressure before the early 2030s. Wind farm valuations now hinge on grid access: sites with existing taps sell at 30-40% premiums to greenfield projects still waiting for interconnection.
Kyushu and Shikoku trail in absolute volume but host promising deep-water zones unlocked by the EEZ reform. The 16.8 MW Goto floating pilot, targeting January 2026 start-up, serves as a baseline for commercial scale-up off Kyushu’s western coast. Typhoon frequency inflates O&M by up to 35% versus Hokkaido, yet higher wholesale prices in Kyushu partially offset cost inflation.
Kanto and Kansai, despite consuming 60% of national electricity, accounted for under 10% of 2025 wind builds due to weak resource profiles and land scarcity. Corporate VPPAs bridge this mismatch: Honda’s PPA for Hokkaido wind energy supplies Kanto manufacturing, proving financial contracts can overcome geographic distance. The JPY 7 trillion grid-upgrade plan spreads spending over 10 years, so curtailment risk in the north will linger into the next decade.
Regulatory Landscape
Japan’s wind build-out is anchored in a national offshore pipeline framework led by the Ministry of Economy, Trade and Industry (METI) and the Ministry of Land, Infrastructure, Transport and Tourism (MLIT), supported by government-set offshore wind targets of 10 GW by 2030 and 30-45 GW by 2040. A major inflection came with the Cabinet decision on March 7, 2025 to amend the Act on Promoting the Utilization of Sea Areas for Marine Renewable Energy Power Generation Facilities, expanding eligibility beyond territorial waters and enabling offshore wind development in Japan’s Exclusive Economic Zone (EEZ). The amended framework took effect on April 1, 2026 and introduces a more centralized approach to marine environmental research for promotion-zone designation, reducing the need for developers to duplicate baseline surveys early in the process.
Alongside sea-area policy, Japan continues to steer investment through market mechanisms such as the Feed-in Premium (FIP) regime and long-term procurement instruments (including the Long-Term Decarbonization Power Auction introduced in FY 2023) to support capital-intensive generation and related grid upgrades. METI has also pursued industrial policy to strengthen localization and delivery capacity, including a July 2025 public-private collaboration framework and Memorandum of Understanding with Vestas for wind power sector cooperation, reinforcing supply-chain and capability development aligned with auction requirements and domestic deployment needs.
Competitive Landscape
International turbine manufacturers, Vestas, Siemens Gamesa, and GE Vernova, lead on technology reliability, while domestic conglomerates such as Mitsubishi Heavy Industries and Hitachi Energy emphasize grid-compatibility services tailored to Japanese standards. Vestas’ 134 MW Inaniwa contract and its supplier MOUs with Mitsubishi Electric and Fuji Electric illustrate how foreign firms localize components to meet procurement guidelines. Siemens Gamesa and J-Power pursue hybrid service agreements bundling blade-repair drones and predictive maintenance, cutting downtime for typhoon damage.
Joint ventures deepen competitive intensity. JERA Nex bp, formed in December 2024, pools 13 GW of global offshore targets with USD 5.8 billion committed through 2030. The entity leverages JERA’s domestic customer base and BP’s North Sea expertise to bid aggressively in Round 4. Parallelly, the Floating Offshore Wind Technology Research Association (FLOWRA) aligns 18 marine-engineering firms to standardize anchors and moorings, reducing procurement prices by an expected 20% by 2028. This collaboration simultaneously incubates proprietary designs, preserving competitive differentiation.
Financial innovations also distinguish players. Itochu and Marubeni structure back-leverage deals combining sovereign transition-bond proceeds with export-credit guarantees, lowering project equity hurdles from 25% to 15%. Smaller developers counter by aggregating feed-in-premium contracts through virtual-power-plant platforms, achieving scale economies in balancing markets. These moves collectively reinforce a moderately fragmented but rapidly professionalizing field inside the Japan wind energy market.
Japan Wind Energy Industry Leaders
-
Japan Renewable Energy Co., Ltd.
-
Marubeni Corporation
-
Eurus Energy Holdings
-
Electric Power Development (J-Power)
-
JERA
- *Disclaimer: Major Players sorted in no particular order
Market Opportunities and Future Outlook
The 2026 shift to a centralized marine environmental assessment model under the amended Renewable Energy Sea Area Utilization Act (effective April 1, 2026) creates a clear path for faster, lower-duplication early-stage development work for offshore projects, particularly for new promotion zones and for developers scaling multiple bids. In March 2026, the government published proposed revisions in the promotion-zone designation guideline and related operational policy under METI, MLIT, and the Ministry of the Environment (MOE), indicating continued rule refinement around zone formation and project readiness. This supports broader participation and more scalable consortium structures.
Commercial and near-commercial milestones in 2026 also provide concrete reference points for scaling both fixed-bottom and floating offshore wind. Japan’s first commercial floating offshore wind project, the 16.8 MW Goto Offshore Wind Farm, began commercial operation on January 5, 2026, establishing an operational reference for floating technology in Japanese waters. Fixed-bottom scale advanced as well with the Kitakyushu Hibikinada Offshore Wind Farm (220 MW) commencing commercial operation on March 2, 2026, while the supply chain continues moving to larger turbine classes through signed installation scope, including DEME securing a contract to install 21 Vestas V236-15 MW turbines at the 315 MW Oga-Katagami-Akita project. These developments support opportunities across port and installation services, marine O&M, and localized component manufacturing aligned to 15 MW-class platforms, alongside greater reliance on corporate offtake and FIP-linked merchant exposure management as offshore capacity expands.
Recent Industry Developments
- June 2026: wpd reported commercial operation of the Higashi Izu Furusato Wind Power Plant in Shizuoka Prefecture (7.48 MW) from June 1, 2026. The project adds incremental onshore capacity in a constrained land and permitting environment, showing continued progress through smaller, site-specific developments alongside utility-scale build-outs.
- March 2026: Electric Power Development (J-Power) announced the start of commercial operations at the Kitakyushu Hibikinada offshore wind farm (220 MW) in Fukuoka, with 88 MW owned by J-Power. The commissioning expands Japan’s operational offshore base and supports local capability in offshore construction and long-term O&M, contributing to a larger pipeline of auction-awarded projects.
- March 2024: Japan Renewable Energy (JRE), Iberdrola, and Tohoku Electric Power were selected by the Japanese government to develop the 375 MW Happo-Noshiro offshore wind project off Akita Prefecture. The award reinforced competitive tendering as the route to scale and shaped subsequent bidder strategies around consortia formation, financing structures, and domestic supply-chain alignment.
Research Methodology Framework and Report Scope
Market Definition and Coverage
For this methodology, the Japan wind energy market is defined as the total installed wind power capacity operating in Japan, measured in gigawatts (GW) across onshore and offshore projects.
Scope exclusions: Off-grid small wind systems and broader power-sector spending that cannot be tied to operating wind capacity are not counted.
Segmentation Overview
- By Location
- Onshore
- Offshore
- By Turbine Capacity
- Up to 3 MW
- 3 to 6 MW
- Above 6 MW
- By Application
- Utility-scale
- Commercial and Industrial
- Community Projects
- By Component (Qualitative Analysis)
- Nacelle/Turbine
- Blade
- Tower
- Generator and Gearbox
- Balance-of-System
Data Sources, Market Sizing, and Validation
Desk Research
To build the basic demand and supply picture, we start from public datasets that track Japan power generation and wind buildouts over time. Common inputs come from sources such as Japan's Ministry of Economy, Trade and Industry (METI) energy statistics, the International Energy Agency (IEA), the International Renewable Energy Agency (IRENA), and the Japan Wind Power Association (JWPA), followed by grid and permitting updates published by relevant Japanese agencies.
We also review company filings, investor presentations, project announcements, and reputable press to map commissioning timelines, typical capacity ranges, and delays (for example, around grid connection or environmental approvals). When needed, company financials, investor materials, and an import export shipment-level database are used in a limited way to sense-check equipment flow and project activity. The desk sources listed here are illustrative only, and many other public and internal references are used to collect data, validate assumptions, and clarify open questions.
Primary Interviews and Surveys
Primary discussions are used to confirm what is actually getting built, and when, since public project lists can lag commissioning. We speak with developers, EPCs, turbine and component ecosystem participants, consultants, and utility-side stakeholders, and we balance feedback across key demand pockets in Japan so assumptions are not overly shaped by a single coastline or one project cluster.
Distribution of primary research fieldwork respondents
| Company type | Respondent position |
|---|---|
| Top tier: 39% | CXOs: 12% |
| Mid tier: 45% | Functional/Unit leaders: 32% |
| Smaller Players: 16% | Managers: 56% |
Market-Sizing & Forecasting
Sizing starts with a top-down capacity build using Japan's installed wind base, yearly additions, and expected retirements, which are reconstructed from commissioning records, grid connection cues, and government targets and auction pipelines. The total is then corroborated with selective bottom-up checks, where sampled project pipelines are rolled up by expected MW size, status, and timing, and then adjusted for likely slippage.
Key model inputs include installed capacity (GW), annual capacity additions and commissioning dates, offshore versus onshore project mix, typical construction lead times, grid interconnection readiness, and policy signals such as auction schedules and long-term renewable targets. Forecasts are shaped through scenario analysis, since permitting pace and grid buildout can shift outcomes even when long-term targets stay the same. When project-level details are incomplete, gap handling is done by applying stage-based probability weights and conservative timing shifts, and then re-checking the resulting totals against observed historical build patterns.
Data Validation & Update Cycle
Outputs are checked against independent signals such as national energy statistics, reported installed capacity totals, and the visible commissioning cadence implied by project trackers and grid updates. Outliers are reviewed, assumptions are reworked when they imply unrealistic step changes, and then the model is re-run before sign-off through a multi-step internal review.
The report is refreshed annually, and interim updates are triggered when material events occur (for example, a policy change, a major auction result, or a large project delay). Before delivery, we do a fresh pass on the newest public releases and interview feedback so clients receive an updated view that matches the latest market movements.
Mordor Intelligence's Japan Wind Energy Market Sizing Compared With Other Published Estimates
It is normal to see different market-size figures for Japan wind energy, because sources may be sizing different things, using different units, and sometimes for different time cutoffs. Even when the topic is the same, the final number can shift based on whether the market is treated as installed capacity, energy consumption, or revenue tied to equipment and services.
Installed capacity series, commissioning evidence from project timelines, and checks against national energy statistics are what keep Mordor Intelligence tied to an operating capacity view of the market, instead of mixing in spending or consumption metrics. When another publisher reports a USD value, the boundary typically expands to include equipment, development, and service revenues, which can move the reported market size even if the underlying GW buildout is similar.
Benchmark comparison
| Source | Market Size | Gaps in Research Methodology |
|---|---|---|
| Mordor Intelligence | USD 6.95 B (2025) | |
| Industry Publisher A | USD 6.00 B (2025) | Uses a revenue-based market definition in USD, which can include project development and supply-chain value that does not map one-to-one to installed GW in the same year. |
| Energy Outlook B | USD 0.09 B (2028) | Reports wind power consumption in energy units and a later-year projection, so the figure reflects usage trends rather than installed capacity levels or buildout timing. |
The table shows that the spread is mostly explained by what is being measured, and by the year and unit chosen. Keeping the model anchored to operating capacity and cross-checking it against commissioning and official statistics makes the result easier to audit and repeat when the market changes.
Key Questions Answered in the Report
How fast is capacity expected to grow in the Japan wind energy market to 2031?
Installed wind capacity is projected to climb from 6.95 GW in 2025 to 31.83 GW by 2031, reflecting a 28.87% CAGR driven mainly by offshore projects.
Which region faces the highest curtailment risk?
Hokkaido experiences curtailment rates near 20% because its 600 MW HVDC link to Honshu is fully constrained during windy months.
What is driving the surge in floating wind interest?
March 2025 EEZ legislation opened deep-water zones, unlocking 150 GW of technical potential and spurring consortium-led R&D to cut floating-foundation costs.
How are corporate PPAs influencing project financing?
Long-term PPAs with data centers and semiconductor fabs provide revenue certainty, enabling community-scale projects to secure debt at spreads 200 basis points below utility benchmarks.
Why did some international developers exit Japan?
Ørsted and Shell cited high typhoon engineering costs, protracted stakeholder negotiations, and escalating grid-connection deposits that eroded projected returns.
What impact will new gas plants have on future wind deployment?
Approximately 4 GW of CCGT capacity entering service by 2028 could suppress wholesale prices during early renewable ramp-up years, trimming projected wind revenue streams.