
Market Overview
| Study Period | 2020 - 2031 |
|---|---|
| Forecast Data Period | 2026 - 2031 |
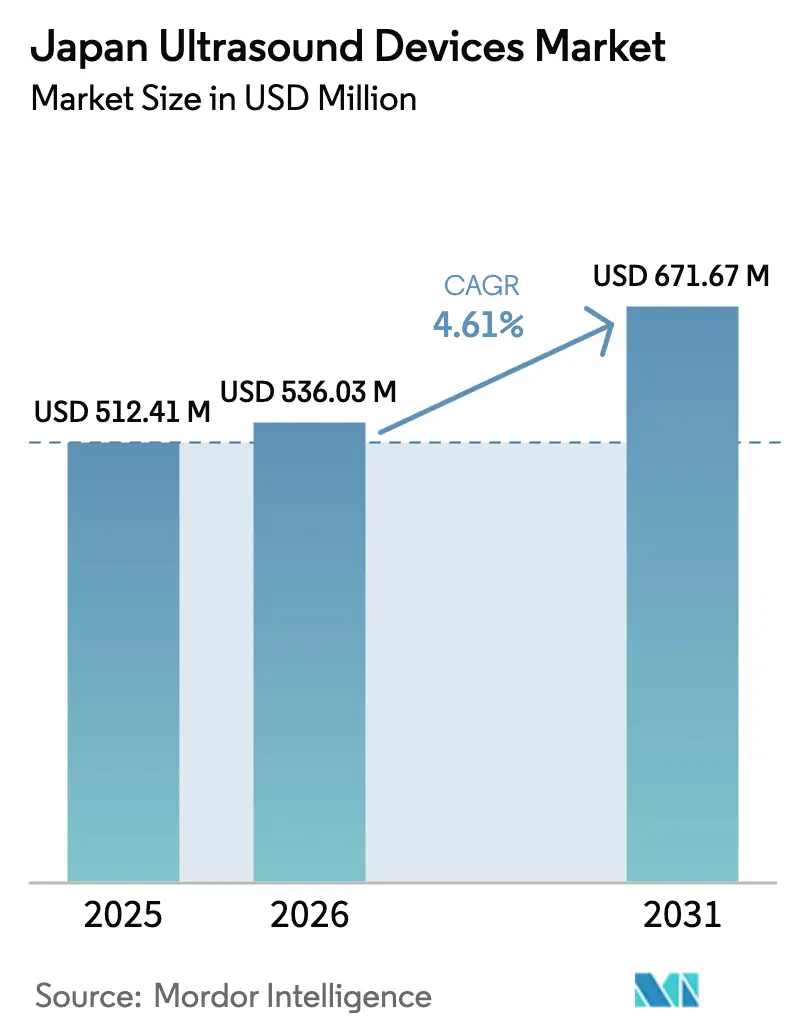
| Base Year Market Size (2025) | USD 512.41 Million |
| Market Size (2026) | USD 536.03 Million |
| Market Size (2031) | USD 671.67 Million |
| Growth Rate (2026 - 2031) | 4.61 % |
| Market Concentration | Medium |
Major Players *Disclaimer: Major Players sorted in no particular order Image © Mordor Intelligence. Reuse requires attribution under CC BY 4.0. | |
Japan Ultrasound Devices Market Analysis by Mordor Intelligence
Japan Ultrasound Devices Market size in 2026 is estimated at USD 536.03 million, growing from 2025 value of USD 512.41 million with 2031 projections showing USD 671.67 million, growing at 4.61% CAGR over 2026-2031.
Demographic aging, chronic-disease prevalence, and systematic replacement of analog scanners underpin steady demand, while AI-enabled 3D/4D platforms and handheld devices create new revenue pools in emergency, primary-care, and home-care settings. Hospitals are renewing infrastructure that is more than four decades old, driving near-term procurement despite capital-budget constraints under bundled DRG payments. At the same time, a limited pool of certified sonographers pushes providers toward automated imaging solutions. Competitive intensity is shaped by alliances such as Canon-Olympus in endoscopic ultrasound, and by the emergence of focused ultrasound for therapeutic oncology, both of which reinforce the strategic importance of domestic R&D investment.
Key Report Takeaways
- By application, radiology held 29.45% of Japan ultrasound market share in 2025, while critical care is advancing at a 6.38% CAGR through 2031.
- By technology, 3D/4D systems commanded 44.12% share of Japan ultrasound market size in 2025; high-intensity focused ultrasound is projected to expand at 5.79% CAGR between 2026-2031.
- By portability, stationary consoles accounted for 67.05% of Japan ultrasound market size in 2025, whereas handheld devices are growing at 7.74% CAGR through 2031.
- By end user, hospitals and academic medical centers represented 56.72% of Japan ultrasound market share in 2025, but private hospitals record the fastest 7.12% CAGR to 2031.
Note: Market size and forecast figures in this report are generated using Mordor Intelligence’s proprietary estimation framework, updated with the latest available data and insights as of 2026.
Japan Ultrasound Devices Market Trends and Insights
Drivers Impact Analysis*
| Driver | (~) % Impact on CAGR Forecast | Geographic Relevance | Impact Timeline |
|---|---|---|---|
| Rising burden of chronic diseases & aging population | +1.2% | Nationwide, strongest in rural prefectures | Long term (≥ 4 years) |
| Accelerated adoption of AI-enabled 3D/4D & handheld ultrasound | +0.9% | Urban hubs, extending to regional hospitals | Medium term (2-4 years) |
| Government-funded point-of-care ultrasound training initiatives | +0.7% | Nationwide, priority for underserved areas | Short term (≤ 2 years) |
| Replacement of aging analog systems | +0.8% | Nationwide, acute in 40-year-old hospitals | Medium term (2-4 years) |
| Breast-density screening programs | +0.6% | Urban screening centers | Medium term (2-4 years) |
| Technological innovation & domestic R&D | +0.5% | Tokyo and Osaka technology clusters | Long term (≥ 4 years) |
| Source: Mordor Intelligence | |||
Rising Burden of Chronic Diseases & Aging Population
Japan’s over-65 demographic now exceeds 30% of the population, creating sustained demand for cardiovascular and musculoskeletal imaging where ultrasound offers non-invasive, radiation-free diagnostics. Elderly patients’ preference for outpatient care bolsters portable scanner uptake, especially for home-health and rehabilitation services.[1] GE Healthcare’s Voluson Performance 18 was positioned to mitigate obstetrician shortages while supporting perinatal networks. Policy goals that extend healthy life expectancy depend on early detection programs reliant on ultrasound, anchoring long-term growth for the Japan ultrasound market.
Accelerated Adoption of AI-Enabled 3D/4D & Handheld Ultrasound
AI-driven software such as RN-Descartes and METIS Eye demonstrates sensitivity rates that outstrip manual interpretation in breast-cancer detection, directly addressing Japan’s sonographer shortfall. Multicenter trials of the KOSMOS handheld platform reported 91.5% clinical applicability, validating bedside use in emergency and rural clinics. The fusion of 3D/4D imaging with real-time AI analytics expands clinical value in cardiology and obstetrics, although PMDA has cleared only two AI SaMD applications to date, creating a window of advantage for early license holders.[2]
Government-Funded Point-of-Care Ultrasound Training Initiatives
The Ministry of Health subsidizes POCUS programs delivered through the Japan Society of Ultrasonics in Medicine, whose certification exams in November 2024 attracted a record cohort of multidisciplinary practitioners. Studies show structured curricula raise operator accuracy and cut scan time, reinforcing adoption in emergency departments, primary-care clinics, and neonatal ICUs. Formation of the National Neonatal POCUS Collaborative expands standardized protocols, ensuring quality outcomes while accelerating device turnover.
Replacement of Aging Analog Systems
More than 1,600 Japanese hospitals operate wards, and analog scanners within these facilities fail to meet updated echocardiography maintenance guidelines. Digital transformation initiatives require DICOM-compliant connectivity and cybersecurity features absent in legacy hardware, pushing replacement cycles forward despite CAPEX limits. COVID-19 heightened infection-control standards, favoring sealed transducers and touchless interfaces available only in newer models, thereby supporting short-to-medium-term demand.
Restraints Impact Analysis*
| Restraint | (~) % Impact on CAGR Forecast | Geographic Relevance | Impact Timeline |
|---|---|---|---|
| Lengthy PMDA approval timelines & post-market costs | -0.6% | Nationwide, all device categories | Long term (≥ 4 years) |
| Constrained hospital CAPEX under bundled DRG payments | -0.8% | Nationwide, heaviest in public sector | Medium term (2-4 years) |
| Shortage of certified sonographers & uneven skills | -0.4% | Rural prefectures and small cities | Medium term (2-4 years) |
| Price competition from low-cost Chinese imports | -0.3% | Nationwide, mid-tier segments | Short term (≤ 2 years) |
| Source: Mordor Intelligence | |||
Lengthy PMDA Approval Timelines & Post-Market Surveillance Costs
Ultrasound vendors allocate 9-16 months to navigate PMDA pathways, prolonging cash-flow breakeven and advantaging incumbents with legacy approvals. Compliance with Ordinance 169 and ISO 13485 mandates exhaustive validation, while ongoing vigilance reports pile additional costs. Only two of 27 AI SaMD filings have been cleared, illustrating systemic hurdles that temper innovation velocity in the Japan ultrasound market.[3]
Constrained Hospital CAPEX Under Bundled DRG Payments
Episode-based reimbursements cap revenue regardless of diagnostic sophistication, restricting equipment budgets particularly in the public segment that commands the majority of scan volumes. Facilities juggling structural renovations and device upgrades often favor mid-range models or defer replacements, lengthening sales cycles for premium consoles. Private providers, less tethered to DRG constraints, post higher scanner-acquisition growth.
*Our forecasts treat driver/restraint impacts as directional, not additive. The impact forecasts reflect baseline growth, mix effects, and variable interactions.
Segment Analysis
By Application: Critical Care Expands Amid Radiology Leadership
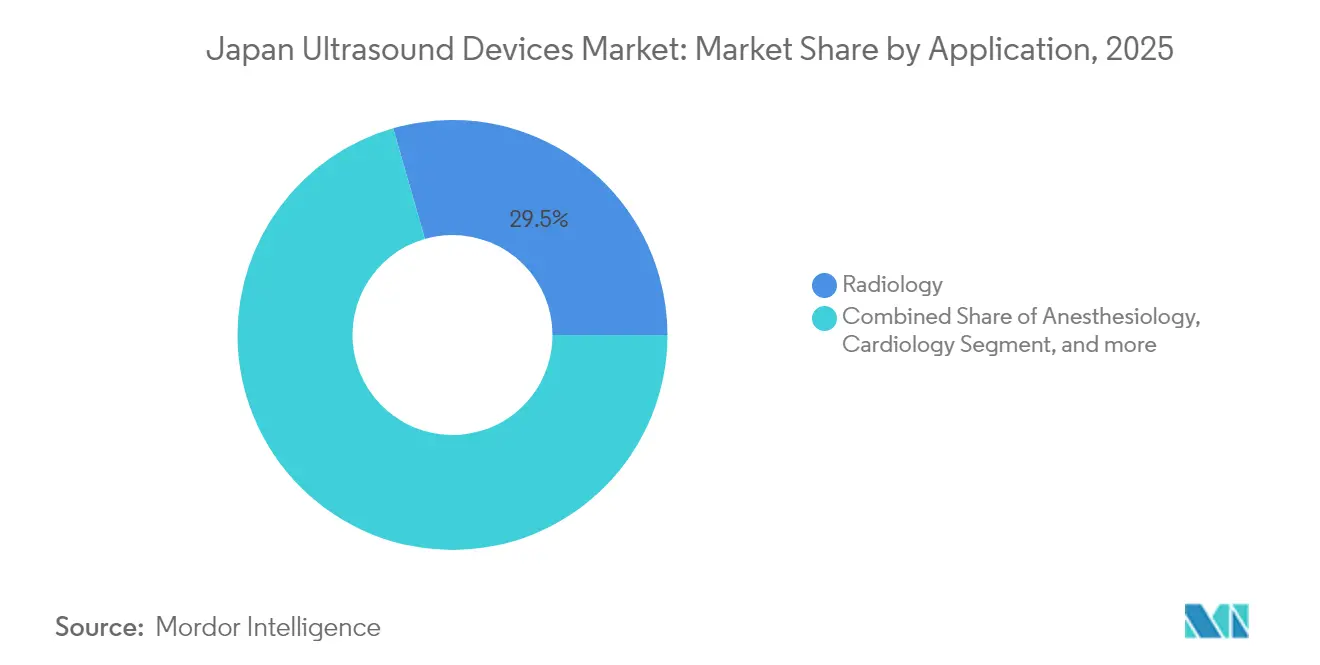
Radiology generated 29.45% of Japan ultrasound market size in 2025 and remains the backbone of imaging services because every hospital relies on general-purpose consoles for abdominal, vascular, and soft-tissue diagnostics. Growth, however, pivots toward critical-care usage where bedside sonography guides fluid resuscitation, detects pneumothorax, and monitors cardiac function in hemodynamically unstable patients. Certification modules by the Japan Society of Ultrasonics in Medicine reinforce proficiency, ensuring uniform quality nationwide.
Critical-care volumes are predicted to rise at 6.38% CAGR to 2031, propelled by intensivist adoption of portable probes and handhelds that connect wirelessly to hospital PACS. Rapid decision-making reduces ICU length of stay, appealing to administrators operating under DRG cost ceilings. As a result, critical care’s share of Japan ultrasound market size is likely to climb beyond its current 11.05% threshold, gradually diluting radiology’s dominance while catalyzing software-as-a-service revenues through AI-based hemodynamic analysis modules.

By Technology: HIFU Innovation Challenges 3D/4D Supremacy
3D/4D imaging occupied 44.12% of Japan ultrasound market share in 2025 thanks to entrenched obstetrics and cardiology workflows. Volumetric datasets improve anomaly detection, a quality metric prized by insurers and clinicians alike. Yet high-intensity focused ultrasound is charting the fastest 5.79% CAGR, propelled by oncology trials evaluating non-invasive ablation for liver, prostate, and pancreatic tumors. Domestic startups translate photonics and robotics know-how into precise beam steering, seeking to commercialize hybrid diagnostic-therapeutic suites.
2D and Doppler modalities continue across routine abdominal scans and vascular studies, especially where hospital budgets remain tight. Even so, vendors embed AI noise suppression and auto-measure algorithms into baseline 2D systems, raising clinical value without inflating price tags. This staircase innovation approach keeps adoption broad while protecting the Japan ultrasound market from abrupt technology obsolescence risk.
By Portability: Handheld Wave Redefines Point-of-Care
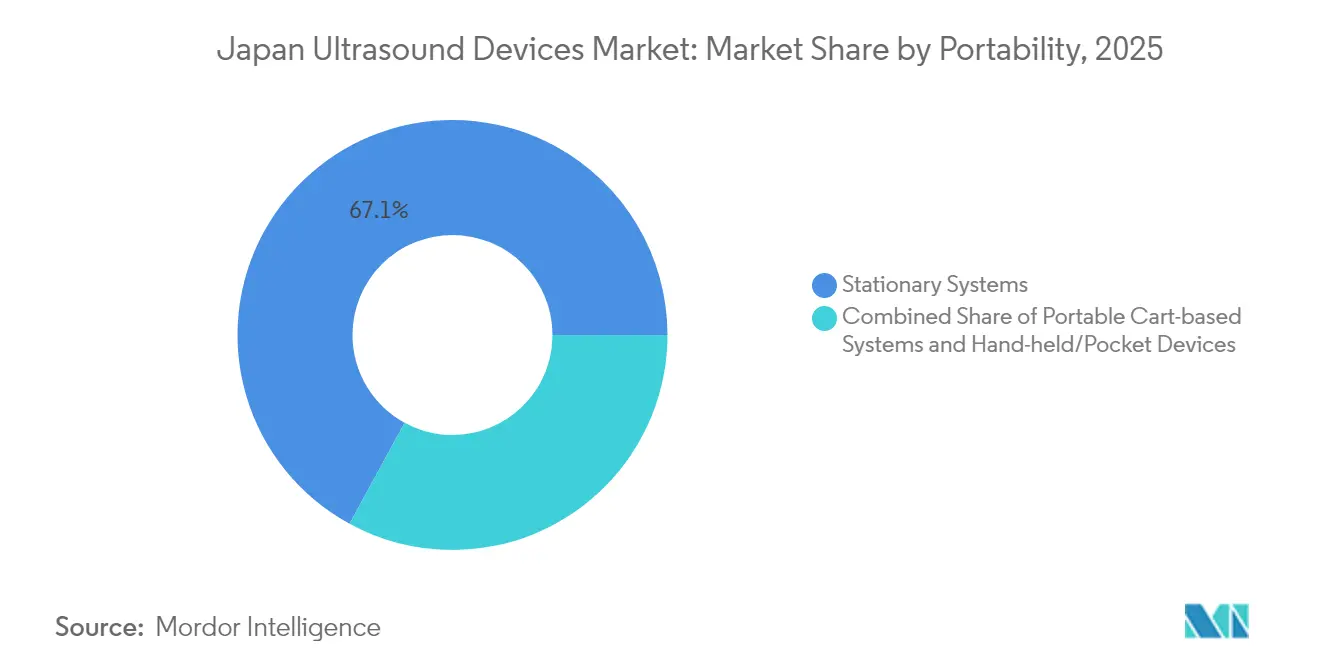
Consoles anchored to imaging suites still generate 67.05% of 2025 revenue, but handheld probes lighter than 400 g and tethered to tablets are capturing physician mindshare at an 7.74% CAGR. Pandemic-era infection-control lessons persuaded clinicians to triage patients at the bedside, a workflow handhelds facilitate. Comparative bench tests ranked SonoEye and Vscan Air highest for B-mode clarity and ergonomic software, demonstrating capability parity with mid-range carts.
Cart-based portables deliver a middle path by preserving Doppler and elastography features while rolling easily between wards. Nevertheless, reimbursement parity for handheld examinations, combined with the government’s free-loan program for rural clinics, accelerates volume migration toward pocket devices.
By End User: Private Hospitals Outpace Public Counterparts
Public hospitals and university clinics held 56.72% of Japan ultrasound market share in 2025, reflecting their role as tertiary centers and teaching hubs. They face the heaviest architectural depreciation and DRG-linked capital rationing, limiting rapid fleet renewal. Conversely, private hospitals expand imaging suites to secure competitive differentiation, delivering a forecast 7.12% CAGR through 2031.
Diagnostic imaging centers maintain specialized ABUS and vascular services, chiefly in metropolitan areas where population density yields economies of scale. Ambulatory surgery centers and specialty clinics form a tertiary customer tier, leveraging handhelds for pre-operative assessments. Emerging home-health organizations pilot remote ultrasound guided by tele-mentoring, opening a nascent consumer-facing channel for the Japan ultrasound market.
Geography Analysis
Metropolitan corridors encompassing Tokyo, Osaka, and Nagoya account for major share of ultrasound equipment installed base, undergirded by high patient throughput and abundant specialist availability. These cities spearhead AI pilots where cloud connectivity and 5G support real-time data off-loading, reinforcing continuous imaging workflow upgrades. Rural prefectures, by contrast, struggle with physician shortfalls and transportation barriers; handheld scanners, shipped via government grant programs, bridge access gaps by enabling community nurses and general practitioners to perform basic echography under remote supervision.
Regional replacement cycles track aging infrastructure: hospitals older than 40 years cluster disproportionately in northern Tohoku and parts of Kyushu, generating concentrated demand for console swaps. However, budgetary latitude is narrower; thus vendors often propose trade-in packages and deferred-payment schedules to clinch deals. Island communities such as Okinawa leverage tele-ultrasound to channel images to mainland radiologists, demonstrating how connectivity mitigates geographic isolation.
Medical-device manufacturing itself is geospatially clustered; Canon’s Tochigi plant and Fujifilm’s Saitama R&D hub anchor an innovation belt that collaborates closely with university hospitals. Policy makers encourage such clusters through tax incentives and expedited land-use approvals, ensuring Japan ultrasound market resiliency against global supply-chain headwinds. Standardized PMDA regulations apply nationwide, maintaining product-quality parity irrespective of facility locale.
Regulatory Landscape
Ultrasound devices in Japan fall under the Pharmaceuticals and Medical Devices Act (PMD Act), where the Ministry of Health, Labour and Welfare (MHLW) provides administrative authority and the Pharmaceuticals and Medical Devices Agency (PMDA) carries out scientific review and post-market safety oversight. Market access follows a risk-based classification system (Class I to IV) aligned with GHTF/IMDRF principles, which determines whether entry occurs through notification, third-party certification, or MHLW approval. This framework affects launch sequencing for cart-based, portable, and specialized ultrasound categories.
Manufacturers and marketing authorization holders must also comply with Japan’s QMS Ordinance, which is aligned with ISO 13485 while adding Japan-specific requirements, as part of licensure and ongoing conformity. For AI-enabled functions and digital workflows embedded in imaging, PMDA’s dedicated SaMD consultation and review structure, along with expert committees for software, shapes the evidence package and timing for clinical decision support features, reinforcing the need for early regulatory planning for AI-enabled ultrasound platforms.
Competitive Landscape
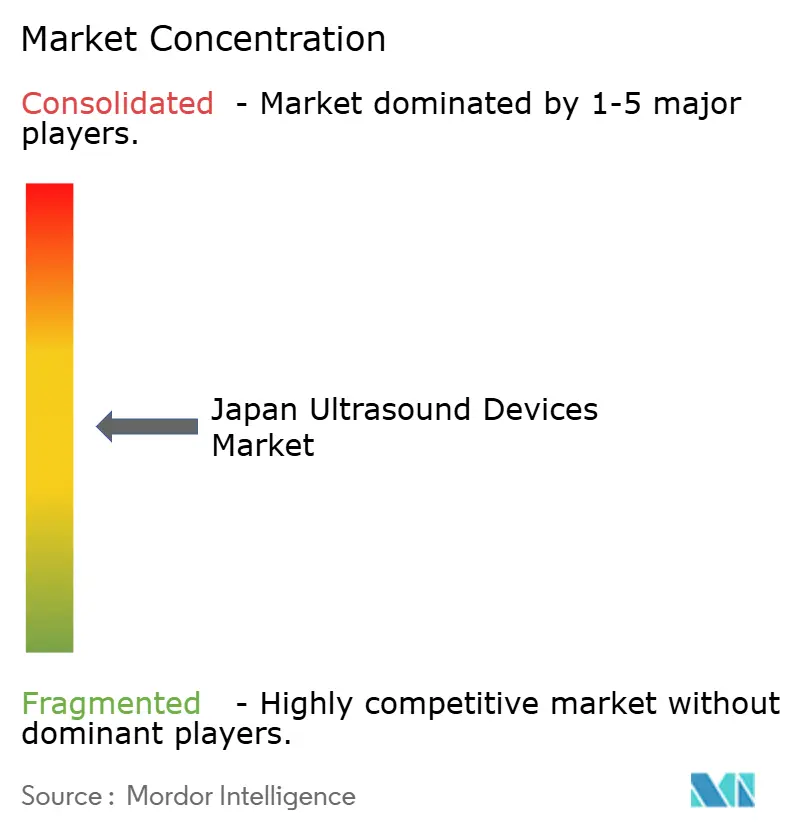
The field is moderately concentrated: the top five suppliers collectively control significant sales, balancing domestic incumbency and global scale. Canon Medical leverages its diagnostic pedigree while Olympus contributes optical leadership to their joint endoscopic-ultrasound venture launched in 2024. Fujifilm’s outpatient-focused cart systems integrate AI triage through a partnership with Us2.ai, exemplifying ecosystem strategies that marry imaging hardware with cloud analytics.
GE Healthcare and Philips adapt flagship platforms to Japan-specific ergonomics, for instance by downsizing console footprints and localizing interface language nuances. Meanwhile, Shenzhen-based entrants price aggressively 20-25% below median but still require PMDA clearance, tempering immediate share wins. Focused-ultrasound startups pursue oncology niches, a pathway potentially insulated from price wars due to therapeutic value differentiation.
Service offerings broaden from warranty-linked maintenances to subscription-based AI upgrades and remote uptime monitoring, mirroring hospital demand for predictable OPEX within DRG confines. Consequently, the basis of competition shifts from pure hardware specs to lifecycle economics and workflow integration a trend likely to reinforce strategic partnerships and consolidation over the forecast horizon of the Japan ultrasound market.
Japan Ultrasound Devices Industry Leaders
-
Fujifilm Holdings Corporation
-
GE Healthcare
-
Siemens Healthineers AG
-
Canon Medical Systems Corporation
-
Koninklijke Philips N.V.
- *Disclaimer: Major Players sorted in no particular order
Market Opportunities and Future Outlook
White space is concentrated in workflow automation and point-of-care deployment that reduces reliance on scarce skilled operators, particularly as hospitals replace legacy analog systems and standardize DICOM connectivity and cybersecurity features. Recent market activity indicates vendors are productizing AI and usability upgrades for Japan, including GE HealthCare Japan launching AI-equipped versions of Venue, Venue Go, and Venue Fit for point-of-care use (April 2026) and introducing the Vivid Pioneer cardiac ultrasound platform with AI-assisted capabilities (March 2026). Together, these launches expand the addressable installed base for software-enabled upgrades and service models across emergency, critical-care, and cardiology pathways.
Procurement channels also support near-term uptake. Public hospital tenders are managed through the JETRO Procurement Portal, which enables structured access to government-linked buyers and multi-site deployments. On the policy side, METI’s Medical Device Industry Vision 2024 emphasizes global expansion and tighter integration of AI and digital health into diagnostic systems, aligning domestic R&D, clinical validation, and commercial pathways for ultrasound suppliers around scalable platforms rather than single-facility placements.
Recent Industry Developments
- July 2026: Fujifilm Holdings Corporation (Fujifilm Medical) launched Sonosite MT Ver1.2 ultrasound device featuring Volume Flow Assist for automated blood flow measurement. The launch expands portable AI-enabled ultrasound capabilities with automated blood flow measurement at the core of PoC and point-of-care strategy. It strengthens Fujifilm's position in handheld and point-of-care ultrasound with AI-assisted workflow enhancements.
- April 2026: GE HealthCare Japan launched AI-equipped versions of Venue, Venue Go, and Venue Fit Point of Care ultrasound devices. The launch expands AI-enhanced PoC and desktop ultrasound platform offerings in Japan. It enhances GE's portfolio with AI-driven imaging and workflow integration in hospital and clinic settings.
- March 2026: GE HealthCare Japan launched Vivid Pioneer, a flagship cardiac ultrasound device with AI-assisted features. The launch expands high-end cardiac ultrasound with AI for clinical workflow optimization. It solidifies GE's leadership in AI-enabled cardiovascular imaging in Japan.
Research Methodology Framework and Report Scope
Market Definition and Coverage
In this report, the market covers ultrasound imaging systems sold and installed in Japan, tracked in value terms based on equipment revenues across common clinical and care settings, and supported by unit movement checks.
Scope exclusions: We exclude ultrasound service revenue, extended warranties, and consumables such as gels and procedure kits.
Segmentation Overview
- By Application
- Anesthesiology
- Cardiology
- Gynecology / Obstetrics
- Musculoskeletal
- Radiology
- Critical Care
- Urology
- Vascular
- Other Applications
- By Technology
- 2D Ultrasound Imaging
- 3D & 4D Ultrasound Imaging
- Doppler Imaging
- High-Intensity Focused Ultrasound
- Other Technologies
- By Portability
- Stationary Systems
- Portable Cart-based Systems
- Hand-held / Pocket Devices
- By End User
- Hospitals & Academic Medical Centers
- Diagnostic Imaging Centers
- Ambulatory & Specialty Clinics
- Home-care Settings
Data Sources, Market Sizing, and Validation
Desk Research
Desk research starts with public health system signals that explain how imaging demand is formed in Japan, and then it is translated into device needs. We typically use sources such as the Ministry of Health, Labour and Welfare publications, Statistics Bureau of Japan series, OECD Health Statistics, and World Health Organization datasets to anchor care delivery trends and population drivers.
To connect demand with supply, we also review association and regulatory touchpoints, such as PMDA updates, and public procurement or hospital disclosures when available. Company annual reports, investor decks, and credible medical trade press help validate product mix shifts like portability, 2D versus 3D and 4D, and replacement cycles. A few paid subscriptions are used only to speed up company financial checks, patent activity screening, and import and export shipment views for imaging equipment. The sources listed above are illustrative, and many other public documents and filings are also reviewed to clarify and cross check data points.
Primary Interviews and Surveys
Primary work is used to pressure test what we saw in public sources, especially on average selling price movement, hospital buying behavior, and how quickly older systems are being replaced. We interview a mix of manufacturers, distributors, hospital procurement teams, clinicians, and service partners across Japan, so gaps around unit volumes and product mix can be addressed before finalizing the model.
Distribution of primary research fieldwork respondents
| Company type | Respondent position |
|---|---|
| Top tier: 28% | CXOs: 13% |
| Mid tier: 58% | Functional/Unit leaders: 37% |
| Smaller Players: 14% | Managers: 50% |
Market-Sizing & Forecasting
Sizing begins with a top-down build that reconstructs Japan device demand from care delivery signals, and then converts that demand into system needs through utilization and replacement logic. For ultrasound, the most useful inputs include hospital and clinic procedure intensity trends, aging population indicators, the split of purchases between cart based and portable systems, typical replacement timing, and the direction of average selling prices by system class.
Those totals are then checked using selective bottom-up approximations, such as rolling up a sample of supplier revenues in Japan, validating channel movement, and testing price per unit assumptions against what interviewees say is achievable in current bids. When bottom-up coverage is incomplete, we fill gaps with conservative share ranges and then adjust only after reconciling with installed base signals and procurement feedback.
For forecasting, we use scenario analysis supported by simple time series smoothing on demand drivers, because hospital budgets and replacement cycles tend to move in steps rather than in a straight line. Growth assumptions are kept realistic by tying them to measurable shifts like portable adoption, imaging workload changes, and pricing pressure for standard 2D systems.
Data Validation & Update Cycle
Validation is done by comparing model outputs against independent checks, such as implied units versus known capacity trends, realistic pricing bands by system type, and consistency with public healthcare spending direction. Any sharp jumps are reviewed again, and we re contact sources when an assumption looks off or when a new product cycle changes the mix.
Before sign off, the dataset and formulas are reviewed in more than one analyst pass so rounding, currency handling, and year alignment errors are removed. Reports are refreshed annually, and interim updates are made when material events occur that can shift demand or pricing. Right before delivery, we do a final scan for recent policy moves, tender outcomes, and macro changes so the view stays current.
Mordor Intelligence's Japan Ultrasound Devices Market Size Compared With Other Published Estimates
Published market sizes for ultrasound devices in Japan can look different because the boundary is not always identical, and because unit and price assumptions are not always checked the same way. The most common drivers are whether services and probes are counted with systems, which years are treated as the base, and how fast pricing is assumed to decline for standard platforms.
Hospital procurement activity signals and implied unit shipments, cross checked through distributor feedback, are the evidence points that keep Mordor Intelligence aligned to equipment only revenue and realistic price bands in Japan. The remaining spread usually comes from differences in what is bundled into the market and whether forecasts use aggressive replacement cycle upgrades or a steadier installed base renewal path.
Benchmark comparison
| Source | Market Size | Gaps in Research Methodology |
|---|---|---|
| Mordor Intelligence | USD 512.41 M (2025) | |
| Global Consultancy A | USD 0.59 B (2025) | This figure appears to bundle device services and add ons with system sales, and it also applies a higher blended ASP that does not fully reflect pricing pressure in standard 2D platforms. |
| Industry Association B | USD 0.46 B (2025) | This estimate likely reflects a narrower reporting boundary that leans toward hospital purchases only, which can undercount clinics and outpatient centers that buy portable units and smaller cart systems. |
Taken together, the table suggests that most of the gap is created by bundling choices and the way pricing and replacement are treated across care settings. Our approach stays traceable because the steps move from demand signals to unit needs, and then to value using clearly checked price bands and mix assumptions that can be repeated.
Key Questions Answered in the Report
What is the projected value of the Japan ultrasound market in 2031?
It is expected to reach USD 671.67 million, reflecting a 4.61% CAGR.
Which application area is expanding fastest in Japanese ultrasound use?
Critical-care imaging is advancing at 6.38% CAGR through 2031.
How large is the handheld segment expected to become by 2031?
Handheld devices are projected to grow at 7.74% between 2026-2031
Why do PMDA approval timelines matter to device vendors?
They stretch 9-16 months, which delays revenue realization and elevates compliance costs.
What strategic alliance shapes Japan’s endoscopic ultrasound niche?
Canon Medical and Olympus collaborate to co-develop next-generation endoscopic ultrasound systems.