
Market Overview
| Study Period | 2021 - 2031 |
|---|---|
| Forecast Data Period | 2026 - 2031 |
| Base Year Market Size (2025) | 157.75 gigawatt |
| Market Volume (2026) | 163.71 gigawatt |
| Market Volume (2031) | 197.08 gigawatt |
| Growth Rate (2026 - 2031) | 3.78 % |
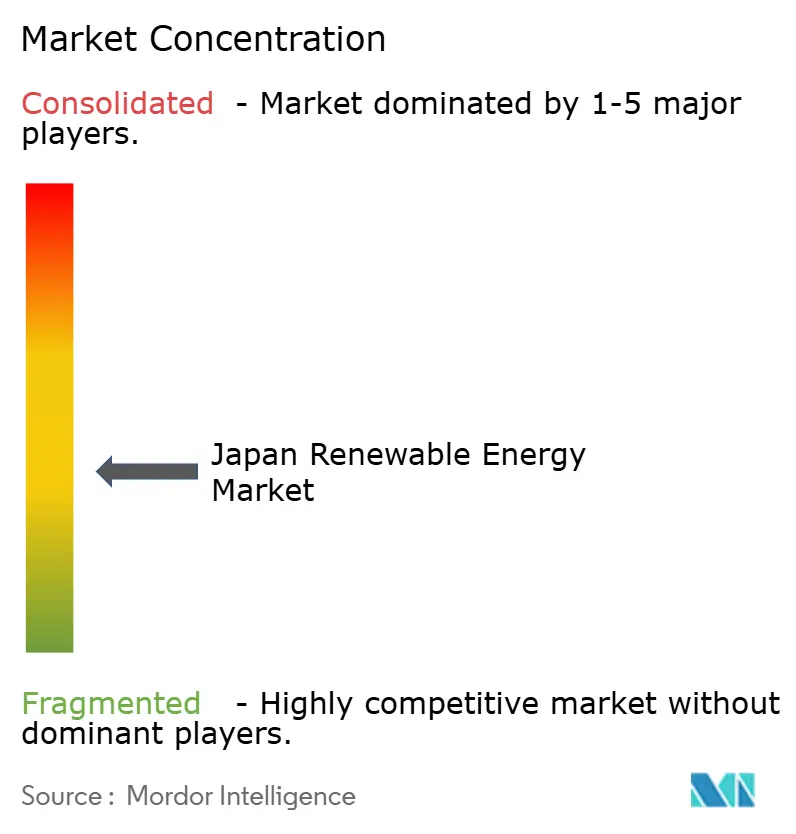
| Market Concentration | Medium |
Major Players *Disclaimer: Major Players sorted in no particular order Image © Mordor Intelligence. Reuse requires attribution under CC BY 4.0. | |
Japan Renewable Energy Market Analysis by Mordor Intelligence
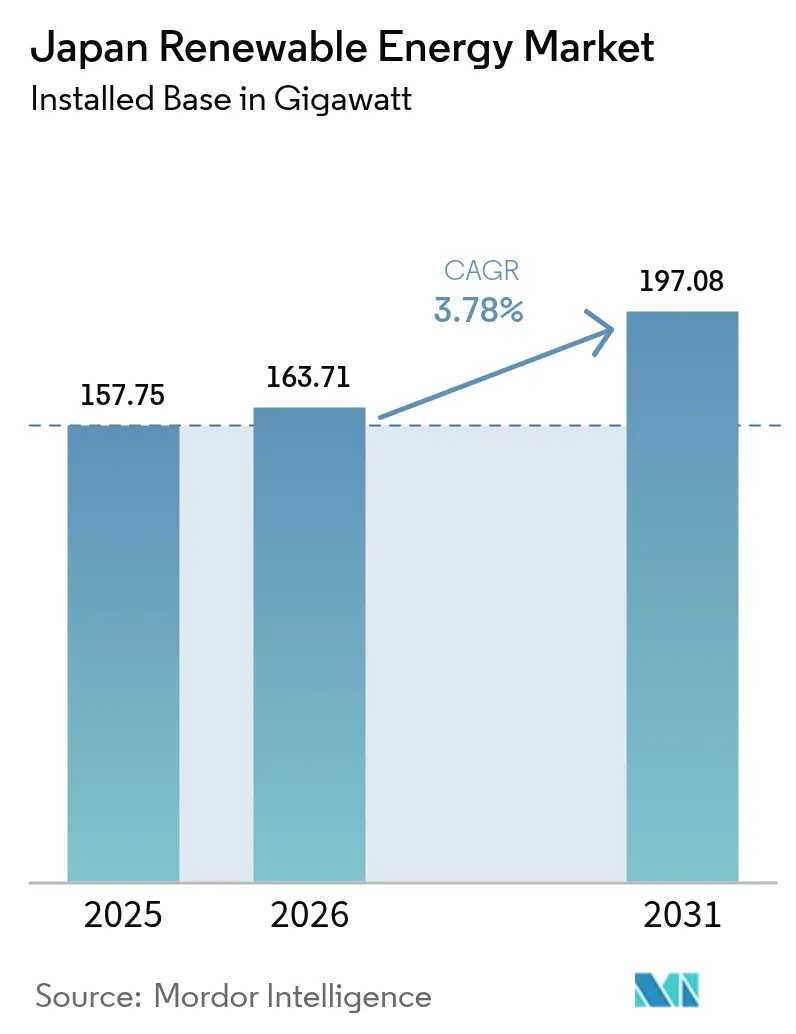
The Japan Renewable Energy Market size was valued at 157.75 gigawatt in 2025 and estimated to grow from 163.71 gigawatt in 2026 to reach 197.08 gigawatt by 2031, at a CAGR of 3.78% during the forecast period (2026-2031).
The growth is underpinned by incremental policy support, accelerating rooftop adoption, and the roll-out of offshore wind auctions. Solar PV retains the largest installed base, yet grid congestion in Kyushu and land scarcity elsewhere are tilting marginal investment toward offshore wind, battery storage, and agrivoltaics. Merchant exposure introduced by the March 2024 Feed-in Premium (FIP) forces developers to manage price risk, while falling module and battery costs compress paybacks for households and corporates alike. Foreign turbine suppliers and Chinese module makers have intensified competition, prompting Japanese utilities to hedge with hydrogen and ammonia pilots that vie for the same capital pool. Overall, the Japan renewable energy market continues to expand, though its pace is moderated by transmission bottlenecks and lengthy environmental permitting that delay project monetization.
Key Report Takeaways
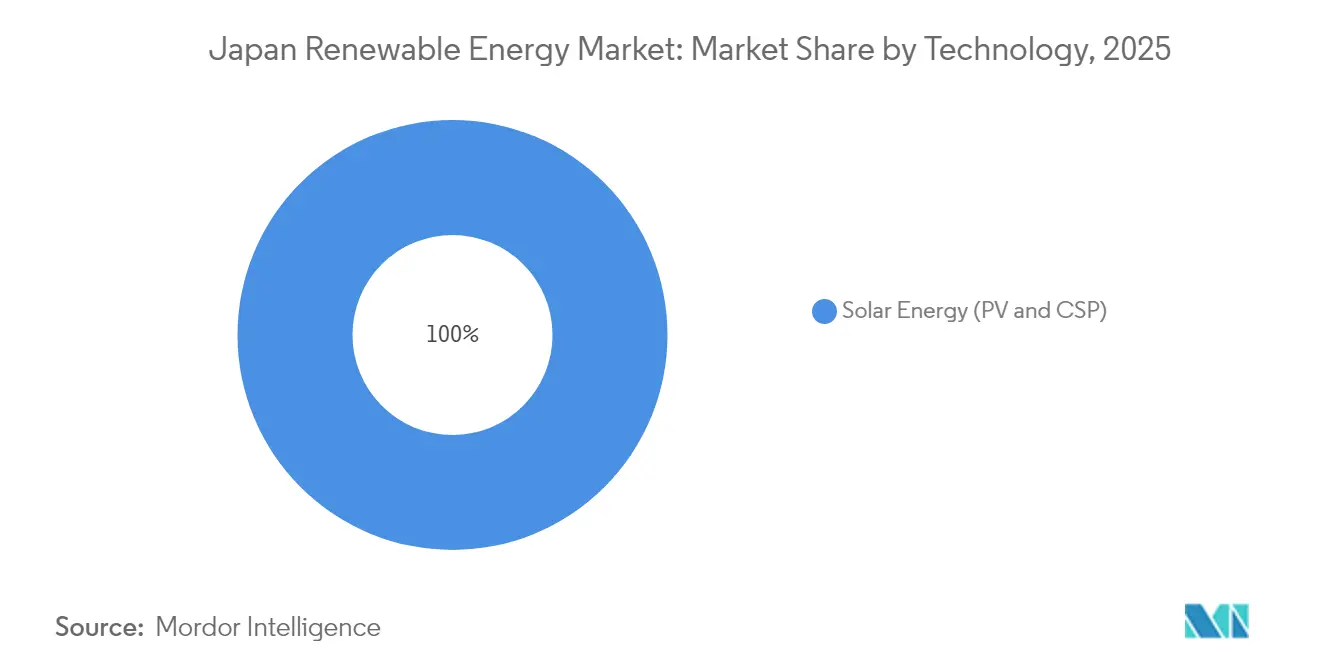
- By technology, solar energy commanded a 59.02% share of the Japan renewable energy market in 2025, while wind energy is forecast to advance at a 28.2% CAGR through 2031.
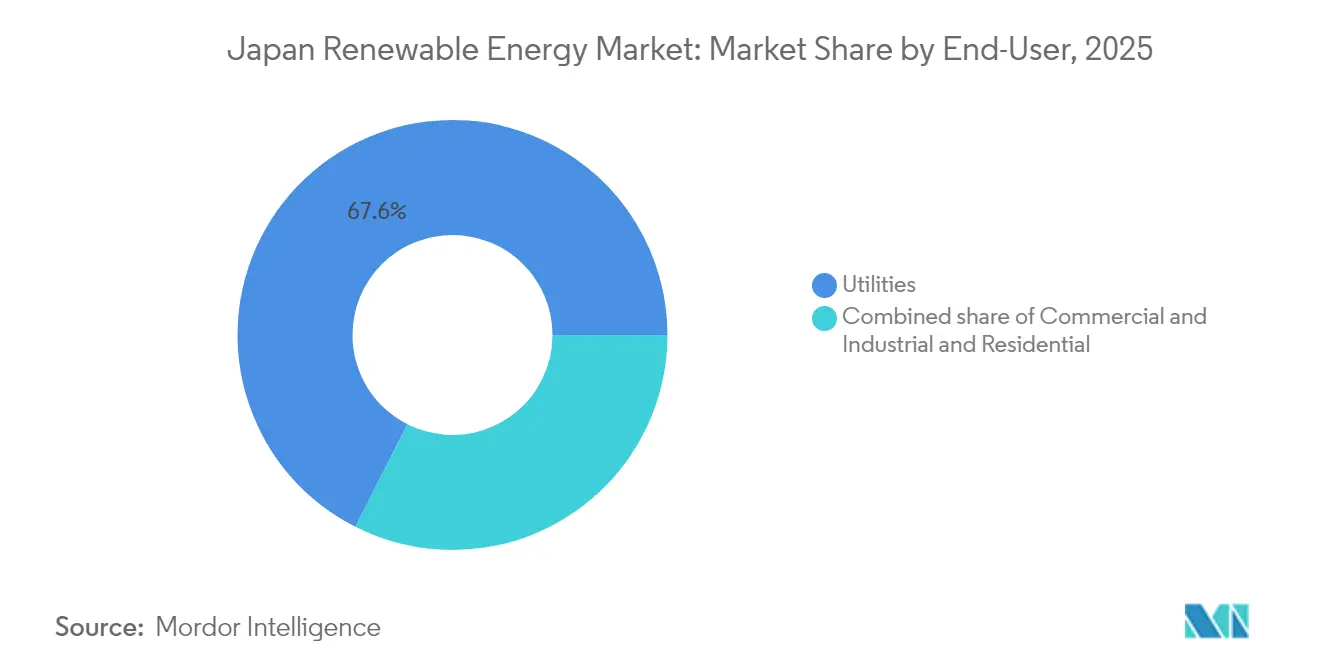
- By end-user, utilities held 67.55% of the Japan renewable energy market share in 2025, whereas the residential segment is poised to grow at a 7.25% CAGR over 2026-2031.
Note: Market size and forecast figures in this report are generated using Mordor Intelligence’s proprietary estimation framework, updated with the latest available data and insights as of 2026.
Japan Renewable Energy Market Trends and Insights
Drivers Impact Analysis*
| Driver | (~) % Impact on CAGR Forecast | Geographic Relevance | Impact Timeline |
|---|---|---|---|
| Cost-competitive solar PV and onshore wind | +1.2% | National, Kyushu and Hokkaido clusters | Medium term (2-4 years) |
| Post-Fukushima energy-security mandate | +0.9% | National | Long term (≥ 4 years) |
| Offshore wind auctions and 60% local-content rule | +0.8% | Akita, Aomori, Chiba, Nagasaki | Long term (≥ 4 years) |
| Agrivoltaics unlocking farmland solar potential | +0.5% | Nagano, Yamanashi, Tochigi | Medium term (2-4 years) |
| Corporate PPA boom from tech and automotive majors | +0.4% | Kanto, Chubu, Kansai | Short term (≤ 2 years) |
| Grid-scale battery storage and V2G integration | +0.6% | Kyushu, Kanto | Medium term (2-4 years) |
| Source: Mordor Intelligence | |||
Cost-competitive Solar PV and On-shore Wind
Sharp’s 610 W TOPCon panels, with a conversion efficiency of 22.58%, and GE Vernova’s 147 MW Abukuma wind farm illustrate how efficiency gains and scale economics have driven levelized costs below fossil-fuel benchmarks.[1] Floating PV boosts output by up to 15% as water cooling lowers module temperatures, and Japan now hosts 73 of the world’s 100 largest floating arrays. National wind capacity reached 5,840 MW across 2,720 turbines in 2024, giving developers confidence to treat wind as a quasi-baseload resource.[2] Competitive costs reduce reliance on feed-in tariffs, drawing institutional investors into the Japan renewable energy market and widening financing avenues.
Post-Fukushima Energy-Security Mandate
Japan’s self-sufficiency ratio climbed to 15.2% in fiscal 2023 as renewables displaced imported fuels. The 7th Strategic Energy Plan aims to elevate renewables to 40-50% of electricity generation by 2040, thereby embedding long-term policy certainty. Fukushima’s green-hydrogen hub in Namie Town highlights how disaster-affected regions are shifting from nuclear dependence to a renewables-led reconstruction. Because the mandate is situated within national security discourse, support remains consistent across administrations, shielding the Japanese renewable energy market from policy reversals.
Offshore Wind Auctions & 60% Local-Content Rule
Round 3 auctions in December 2024 awarded 1 GW at a record-low JPY 3/kWh, while obliging developers to source 60% of their power domestically. The rule has triggered investments in nacelle assembly, blade fabrication, and subsea-cable plants by firms such as JGC Japan and Sumitomo Corporation. TEPCO’s partnership with NEDO on floating-turbine prototypes aims to unlock deep-water sites beyond 50 m. Broader development zones within Japan’s Exclusive Economic Zone (EEZ) expand the viable seabed tenfold, underpinning the potential for multi-gigawatt build-out.
Agrivoltaics Unlocking Farmland Solar Potential
More than 3,000 agrivoltaic arrays now operate nationwide, with regulations requiring crop yields to remain within 80% of baseline yields on comparable farms. Semi-transparent perovskite and organic PV films achieve 5-5.5% light utilization efficiency while preserving photosynthesis, enabling farmers to rent air rights above crops without losing arable acreage. Government-designated “advanced decarbonization areas” across 36 prefectures incentivize dual-land use, adding new revenue streams for rural communities and unlocking significant latent capacity for the Japan renewable energy market.
Restraints Impact Analysis*
| Restraint | (~) % Impact on CAGR Forecast | Geographic Relevance | Impact Timeline |
|---|---|---|---|
| Land scarcity and community opposition | -0.7% | Nagano, Yamanashi, Kumamoto | Short term (≤ 2 years) |
| Grid congestion and curtailment risks | -0.9% | Kyushu, Hokkaido, inter-regional links | Medium term (2-4 years) |
| Slow environmental permitting for offshore wind | -0.5% | Akita, Aomori, Nagasaki | Long term (≥ 4 years) |
| Capital flight toward hydrogen and ammonia pilots | -0.6% | Kanto, Chubu industrial nodes | Medium term (2-4 years) |
| Source: Mordor Intelligence | |||
Land Scarcity & Community Opposition
Large “megasolar” projects can raise local surface temperatures by 2.85 °C and trigger visual-impact complaints, adding to social friction in land-constrained prefectures.[3] End-of-life panel disposal worries and wind-turbine noise concerns fuel resistance, lengthening approval cycles. Developers now deploy early stakeholder dialogues, micro-sitings and benefit-sharing models to tackle acceptance hurdles, yet consent processes still moderate the trajectory of the Japan renewable energy market.
Grid Congestion / Curtailment Risks
Kyushu curtailed 6.7% of renewable output in fiscal 2023 as inter-regional lines hit thermal limits, and nuclear units maintained inflexible baseload dispatch. The nine-area grid structure fragments power flow and complicates economic dispatch. Investments in high-capacity interconnectors, pumped-hydro upgrades, and negative-pricing rules are planned, but near-term bottlenecks persist.
*Our forecasts treat driver/restraint impacts as directional, not additive. The impact forecasts reflect baseline growth, mix effects, and variable interactions.
Segment Analysis
By Technology: Offshore Wind Outpaces Solar’s Installed Lead
Wind energy, encompassing onshore and offshore, is forecast to grow at a 28.2% CAGR through 2031, the highest among technologies, propelled by the 10 GW offshore target and the 1.065 GW Round 3 auction award. Fixed-bottom turbines exploit shallow sites, representing 15% of territorial waters, while floating prototypes aim to harvest the deeper 80% share of potential, positioning offshore wind as the next major pillar of Japan's renewable energy market. Transmission bottlenecks in Hokkaido restrain onshore additions, but Vestas and Siemens Gamesa secured 400 MW in 2024 orders, signaling a persistent appetite among developers.
Solar PV maintained a 59.02% portion of the Japan renewable energy market size in 2025, reflecting legacy FIT installations that added up to 91.6 GW. The FIP scheme slows utility-scale roll-out, yet residential and commercial rooftops added 3.8 GW in 2024. Agrivoltaic systems supplied 1.2 GW, leveraging dual-use benefits for land-constrained prefectures. CSP remains negligible due to diffuse isolation and land limitations, while hydropower and geothermal provide valuable baseloads but see modest expansion due to environmental and social hurdles.

By End-User: Residential Gains as Utilities Slow
Utilities accounted for 67.55% of the Japan renewable energy market share in 2025, leveraging balance-sheet strength to absorb merchant exposure under FIP. Yet capital diversion to hydrogen and ammonia, alongside curtailment-induced EBITDA erosion, is tempering incremental utility capacity. The Long-Term Decarbonization Auction reinforced a shift toward grid-service revenue streams, including storage and demand response.
The residential segment is expected to expand at a 7.25% CAGR through 2031, the swiftest among end-users, as net-metering and time-of-use tariffs shorten paybacks to 6-8 years. Battery pairing reached 40% in 2024, with Sharp and Panasonic bundling solar, storage, and heat pumps to raise self-consumption. Commercial and industrial customers, who hold 24.05% of capacity in 2025, continue to adopt onsite generation. However, the absence of a standardized virtual PPA framework constrains utility-scale offtake growth, keeping the Japanese renewable energy industry reliant on bespoke agreements.
Geography Analysis
Regional disparities shape project economics across the archipelago. Kyushu amassed 12 GW of solar capacity by 2024, supplying 40% of its generation at midday; however, curtailment on 97 days resulted in 1.2 TWh being wasted, equivalent to the yearly usage of 350,000 households. Planned inter-regional upgrades worth JPY 800 billion will add 5 GW of transfer capacity by 2030, easing the bottleneck, although completion is expected to stretch to 2032.
Hokkaido’s 1.5 GW wind fleet exploits 7.5 m/s speeds, but export fees of JPY 8-10 per kWh sap returns, capping utilization and limiting fresh build. Tohoku and Akita emerged as offshore wind nodes after the Round 3 auction, which allocated 615 MW to Aomori and 450 MW to Yuza. Orsted’s 139 MW Akita Noshiro commissioning in 2024 validated fixed-bottom economics in sub-50-meter depths despite protracted fishery talks.
Kanto and Chubu have a dense concentration of C&I solar demand, exemplified by Google’s 50 MW PPA, which powers Tokyo and Nagoya data centers. Kansai lags with only 3.2 GW of capacity, as Osaka channels funds to hydrogen hubs instead of distributed generation. Scenic-area setbacks in Nagano and Yamanashi hinder ground-mount growth, while the Goto Islands' floating pilot, delayed until 2026, aims to unlock deepwater wind across southern prefectures.
Regulatory Landscape
Japan’s renewable build-out is anchored by METI-led power market reforms and the Strategic Energy Plan framework. The 7th Strategic Energy Plan, formulated in February 2025, positions renewables as a core pillar of the power mix with a 40-50% electricity generation share target by 2040. In March 2024, the shift to Feed-in Premium (FIP) increased merchant-price exposure for developers, pushing more projects toward price-risk management through PPAs and trading strategies.
Policy implementation in 2026 tightens market participation requirements and grid funding mechanisms. For FY2026, the renewable energy levy is set at JPY 4.18/kWh, and solar facilities of 50 kW or more fall under the FIP system, moving the sector away from fixed FIT revenues. As of March 2026, METI expanded its authority to include direct oversight of the Balancing Market and the planned Mid-Long Term Market. A bill submitted to the Diet in March 2026 to amend the Electricity Business Act seeks to strengthen OCCTO support for large-scale power sources and grid infrastructure through fiscal investment and loan programs. Separately, METI has set retailer supply volume obligations (50% three years ahead and 70% one year ahead) and indicated updates to supply-plan formats by autumn 2026.
Competitive Landscape
The Japan renewable energy market features moderate fragmentation. TEPCO Renewable Power, JERA, and Kansai Electric own legacy hydro and sizable solar assets, yet face rising competition from international developers such as Ørsted Japan and Vestas, which pair EPC capability with global supply chains. Sumitomo and Marubeni are redirecting their trading-house portfolios away from coal into wind, PV, and storage, while leveraging their project-finance networks.
Technology differentiation is accelerating. Sharp commercialized high-efficiency n-TOPCon modules, Toshiba deploys AI-based wind-forecasting to reduce balancing costs, and Mitsubishi Heavy Industries tests ammonia-co-firing turbines, deepening vertical integration. Digital aggregators like REXEV bundle EV fleets into virtual power plants, expanding ancillary-service revenues and reshaping competition around software and data rather than mere megawatt ownership.[5]
Strategic moves include JERA’s joint venture with BP for global offshore wind, Sumitomo’s equity stake in Europe’s EEW turbine-tower group, and Marubeni’s significant investments in large-scale batteries. M&A momentum is expected to intensify as feed-in premium contracts mature and secondary market liquidity improves, pushing the Japanese renewable energy market toward a more consolidated yet innovation-led order.
Japan Renewable Energy Industry Leaders
-
TEPCO Renewable Power Inc.
-
Japan Renewable Energy Co. Ltd.
-
Renova Inc.
-
Mitsubishi Heavy Industries Ltd.
-
Orsted Japan K.K.
- *Disclaimer: Major Players sorted in no particular order
Market Opportunities and Future Outlook
Japan’s near-term whitespace is concentrated where policy and grid needs intersect: offshore wind scale-up, floating wind commercialization, and flexibility assets that can reduce curtailment and balancing costs under FIP. The December 2024 Round 3 offshore wind auction awarded about 1 GW at a record-low JPY 3/kWh and enforced a 60% local-content rule, which opens demand across towers, blades, nacelle assembly, and subsea-cable manufacturing, alongside services linked to environmental permitting and fisheries engagement. By 2026, operational milestones provide more execution proof points, including Kansai Electric Power commencing commercial operation of the Goto Offshore Wind Farm and J-POWER commencing operation of the 220 MW Kitakyushu Hibikinada Offshore Wind Farm, reinforcing pipeline expectations connected to auction rounds and developer portfolios.
A second opportunity cluster is forming in distributed solar and storage aligned to corporate and municipal decarbonization programs. Developers are increasingly financing non-FIT portfolios and expanding aggregation capabilities. For FY2026, Japan’s policy narrative also reflects rising electricity demand tied to AI, data centers, and semiconductors, supporting investment in firmed renewable supply structures, grid services, and longer-duration flexibility. Recent corporate actions show where financing routes are materializing: RENOVA closed project finance for 170 MW-DC of non-FIT decentralized solar across roughly 1,300 sites, while ITOCHU announced joint promotion of a utility-scale battery energy storage project in Chikuzen-machi, Fukuoka, selected for a METI FY2025 subsidy program. This points to storage developers pairing subsidy frameworks with congestion and curtailment mitigation needs, particularly in Kyushu.
Recent Industry Developments
- March 2026: Renewable Japan Co., Ltd. acquired the Valdecarretas Solar Power Plant (37.8 MW) in Spain, lifting the group’s total installed capacity in Spain to 52.9 MW. The transaction expands operating cash flow outside Japan and improves development and asset-management capabilities that can be redirected into domestic renewables activity.
- December 2025: TEPCO entered into a 20-year virtual power purchase agreement (VPPA) with Equinix (Singapore) Enterprises Pte. Ltd. for renewable energy from rooftop solar assets with a maximum capacity of 10 MW. The agreement expands VPPA use cases for global digital-infrastructure customers and supports additional rooftop and distributed solar monetization structures.
- August 2024: Sumitomo Corporation bought a stake in EEW Offshore Wind Holding in Germany. The investment strengthens access to offshore wind steel component supply chains and supports localization and procurement strategies relevant to Japan’s offshore wind build-out.
Research Methodology Framework and Report Scope
Market Definition and Coverage
For this study, the market is defined as Japan's renewable power installed capacity, measured in gigawatts, across grid connected and relevant distributed systems, captured by technology within renewables.
Scope exclusions: We do not treat electricity sales revenue, carbon credit value, or renewable project EPC and equipment spend as part of the market size.
Segmentation Overview
- By Technology
- Solar Energy (PV and CSP)
- Wind Energy (Onshore and Offshore)
- Hydropower (Small, Large, PSH)
- Bioenergy
- Geothermal
- Ocean Energy (Tidal and Wave)
- By End-User
- Utilities
- Commercial and Industrial
- Residential
Data Sources, Market Sizing, and Validation
Desk Research
Desk research was used to build the factual base for Japan's renewable capacity, policy direction, and grid context before any modeling was done. We leaned on public datasets and official publications such as Japan's Ministry of Economy, Trade and Industry, the Agency for Natural Resources and Energy, the International Energy Agency, IRENA statistics, and electricity system statistics shared through Japan's national statistical releases. These sources help clarify capacity by technology and the pace of additions.
Alongside these, we reviewed utility disclosures, grid operator publications, project permitting and auction announcements, and company filings and investor presentations to understand commissioning timing, curtailment signals, and typical project scale by technology. We used a paid subscription for company financials and news selectively to cross check plant ownership, announced build plans, and timelines. Patent databases were also referenced to sanity check where technology shifts could affect build rates. The sources listed here are illustrative only, and many other public references were also used for data collection, validation, and clarification.
Primary Interviews and Surveys
Primary work focused on confirming how fast capacity is actually being built and connected in Japan, and which constraints are most binding in the next few years. We spoke with a mix of developers, EPC and component stakeholders, utilities and grid linked experts, and large commercial buyers involved in procurement to test assumptions pulled from public data.
Because this is a Japan-only market, outreach emphasized how national policy is interpreted in practice, and how much of the pipeline is genuinely buildable. We also paid extra attention to permitting pace, grid connection queues, curtailment patterns, and repowering timing so the capacity model does not over count projects that are effectively stalled.
Distribution of primary research fieldwork respondents
| Company type | Respondent position |
|---|---|
| Top tier: 36% | CXOs: 15% |
| Mid tier: 49% | Functional/Unit leaders: 32% |
| Smaller Players: 15% | Managers: 53% |
Market-Sizing & Forecasting
The model starts with a top-down reconstruction of Japan's renewable installed base using official capacity series, grid connection reporting, and technology level additions, then projects forward using expected commissioning and retirement patterns. We corroborate these totals with selective bottom-up approximations, where sampled project pipelines are converted into capacity by applying realistic attrition, timing shifts, and typical plant size ranges, and then the overall numbers are adjusted when the two views disagree.
Key inputs for this market include annual capacity additions by technology, grid connection queue and curtailment signals, policy support settings that affect build economics, offshore wind auction and permitting timelines, and the pace of repowering in mature assets. For forecasting, scenario analysis is used so policy and grid constraints can be reflected transparently, and the scenarios are filtered through what primary respondents consider buildable within Japan's practical timelines. Where bottom-up coverage is thin for a niche technology, we avoid overfitting and instead use conservative adoption paths anchored to known pilots and announced targets.
Data Validation & Update Cycle
Numbers are checked through triangulation across independent signals, then variance checks are run to see if growth rates and additions fit Japan's recent build history. Outliers, such as a sudden jump in a technology total, are reviewed in a second analyst pass and re-tested through follow up outreach if the desk evidence does not explain the change.
The report is refreshed annually, and material events like major policy changes, auction results, or sharp shifts in grid constraints can trigger interim updates. Before delivery, we complete a final review so clients receive the latest version of the market view based on newly released public statistics and verified project movement.
Mordor Intelligence's Japan Renewable Energy Market Estimate Compared With Other Published Estimates
Published market values for Japan renewables often do not match because the underlying unit of measure and what gets counted are different, even when the topic sounds similar. A second reason is timing, since some estimates use older policy assumptions or do not re-check project delays, which can shift near term numbers.
Some external estimates present market value in USD and implicitly mix electricity sales or investment spend into a single headline number. For Mordor Intelligence, the market size is kept as installed renewable capacity in GW, and project spend and power revenue are not added into the same total.
Benchmark comparison
| Source | Market Size | Gaps in Research Methodology |
|---|---|---|
| Mordor Intelligence | USD 157.75 B (2025) | |
| Industry Research Publisher A | USD 79.81 B (2023) | Uses a value-based definition that appears to represent revenue or broader economic value, which makes the total not comparable to a capacity-based market and can also amplify currency and price-cycle effects. |
| Industry Research Publisher B | USD 14.24 B (2025) | Covers renewable power generation infrastructure spend (development, EPC, equipment, commissioning) rather than installed capacity, so it tracks annual investment flow and not the cumulative GW base. |
The spread mainly comes from mixing three different lenses, installed capacity, electricity value, and infrastructure spending, each of which answers a different planning question. By keeping the scope tied to GW and then validating additions and delays through grid and pipeline checks, the estimate stays traceable to repeatable steps rather than to price and currency swings.
Key Questions Answered in the Report
How large is the Japan renewable energy market in 2026?
Installed capacity reached 163.71 GW in 2026 and is on track for 197.08 GW by 2031.
Which technology shows the fastest growth?
Wind energy, driven by offshore projects, is forecast to expand at a 28.2% CAGR through 2031.
Why is curtailment a concern in Kyushu?
Solar output exceeded regional midday demand, leading to curtailment on 97 days and 1.2 TWh of wasted generation in 2024.
What role do agrivoltaics play?
More than 3,400 permitted projects converted 1,200 hectares of farmland, offering farmers new lease income while adding 1.2 GW of solar in 2024.
How does the 60% local-content rule affect offshore wind?
Developers must source most components domestically by 2028, extending financial close timelines but nurturing a local supply chain.
What is driving residential solar adoption?
Net-metering credits, falling module costs, and time-of-use tariffs have cut residential paybacks to 6-8 years, fueling 7.25% CAGR growth expected through 2031.