
Market Overview
| Study Period | 2021 - 2031 |
|---|---|
| Forecast Data Period | 2026 - 2031 |
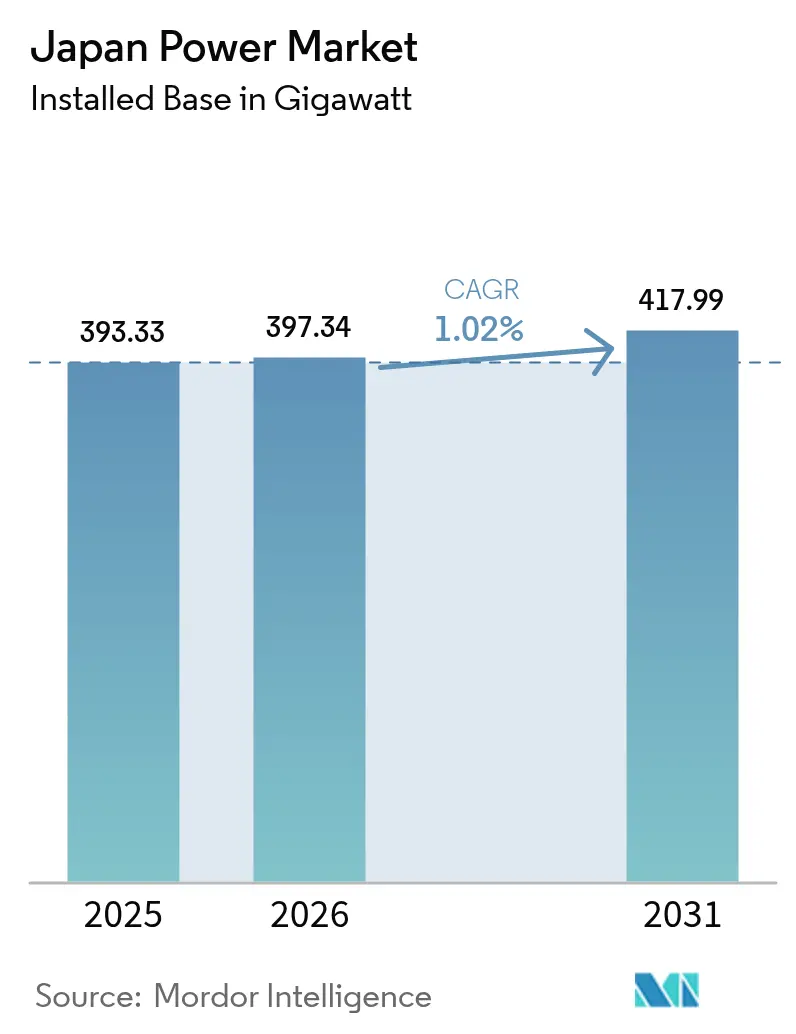
| Base Year Market Size (2025) | 393.33 gigawatt |
| Market Volume (2026) | 397.34 gigawatt |
| Market Volume (2031) | 417.99 gigawatt |
| Growth Rate (2026 - 2031) | 1.02 % |
| Market Concentration | Medium |
Major Players *Disclaimer: Major Players sorted in no particular order Image © Mordor Intelligence. Reuse requires attribution under CC BY 4.0. | |
Japan Power Market Analysis by Mordor Intelligence
Japan Power Market size in 2026 is estimated at 397.34 gigawatt, growing from 2025 value of 393.33 gigawatt with 2031 projections showing 417.99 gigawatt, growing at 1.02% CAGR over 2026-2031.
Steady headline growth conceals structural change: policy now channels the USD 1 trillion Green Transformation (GX) budget into renewable build-out, nuclear restarts, and high-voltage direct-current (HVDC) interties that knit the historically fragmented 50 Hz/60 Hz grids into one commercial arena. Declining solar photovoltaic (PV) costs, offshore wind auction momentum, and accelerating grid-scale battery storage sharpen competitive pressure on legacy liquefied natural gas (LNG) plants, while hydrogen and ammonia co-firing pilots begin hedging fuel-price risk. Energy Storage News. At the same time, Japan’s Cabinet now targets a 40–50% renewable share and a 20% nuclear contribution by 2040 to secure supply for energy-intensive semiconductor and artificial-intelligence clusters. Corporate power-purchase agreements (PPAs), smart-meter data analytics, and demand-response programs amplify these shifts by monetizing grid flexibility in urban corridors where consumption peaks persist despite population decline.
Key Report Takeaways
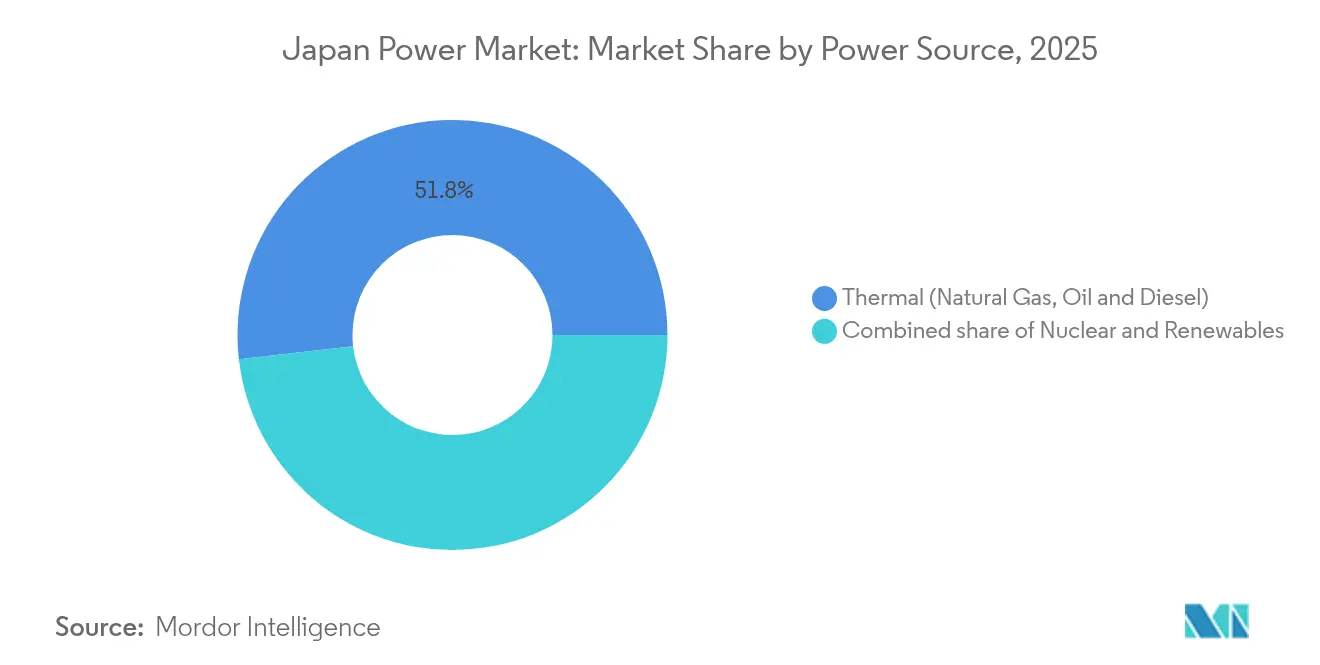
- By power source, renewables led growth with a 3.72% CAGR through 2031, while thermal generation retained a 51.80% Japan power market share in 2025.
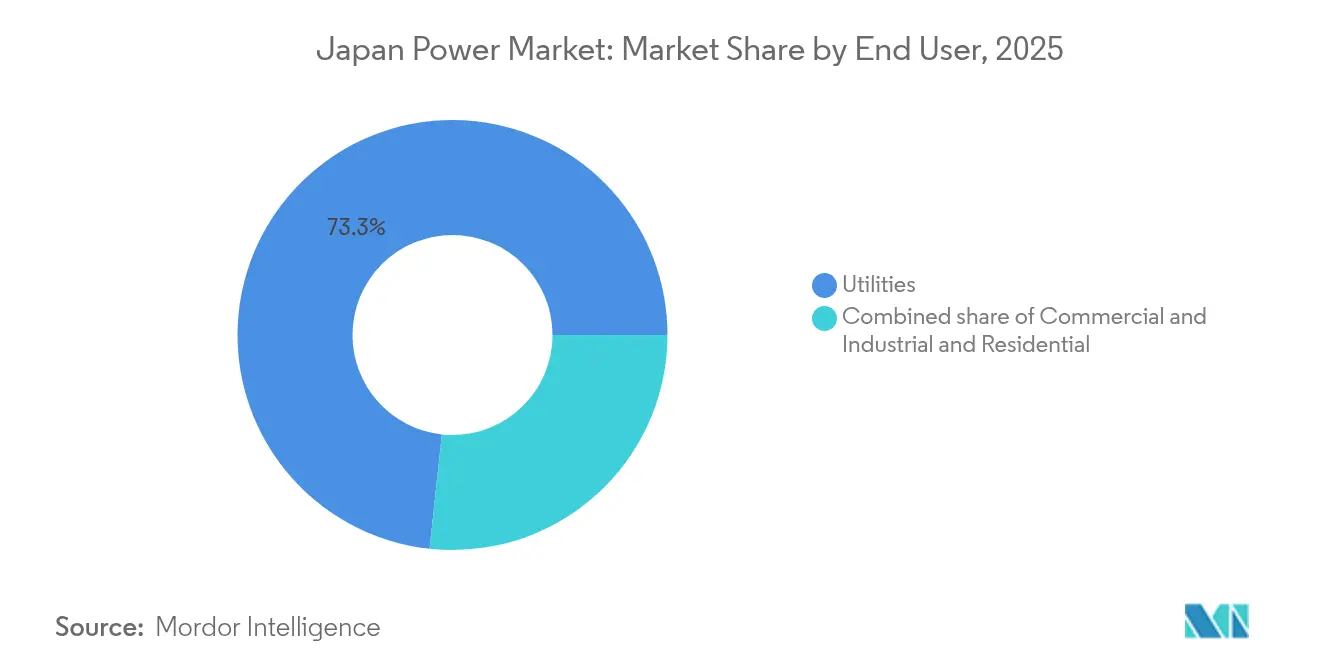
- By end user, the utility segment controlled 73.30% of installed capacity in 2025, but residential deployments expanded fastest at a 3.65% CAGR on the back of rooftop solar uptake.
Note: Market size and forecast figures in this report are generated using Mordor Intelligence’s proprietary estimation framework, updated with the latest available data and insights as of 2026.
Japan Power Market Trends and Insights
Drivers Impact Analysis*
| Driver | (~) % Impact on CAGR Forecast | Geographic Relevance | Impact Timeline |
|---|---|---|---|
| Declining PV Module & Installation Costs | +0.3% | National, with early gains in Kyushu, Kanto, Chubu | Medium term (2-4 years) |
| Offshore Wind Auction Pipeline Expansion | +0.2% | Coastal regions, particularly Hokkaido, Tohoku, Kyushu | Long term (≥ 4 years) |
| Nuclear Reactor Restarts Under GX Policy | +0.4% | Kansai, Kyushu, Shikoku regions with operational plants | Medium term (2-4 years) |
| Grid-Scale Battery Storage Cost Declines | +0.2% | Hokkaido, Kyushu for renewable integration | Medium term (2-4 years) |
| Corporate PPA Demand from Heavy Industry | +0.1% | Manufacturing hubs in Kanto, Chubu, Kansai | Short term (≤ 2 years) |
| Smart-Meter Roll-Out & Demand-Response Upside | +0.1% | Urban centers, particularly Tokyo metropolitan area | Short term (≤ 2 years) |
| Source: Mordor Intelligence | |||


Declining PV Module & Installation Costs
Module prices fell from 17.6 yen/kWh in 2018 to below 8 yen/kWh for several 2024 bids, letting solar compete in wholesale markets without subsidies.[1]Renewable Energy Institute, “Cost Analysis of Solar PV in Japan 2024,” renewable-ei.org Hardware deflation and streamlined soft costs now move the technology from feed-in-tariff reliance toward auction-based price discovery. This cost curve dovetails with rooftop and agrivoltaic deployment that circumvents land scarcity. Manufacturers such as Murata locked 70 MW through virtual PPAs to meet RE100 goals, anchoring demand in industrial corridors. As battery prices drop, midday solar peaks increasingly shift into evening demand, eroding peaking-plant margins and reshaping capacity-market dynamics.
Offshore Wind Auction Pipeline Expansion
Round-3 tenders in December 2024 awarded 1 GW at JPY 3/kWh, confirming cost parity with conventional generation.[2]White & Case, “Japan Offshore Wind Round 3 Results,” whitecase.com Floating foundations unlock deeper waters and sidestep coastal depth constraints, with JERA-led groups targeting typhoon-resilient platforms. Government grid-reservation directives now coordinate seabed leases with transmission build-outs, mitigating a historic bottleneck. European developers transfer harsh-environment know-how, while Japanese trading houses supply project finance in a hybrid model that builds domestic supply chains. Resolution of fishing-industry consultations and port-infrastructure upgrades will decide whether the sector can hit the 10 GW by 2030 milestone.
Nuclear Reactor Restarts Under GX Policy
The Nuclear Regulation Authority’s approval of 14 units restored 80.5% factors by 2024, lifting Kansai Electric’s annual fuel-cost savings by roughly JPY 100 billion versus LNG.[3]World Nuclear News, “Japan Restarts Additional Reactors,” world-nuclear-news.org Lifespan extensions beyond 60 years, legalized in 2025, cement nuclear’s baseload role alongside variable renewables. Local consent processes, such as Kashiwazaki-Kariwa’s fiscal 2025 restart, require transparent safety communication and revenue-sharing. Advanced small-modular-reactor (SMR) R&D enjoys GX funding, though commercial timelines hinge on global demonstration records.
Grid-Scale Battery Storage Cost Declines
Japan’s first capacity-market auction cleared 1.67 GW of storage, catalyzing foreign capital such as Singapore-based Gurin’s USD 628 million plan for 2 GWh in Hokkaido.[4]Energy Storage News, “Japan’s First Capacity Market Auction Clears 1.67 GW of Batteries,” energystoragenews.com Projects like Marubeni’s 100 MWh battery smooth wind variability and reduce curtailment. Revenue stacks now blend capacity payments, ancillary services, and energy-arbitrage, while flow-battery pilots promise longer duration and slower degradation. Storage also underpins vehicle-to-grid (V2G) programs as EV fleets rise.
Restraints Impact Analysis*
| Restraint | (~) % Impact on CAGR Forecast | Geographic Relevance | Impact Timeline |
|---|---|---|---|
| LNG Price Volatility & Import Reliance | -0.2% | National, particularly affecting thermal-dependent regions | Short term (≤ 2 years) |
| Limited On-Shore Land for Utility Solar | -0.1% | Densely populated areas in Kanto, Kansai, Chubu | Medium term (2-4 years) |
| Ageing Transmission Assets & Permitting Delays | -0.2% | Rural transmission corridors, inter-regional connections | Long term (≥ 4 years) |
| Local Opposition to New High-Voltage Lines | -0.1% | Rural communities, environmentally sensitive areas | Medium term (2-4 years) |
| Source: Mordor Intelligence | |||
LNG Price Volatility & Import Reliance
Japan imports 96% of its energy, so LNG spot surges once drove day-ahead power prices above USD 1/kWh, compressing utility margins. Although nuclear restarts cut LNG burn 25% since 2014, residual dependency persists. Trading houses now resell contracted cargoes abroad, signalling structural demand erosion, while Kyushu Electric pursues upstream stakes in US export terminals to hedge volatility. Co-firing ammonia or hydrogen is under trial but lacks commercial scale.
Limited On-Shore Land for Utility Solar
Megasolar projects face siting hurdles as community opposition links deforestation to landslide risks, delaying schemes like the stalled Ukushima Island array after a decade of negotiation. Agrivoltaics and rooftop PV gain ground, but grid hosting capacity hits technical limits. Local zoning rules increasingly channel developers toward marginal land with weaker irradiation, nudging levelized costs upward.
*Our forecasts treat driver/restraint impacts as directional, not additive. The impact forecasts reflect baseline growth, mix effects, and variable interactions.
Segment Analysis
By Power Source: Renewables Outpace Thermal While Nuclear Recovers
The renewables slice of the Japan power market size climbed to 40.05% in 2025 and is tracking a 3.72% CAGR through 2031 as solar and offshore wind scale rapidly. Solar alone reached 91 GW cumulative capacity, bolstered by low module prices and merchant PPA uptake. Offshore wind holds just 0.3 GW of operating assets but 10 GW of government-backed targets by 2030 and up to 45 GW by 2040, setting the stage for the fastest absolute growth among resources. Geothermal and biomass remain niche due to permitting limits and imported feedstock costs.
Thermal generation defended 51.80% Japan's power market share in 2025, yet escalating carbon prices and ammonia co-firing mandates pressure long-term economics. JERA's pilot at the 4.1 GW Hekinan coal plant blends 20% ammonia, and government policy seeks fleet-wide adoption by 2030, requiring 3 million t of annual imports. Nuclear restarts added 826 MW in 2024 and will climb toward the 20% generation share goal if community consent improves. Hydropower remains flat at roughly 50 GW because new dam sites face environmental limits. Collectively, shifting shares underscore how investment is tilting toward zero-carbon capacity within the Japan power market.


By End User: Residential Rooftop Solar Leads Growth Amid Retail Liberalization
Utilities controlled 73.30% of nameplate capacity in 2025, but their dominance is slipping as competitive retailers poach customers and as distributed energy resources flourish. The residential segment logged a 3.65% CAGR, the quickest among users, powered by rooftop solar pairings with 10 kWh batteries that exploit time-of-use tariffs. Smart-meter coverage of 99% enables real-time price signals, and utilities now pay households roughly JPY 20,000 per year to enroll batteries in virtual power plants.
Commercial and industrial buyers, especially steel and automotive exporters, executed 2.1 GW of corporate PPAs in 2024 to hedge carbon border adjustment costs. Manufacturing offshoring trimmed national industrial load by 2%, yet data-center growth offset losses, contracting 500 MW of renewables for artificial-intelligence processing loads. As end-user profiles diversify, asset owners and retailers must adapt tariff structures, storage offerings, and green-supply portfolios to retain margin within the evolving Japan power market.
Geography Analysis
Hokkaido and Tohoku host around 35% of onshore and offshore wind potential yet suffer the longest interconnection queues, which will only ease once the 900 MW HVDC link enters service in 2028. Central Honshu, encompassing the industrial Chubu corridor, relies heavily on LNG-fired baseload and therefore carries the greatest fuel-price risk when global gas markets tighten. Kyushu boasts the country’s highest solar penetration, surpassing 20% of peak demand in 2024, which forces operators to curtail midday output unless supported by battery storage.
The Kansai region benefits disproportionately from nuclear restarts, with seven Kansai Electric reactors providing low-cost baseload that undercuts rival retailers and pulls customers from neighboring grids. Shikoku and Chugoku remain net importers of power, depending on cross-regional wheeling to balance demand spikes. Southern coastal prefectures such as Nagasaki and Kagoshima are trialing floating wind and islanded microgrids, respectively, highlighting region-specific decarbonization paths. Cumulatively, regional disparities in resource endowment, grid capacity, and fuel reliance shape investment flows within the Japan power market.
Regulatory Landscape
Japan's power sector is governed through METI, with the Electricity and Gas Market Surveillance Commission (EGC) monitoring market transactions and competition under the electricity system reform framework. A major policy anchor is the Seventh Strategic Energy Plan approved by the Cabinet on February 18, 2025, which sets direction toward 2040 under the S+3E principle (Safety plus Energy Security, Economic Efficiency, and Environment) and links electricity policy more tightly with GX industrial policy.
Within this framework, policy prioritizes renewables as a core power source, including explicit technology pathways such as perovskite solar and floating offshore wind in the EEZ, while also advancing thermal decarbonization options (hydrogen, ammonia, and CCUS) and enabling nuclear operation under strengthened safety oversight. The regulatory direction also elevates grid development and resilience as a national priority alongside fair retail competition, reflecting the need to integrate variable renewables and support rising electricity demand associated with DX and GX initiatives.
Competitive Landscape
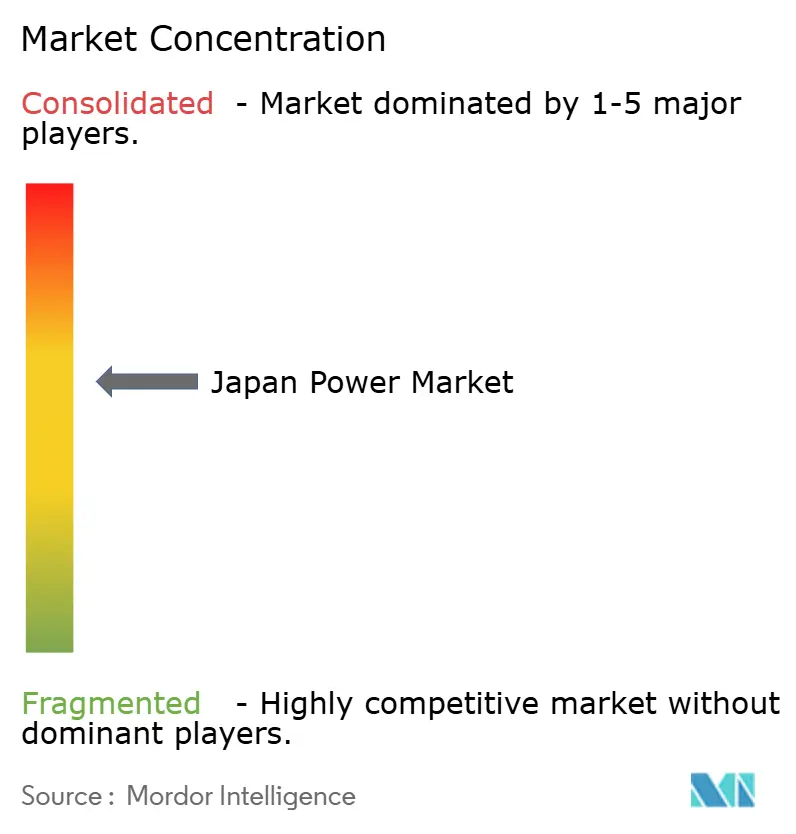
Japan’s sector exhibits moderate concentration; the top five utilities control roughly 65% of installed capacity, while liberalization enables over 700 retail licensees to compete for commercial and household customers. JERA, formed from TEPCO and Chubu Electric thermal assets, dominates LNG capacity and now positions itself for decarbonization leadership via hydrogen-ready turbines and a 1 GW floating-wind pipeline.
Regional incumbents respond by bundling generation, distribution, and retail into integrated service packages with smart-home, EV-charging, and carbon-offset add-ons. Technology suppliers such as Toshiba Energy Systems re-integrate into parent structures to streamline turbines, batteries, and power-electronics sales ahead of divestiture deadlines. International entrants focus on niche flexibility plays: Enel X aggregated 1 GW of demand-response capacity, while Ørsted partners with Marubeni for offshore wind EPC services.
Trading houses, Mitsubishi, Sumitomo, Itochu, leverage project-finance muscle and overseas wind expertise to move up the asset-ownership curve. Equipment makers Hitachi Energy and Mitsubishi Electric intensify competition in HVDC converters and GIS switchgear for frequency-link projects. Intensifying price pressure in the retail segment pushes incumbents to seek regulated returns through grid-modernization capex rather than commodity sales.
Japan Power Industry Leaders
Tokyo Electric Power Company Holdings (TEPCO)
Kansai Electric Power Company
Chubu Electric Power
JERA Co., Inc.
Electric Power Development Co. (J-POWER)
- *Disclaimer: Major Players sorted in no particular order

Market Opportunities and Future Outlook
Grid build-out and system flexibility remain the clearest whitespace, with METI-backed electricity system reforms and financing tools increasingly pointed at large-scale infrastructure. In March 2026, the Cabinet approved a bill to amend the Electricity Business Act to promote large-scale transmission and generation infrastructure, and the FY2026 fiscal investment and loan program earmarked JPY 54 billion (JPY 24 billion for generation, JPY 30 billion for grid development). For developers and utilities, this policy-driven capital channel supports inter-regional transfer capacity, congestion relief, and the market design needed to monetize flexibility (capacity and ancillary services) as solar and wind penetration rises.
The renewable build-out is also expanding procurement and contracting routes beyond legacy FIT dependence, creating room for long-tenor PPAs and auction-linked development where corporate buyers and retailers need traceable green supply. Offshore wind economics and execution discipline have become a gating factor for new projects, highlighted by BP's July 2026 decision to withdraw from a 450 MW offshore wind project off Yuza, Yamagata Prefecture, citing profitability concerns. This pivot raises the premium on bankable bidding structures, port and vessel readiness, and grid-connection certainty, while METI's technology roadmap (perovskite solar, EEZ offshore wind, and next-generation nuclear such as SMR/HTGR) indicates where future project pipelines and domestic supply-chain investment are being steered.
Recent Industry Developments
- July 2026: JERA announced the establishment of JERA Global Energy Solutions to manage LNG, upstream, lower-carbon fuels, and shipping portfolios under a consolidated platform. The announcement strengthens integration across fuel procurement and logistics while supporting the company's decarbonization pathway for thermal generation through portfolio optimization.
- June 2026: Tokyo Electric Power Company Holdings (TEPCO) signed a business alliance agreement with Daiwa House Industry to develop grid-scale battery storage facilities, targeting 1 GW of output and 4 GWh of capacity by 2035. This partnership supports system balancing and renewable integration, and it expands the addressable pipeline for utility-scale storage developers and EPC partners.
- June 2025: Daigas Energy launched a 549.5 kW onsite PPA at Kitagawa Iron Works, providing 100% renewable electricity for 20 years and reducing emissions by about 265 t CO2 per year. The project shows how long-term onsite PPAs are being used to decarbonize industrial loads and broaden renewable demand beyond utility procurement.


Research Methodology Framework and Report Scope
Market Definition and Coverage
This market is sized as Japan's total installed electricity generation capacity in gigawatts, covering grid connected plants that supply power to utilities and end users across the country.
Scope exclusions: Off grid captive generation and behind the meter assets that do not consistently feed the public grid are excluded where capacity is not reported in a way that can be traced over time.
Segmentation Overview
- By Power Source
- Thermal (Coal, Natural Gas, Oil and Diesel)
- Nuclear
- Renewables (Solar, Wind, Hydro, Geothermal, Biomass & Waste, Tidal)
- By End User
- Utilities
- Commercial and Industrial
- Residential
- By T&D Voltage Level (Qualitative Analysis only)
- High-Voltage Transmission (Above 230 kV)
- Sub-Transmission (69 to 161 kV)
- Medium-Voltage Distribution (13.2 to 34.5 kV)
- Low-Voltage Distribution (Up to 1 kV)
Data Sources, Market Sizing, and Validation
Desk Research
Desk work started by mapping Japan's installed base and then tracking how it changes over time, with a check against publicly reported additions, retirements, and policy targets. We used official statistics and system level releases to anchor capacity by technology, and we avoided mixing capacity figures with generation or revenue based narratives.
Sources used included public datasets and reports such as the Agency for Natural Resources and Energy (METI) statistics, OCCTO publications on supply demand and grid planning, the Japan Electric Power Exchange (JEPX) market monitoring materials, and IEA and IRENA country energy profiles, followed by company filings, investor presentations, utility disclosures, and reputable press coverage. Select paid subscriptions were used in a limited way for company financials, targeted news screening, and patent or import export checks when a specific data point needed confirmation. These examples are not exhaustive, and many other public documents were reviewed to collect, validate, and clarify inputs.
Primary Interviews and Surveys
Fieldwork focused on cross checking capacity build plans, retirement timing, and technology specific utilization assumptions with industry participants, so we could close gaps that are not visible in public tables. We spoke with stakeholders across generation owners, grid and system planning roles, energy retailers, EPC and O&M participants, and large power buyers, and we tried to balance views across major demand centers and the broader country footprint.
Distribution of primary research fieldwork respondents
| Company type | Respondent position |
|---|---|
| Top tier: 38% | CXOs: 13% |
| Mid tier: 43% | Functional/Unit leaders: 40% |
| Smaller Players: 19% | Managers: 47% |
Market-Sizing & Forecasting
Sizing starts from a top-down reconstruction of installed capacity by technology, using nationally reported capacity series and then adjusting for commissioning and retirement schedules that can be traced in project pipelines and utility plans. Once the technology totals are set, they are checked with a selective bottom-up view built from a sample of plant additions, typical unit sizes, and publicly stated project timelines, and then totals are tuned when the two views disagree.
Inputs that matter for Japan include planned thermal retirements, nuclear restart timing, renewable interconnection and curtailment constraints, policy signals such as long term energy mix targets, and grid reinforcement priorities that can shift once projects reach operation. For forecasting, scenario analysis is used around the variables with the widest uncertainty, especially restart and retirement timing, followed by smoothing of the remaining series so year to year jumps are explained and not accidental. Where bottom-up information is missing for smaller projects, we fill the gap by applying technology specific average unit size and commissioning lags that were validated in interviews.
Data Validation & Update Cycle
Outputs are validated by comparing implied capacity additions and retirements against independent signals, such as announced project lists, policy milestones, and system operator planning releases, and then we check for unusual step changes that require a second look. Variances are reviewed in analyst checkpoints, and if a key driver moves outside a reasonable band, follow ups are triggered with sources to confirm whether timing, technology classification, or definition caused the shift.
Reports are refreshed annually, and interim updates are made when material events occur, such as major plant closures, large renewable auctions, or nuclear policy and restart decisions. Before delivery, a final review pass is completed so clients receive the latest updated view aligned to the most recent public releases.
Mordor Intelligence's Japan Power Market Size Compared With Other Published Estimates
Published market sizes for Japan's power sector can look far apart because authors do not always size the same thing, and capacity, generation, and revenue can get blended without clear labels. Differences also show up when one estimate counts only generation plants while another adds networks or counts behind the meter assets.
The spread is mainly driven by the chosen unit (GW versus USD), the treatment of captive and off grid assets, and whether nuclear capacity is counted at nameplate or adjusted for restart status. Currency conversion timing and how older capacity is removed in the model can also shift the reported size across the same calendar year.
Benchmark comparison
| Source | Market Size | Gaps in Research Methodology |
|---|---|---|
| Mordor Intelligence | USD 393.33 B (2025) | |
| Industry Association A | USD 365.00 B (2025) | Often focuses on grid connected utility owned capacity and may exclude smaller IPP capacity or treat nuclear nameplate conservatively until clear restart approvals are visible, which reduces the counted GW equivalent. |
| Global Consultancy B | USD 420.00 B (2026) | May roll in a broader power system view by adding embedded or captive capacity and using forward looking commissioning assumptions with faster renewable additions, which can inflate the near term total versus publicly confirmed schedules. |
The table shows that most differences come from whether capacity is counted strictly as installed, grid connected generation and how restart and retirement timing is handled, a choice applied in the installed capacity view used by Mordor Intelligence.


Key Questions Answered in the Report
How large is the Japan power market today?
Installed capacity reached 397.34 GW in 2026 and is set to climb to 417.99 GW by 2031.
What is driving new capacity additions in Japan after 2024?
Offshore wind auctions, lower solar module costs, and grid-scale batteries together underpin most post-2024 growth.
How quickly are renewables gaining share versus thermal power?
Renewables are growing at a 3.72% CAGR to 2031 while thermal share contracts from 51.80% in 2025 under carbon-pricing pressure.
Why are corporate PPAs important in Japan?
Steel, automotive, and semiconductor exporters signed 2.1 GW of PPAs in 2024 to hedge carbon-border tariffs and lock in long-term power prices.
What transmission upgrades are planned to support new offshore wind?
A USD 200 million, 900 MW HVDC link between Hokkaido and Honshu, scheduled for 2028, will ease congestion and release 4 GW of queued wind projects.
How do battery storage economics look after 2024?
Utility-scale lithium-ion systems at USD 150 per kWh make four-hour batteries viable, and capacity-market payments now bolster project IRRs.
Page last updated on:


 Your data is secure and never sold or shared.


