
Market Overview
| Study Period | 2020 - 2031 |
|---|---|
| Forecast Data Period | 2026 - 2031 |
| Base Year Market Size (2025) | USD 88.14 Billion |
| Market Size (2026) | USD 89.54 Billion |
| Market Size (2031) | USD 96.78 Billion |
| Growth Rate (2026 - 2031) | 1.57 % |
| Market Concentration | Medium |
Major Players *Disclaimer: Major Players sorted in no particular order Image © Mordor Intelligence. Reuse requires attribution under CC BY 4.0. | |
Japan Pharmaceutical Market Analysis by Mordor Intelligence
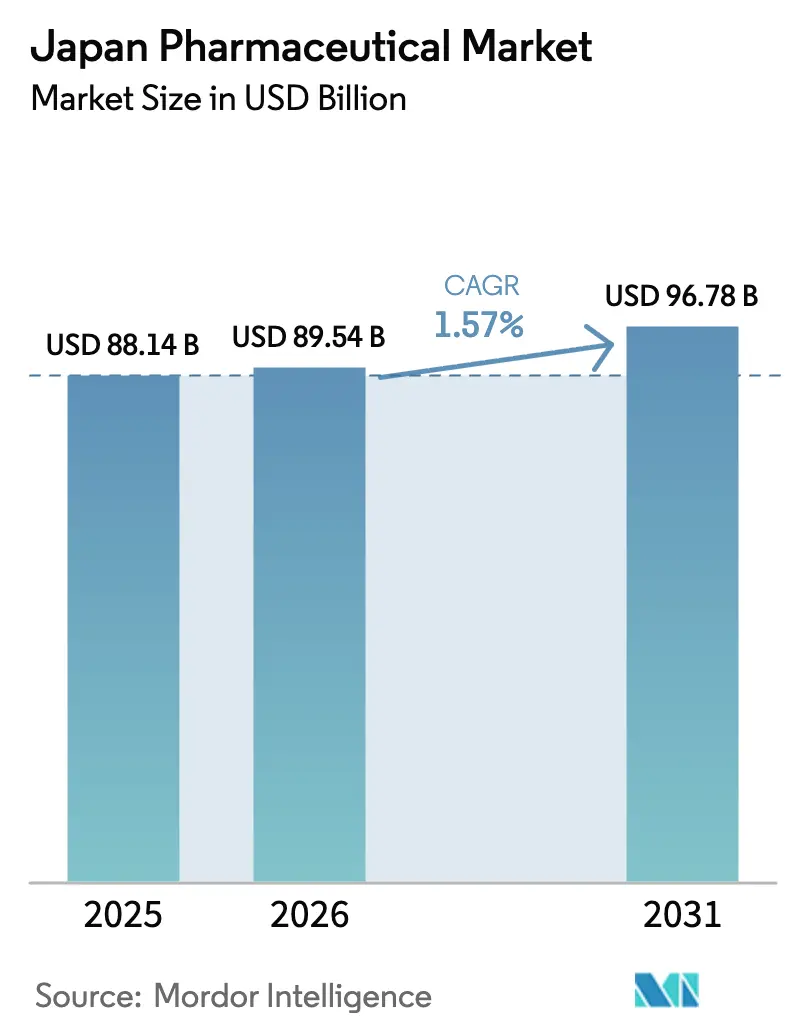
The Japan Pharmaceutical Market size is projected to be USD 88.14 billion in 2025, USD 89.54 billion in 2026, and reach USD 96.78 billion by 2031, growing at a CAGR of 1.57% from 2026 to 2031.
Ongoing reforms to drug pricing, rapid regulatory pathways for breakthrough therapies, and a rapidly aging demographic collectively shape a market in transition, with specialty products and self-care categories moving in opposite directions. Oncology’s momentum, robust pipeline replenishment after major patent expiries, and incentives that reward simultaneous global launches underpin premium-priced segments, while biennial price cuts and aggressive generic substitution squeeze commoditized therapies. Digital health adoption is gathering speed as telehealth-enabled prescription fulfillment and reimbursed software therapeutics deepen patient engagement and support volume growth. Foreign innovators leverage the SAKIGAKE framework to approach Japan as a first-wave launch market, adding competitive intensity. At the same time, persistent API import dependence and real-world evidence demands for reimbursement create volatility that firms must navigate.
Key Report Takeaways
- By drug type, prescription medicines led with 71.78% revenue share in 2025, whereas over-the-counter products are forecast to expand at a 3.93% CAGR to 2031, the fastest within the segmentation.
- By therapeutic area, oncology commanded 18.73% of Japan's pharmaceutical market share in 2025 and is expected to post a 4.19% CAGR through 2031.
- By molecule, small-molecule agents accounted for 64.48% of the Japanese pharmaceutical market size in 2025, while biologics are projected to grow at a 4.97% CAGR between 2026 and 2031.
- By formulation, oral products captured 55.26% revenue share in 2025; injectables represent the high-growth pocket with a 3.74% CAGR forecast to 2031.
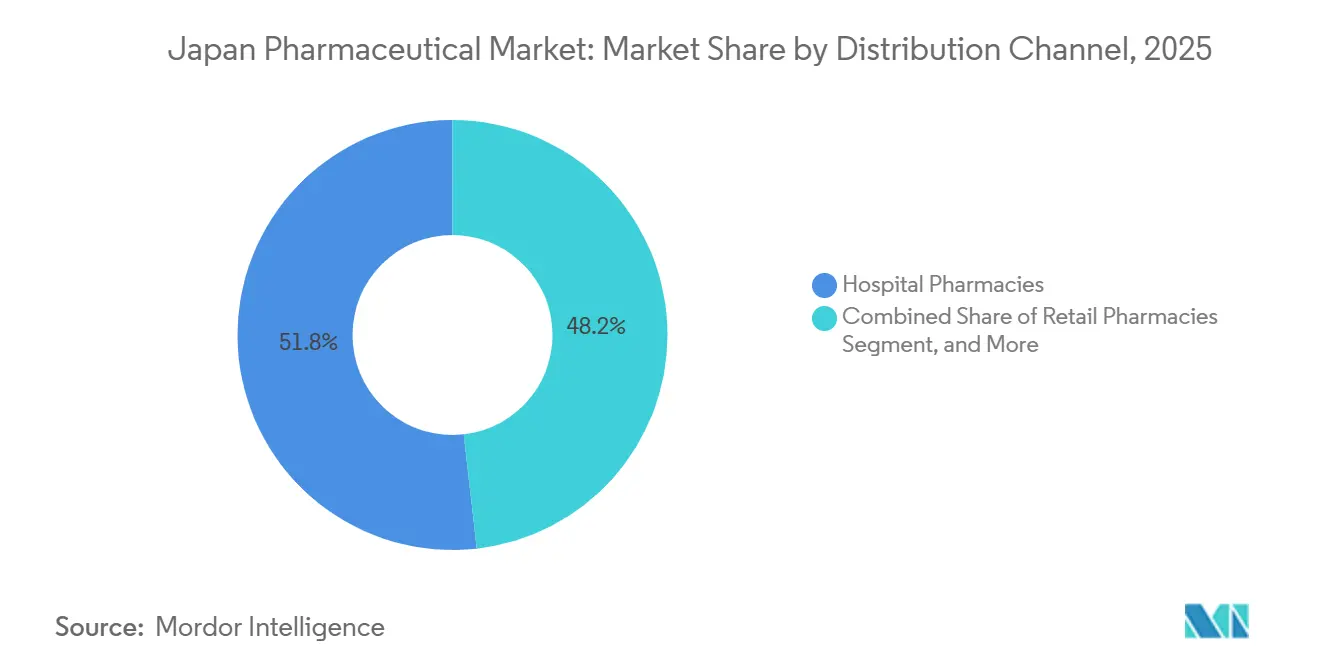
- By distribution, hospital pharmacies retained a 51.84% share in 2025; online and mail-order channels are set to advance at a 4.51% CAGR, outpacing all other routes.
Note: Market size and forecast figures in this report are generated using Mordor Intelligence’s proprietary estimation framework, updated with the latest available data and insights as of January 2026.
Market Trends and Insights
Drivers Impact Analysis of Japan Pharmaceutical Market*
| Driver | (~) % Impact on CAGR Forecast | Geographic Relevance | Impact Timeline |
|---|---|---|---|
| Patent-Cliff Replenishment Through Specialty Drugs | +0.4% | National, concentrated in Tokyo and Osaka metropolitan areas | Medium term (2-4 years) |
| Fast-Track Regulatory Pathways for Breakthrough Therapies | +0.3% | National, with spillover to PMDA-recognized foreign trial sites | Short term (≤ 2 years) |
| Growing Burden of Oncology & Rare Diseases | +0.3% | National, higher incidence in aging prefectures (Akita, Shimane) | Long term (≥ 4 years) |
| Ageing Population Driving Chronic Therapies | +0.2% | National, acute in rural prefectures with >35% elderly population | Long term (≥ 4 years) |
| MHLW Incentives for Companion Diagnostics Integration | +0.2% | National, early adoption in university hospitals and cancer centers | Medium term (2-4 years) |
| Digital-Health-Enabled Adherence Solutions Boosting Prescriptions | +0.1% | National, pilot programs in Tokyo, Osaka, Fukuoka | Short term (≤ 2 years) |
| Source: Mordor Intelligence | |||
Patent-Cliff Replenishment Through Specialty Drugs
Blockbuster experiences have prompted companies to shift toward higher-value, lower-volume assets that maintain pricing power. Humira biosimilars captured 22% of adalimumab prescriptions within 18 months of their 2024 launch, prompting originators to redirect their research and development efforts to antibody–drug conjugates and rare disease enzymes. Takeda’s USD 2.1 billion biologics complex under construction in Fujisawa illustrates capital redeployment toward niche therapies that can earn a 10% premium under the expanded Premium on Marketability Promotion incentive.[1] Smaller biotechs partner with domestic distributors to co-file rapid-launch products, thereby compressing the traditional lag in Japan launches. As margins on legacy drugs decline, specialty pipelines become the preferred hedge against pricing attrition.
Fast-Track Regulatory Pathways for Breakthrough Therapies
The SAKIGAKE designation reduced the median approval review time to nine months in 2024, compared to fourteen months under the conventional process.[2] Conditional approvals granted to oncology biologics, such as Chugai’s Polivy, allowed revenue capture while confirmatory trials continued, a competitive lever rarely available in Europe. Multinationals with global data packages, including AstraZeneca’s Enhertu, have captured double-digit market shares within a year of launch. Real-world evidence obligations introduced in 2025 raise compliance costs, but firms with robust pharmacovigilance infrastructure view the requirement as manageable.
Growing Burden of Oncology & Rare Diseases
Japan reported 1.02 million new cancer cases in 2024, and the proportion of citizens aged 65 years or older increased to 28.9% in 2025. Extended life expectancy raises the prevalence of malignancies and genetic disorders that demand high-cost targeted drugs. Rare-disease designations climbed to 87 in 2024 as expanded exclusivity rules drew global developers to file in Tokyo concurrently with Western markets. Kyowa Kirin’s burosumab secured reimbursement within 90 days of approval, validating payers’ willingness to fund ultra-orphan therapies when evidence is compelling.
Ageing Population Driving Chronic Therapies
Chronic conditions affect more than 70% of Japan’s seniors, and the average number of daily prescriptions per elder stands at 6.2, creating adherence challenges. Partnerships, such as Daiichi Sankyo’s 2024 alliance with NTT Data, deploy AI reminder tools across 500 community pharmacies, reducing hospitalizations related to medication errors. Digital therapeutics for diabetes and hypertension became reimbursable under the 2025 revision of long-term care insurance, integrating software into standard treatment pathways.
Restraints Impact Analysis of Japan Pharmaceutical Market*
| Restraint | (~) % Impact on CAGR Forecast | Geographic Relevance | Impact Timeline |
|---|---|---|---|
| National Drug-Price Revisions & Biennial Cuts | -0.3% | National, acute for high-volume generic manufacturers | Short term (≤ 2 years) |
| Generic Substitution Pressure | -0.2% | National, concentrated in primary-care and retail pharmacy channels | Medium term (2-4 years) |
| Long Approval Timelines for Regenerative Medicines Post-Review | -0.1% | National, affecting university hospitals and specialized centers | Long term (≥ 4 years) |
| Supply-Chain Vulnerabilities for Critical APIs | -0.1% | National, with dependencies on China and India | Short term (≤ 2 years) |
| Source: Mordor Intelligence | |||
National Drug-Price Revisions & Biennial Cuts
The April 2024 revision reduced reimbursement for 53% of listed drugs, with an average decrease of 4.8% for brand-name drugs and 7.2% for generic drugs.[3] Off-year cuts introduced in 2025 targeted high-selling therapies where transaction prices were undershot by at least 2% of the list prices. Sawai’s operating profit fell 9.3% in fiscal 2024, as prices for atorvastatin and amlodipine declined. As value-based pricing expands, products lacking compelling real-world evidence are likely to face deeper erosion, accelerating consolidation.
Generic Substitution Pressure
Generics supplied 80% of prescription volume but only 38% of value in 2024. Government targets call for 85% volume penetration by 2026, yet quality recalls of imported APIs temper uptake in critical-care categories. Biosimilars gained just 18% of the adalimumab market by year-end 2024, due to physician caution and a lack of interchangeability status. To overcome inertia, Nichi-Iko priced its rituximab biosimilar 30% below the reference biologic.
*Our forecasts treat driver/restraint impacts as directional, not additive. The impact forecasts reflect baseline growth, mix effects, and variable interactions.
Japan Pharmaceutical Market Segment Analysis
By Drug Type:
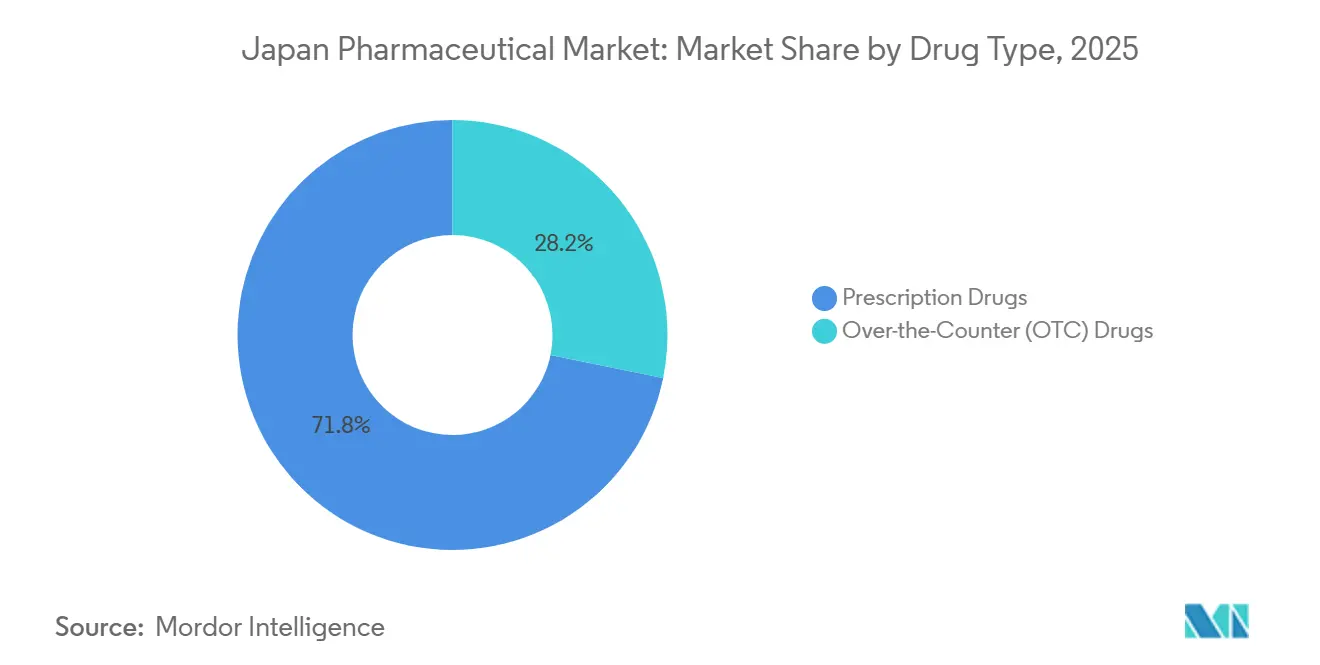
OTC Gains Amid Prescription DominancePrescription medicines accounted for 71.78% of 2025 revenue, yet the over-the-counter segment is expected to advance at a 3.93% CAGR, more than double the CAGR of the Japan pharmaceutical market. The switch of loxoprofen to OTC status in 2024 exemplifies policy efforts to migrate routine pain management from clinics to retail shelves. Self-medication trends among seniors lifted analgesic and gastrointestinal remedy volumes throughout 2025, while e-commerce platforms captured incremental share.
Margin pressure persists for branded prescriptions because biennial revisions tamp profitability. Still, specialty injectables for rheumatoid arthritis and multiple sclerosis remain insulated, sustaining Japan's pharmaceutical market share leadership in prescription lines. Consumer-health divisions invest in influencer-led digital campaigns to grow OTC supplements, reflecting divergent strategies within the same corporate groups.

By Therapeutic Area:
Oncology Leads Innovation PipelineOncology represented 18.73% of therapeutic-area revenue in 2025 and is expected to post a 4.19% CAGR through 2031, underscoring its status as the growth engine of the Japanese pharmaceutical market. Enhertu’s JPY 87 billion in domestic sales for fiscal 2024 demonstrates the speed at which innovative products penetrate once reimbursement is secured.
Conversely, cardiovascular drugs advance at only 0.8% CAGR as generics dominate statins and ACE inhibitors. Diabetes therapies experience volume growth but face scrutiny regarding cost-effectiveness. Central nervous system pipelines suffer from high attrition in dementia trials, while respiratory biologics show moderate momentum due to rising urban asthma prevalence. Oncology, therefore, captures investment and launch priority across multinational and domestic portfolios.
By Molecule Type:
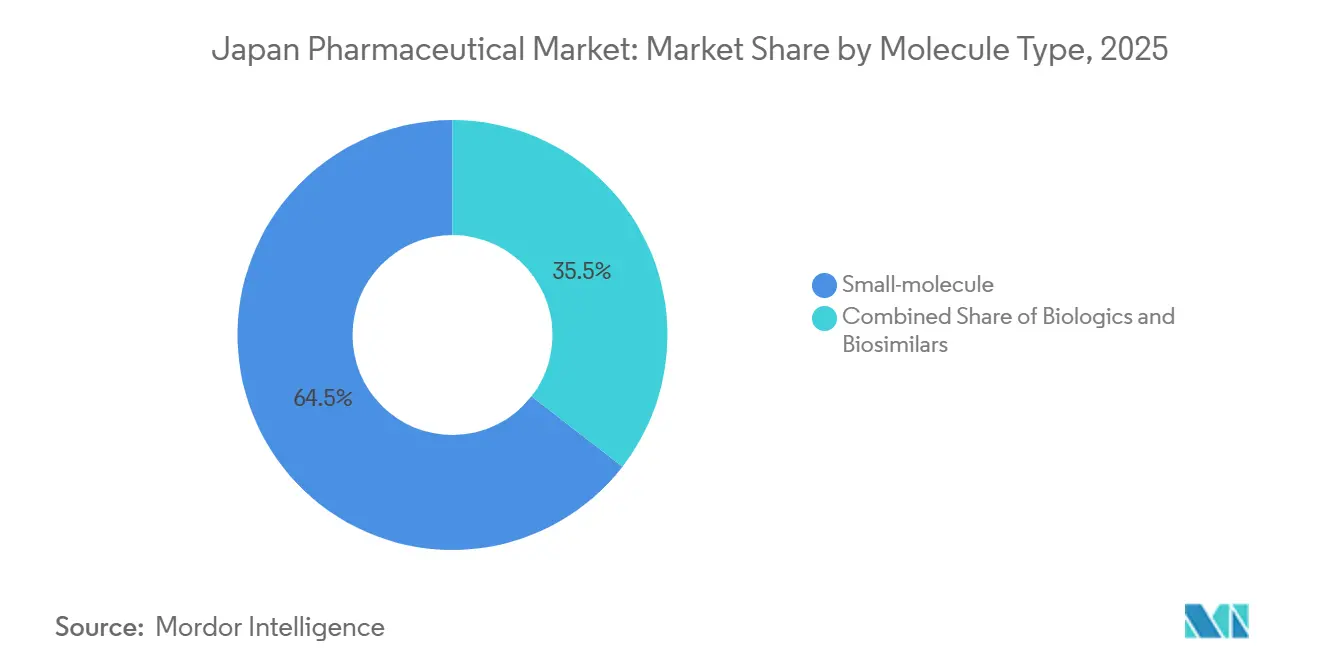
Biologics Ascend as Small Molecules PlateauSmall molecules maintained a 64.48% share of the Japanese pharmaceutical market in 2025. However, biologics are forecast to expand at a 4.97% CAGR to 2031, tripling the overall market pace. Hemlibra’s JPY 62 billion in sales for 2024 highlights the premium value of biologics.
Biosimilars, although nascent, temper biologic price inflation; however, the lack of interchangeability rulings hinders substitution. New investments, such as Fujifilm’s JPY 100 billion Chiba facility, indicate confidence in sustained demand for biologics. Small molecules face commoditization outside oncology, accelerating portfolio shifts toward complex injectables and hybrid conjugates.
By Formulation:
Injectables Gain on Device InnovationOral agents held a 55.26% share in 2025, yet injectables will grow at a 3.74% CAGR through 2031, buoyed by home-use auto-injectors. Long-acting psychotropic injections, typified by Abilify Maintena, improved adherence and reduced relapse hospitalizations in 2025, encouraging broader deployment across endocrinology and immunology portfolios.
Device partnerships, such as Ypsomed–Sumitomo’s reusable injector for GLP-1 agonists, extend lifecycle protection and enhance patient convenience. Topical and other niche formulations remain stable but contribute limited value growth.
By Distribution Channel:
Online Pharmacies Disrupt Traditional ModelsHospital pharmacies dispensed 51.84% of Japan's pharmaceutical market in 2025, reflecting their control of oncology and infusion therapies, yet online and mail-order outlets are expected to record a 4.51% CAGR, nearly triple the market average. Regulatory clearance for telehealth prescription fulfillment in 2024 enabled Amazon Pharmacy Japan and Rakuten to secure a combined 8% share of the retail prescription market by late 2025.
Brick-and-mortar chains respond by adding clinical services, but same-store volumes fell for leading retailers such as Ain Pharmacies. Hospital outlets remain indispensable for complex biologics, but some infusions are expected to shift to outpatient centers to lower inpatient costs.
Regulatory Landscape
Japan pharmaceutical regulation is led by the Ministry of Health, Labour and Welfare (MHLW) and the Pharmaceuticals and Medical Devices Agency (PMDA), with pricing and reimbursement administered through the National Health Insurance (NHI) framework. The April 2024 drug-price revision reduced reimbursement for 53% of listed drugs, with an average decrease of 4.8% for brand-name drugs and 7.2% for generic drugs, which continues to raise the bar for differentiated evidence packages and tighter lifecycle management.
A key policy milestone is the Pharmaceutical and Medical Devices (PMD) Act amendment enacted in May 2025, with major provisions entering into force in May 2026 to address drug supply shortages, drug loss/lag, and pharmaceutical quality assurance. In 2026, PMDA issued operational notices and application-form guidance supporting the revised framework, including updated rules for conditional approvals and marketing authorization documentation, while keeping the 12-month target for ordinary reviews (from application to approval) as a reference point.
Value Chain Analysis
Japan's pharmaceutical value chain covers API and excipient sourcing, finished-dose manufacturing, marketing authorization holders, wholesale distribution, and dispensing through hospitals and community or retail pharmacies, with online and mail-order channels expanding alongside telehealth-enabled prescription fulfillment. A persistent structural constraint is heavy reliance on imported critical APIs, while downstream distribution is concentrated among large wholesalers including Medipal, Suzuken, Toho Pharmaceutical, and Vital-Net. These wholesalers increasingly differentiate through cold-chain controls, warehouse management systems, and specialty-drug handling capabilities.
Supply stability is now treated as a formal operating requirement. The 2025 PMD Act amendment strengthens supply governance (including designated supply oversight roles and notification obligations around shipment suspensions) and gives MHLW authority to request cooperation across manufacturers, distributors, and medical institutions during shortages. In line with that, capacity and resilience moves are appearing across manufacturing and logistics, including Nipro completing a new vial-based injectable building at its Omi plant in Shiga (with emergency vaccine switch capability) and originator-generic collaborations such as Otsuka Pharmaceutical and Towa Pharmaceutical setting up a backup production arrangement for selected long-listed products.
Competitive Landscape
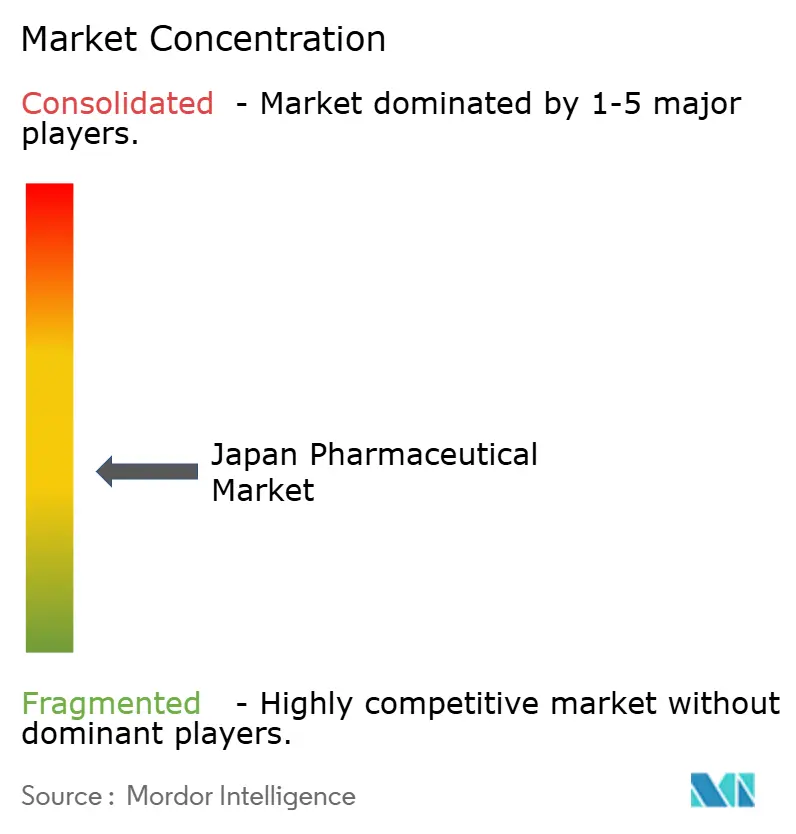
The five leading domestic companies, Takeda, Astellas, Daiichi Sankyo, Chugai, and Otsuka, captured higher 2025 revenue, indicating moderate concentration. Multinationals utilize the SAKIGAKE program to launch targeted biologics ahead of their domestic peers, thereby intensifying rivalry. Takeda, Astellas, and Daiichi Sankyo, together, still hold a formidable presence; however, off-patent erosion and generics price controls constrain margin expansion.
Generic producers remain fragmented; the top ten held a 54% volume share in 2025, but falling unit prices have induced merger talks between Sawai and Nichi-Iko to achieve a procurement scale. Technology investment now differentiates leaders: Daiichi Sankyo’s AI-assisted antibody-drug conjugate discovery cut preclinical timelines by 18 months, while Chugai’s PMDA-approved digital pathology platform slashed screening costs. PeptiDream monetized its peptide-discovery engine via 14 partner deals worth USD 340 million in 2025 alone, illustrating value capture without a marketed product.
White-space opportunities lie in prescription digital therapeutics, where CureApp’s first-in-class smoking-cessation software faces limited competition, and regenerative medicines, where stringent post-marketing demands deter smaller challengers but create moats for capitalized incumbents.
Japan Pharmaceutical Industry Leaders
-
Chugai Pharmaceutical Co., Ltd.
-
Astellas Pharma Inc.
-
Takeda Pharmaceutical Co. Ltd.
-
Otsuka Pharmaceutical Co., Ltd
-
Daiichi Sankyo Co. Ltd.
- *Disclaimer: Major Players sorted in no particular order
Japan Pharmaceutical Market Companies Covered in this Report
- Astellas Pharma
- AstraZeneca K.K.
- Chugai Pharmaceutical Co. Ltd.
- Daiichi Sankyo Co. Ltd.
- Eisai
- Kyowa Kirin Co. Ltd.
- Mitsubishi Tanabe Pharma Corp.
- MSD K.K. (Merck)
- Nichi-Iko Pharmaceutical Co. Ltd.
- Novartis Pharma K.K.
- Ono Pharmaceutical Co. Ltd.
- Otsuka
- Pfizer Japan Inc.
- Roche Diagnostics K.K.
- Sawai Pharmaceutical Co. Ltd.
- Shionogi & Co. Ltd.
- Sumitomo Pharma Co. Ltd.
- Takeda Pharmaceuticals
- Teijin Pharma Ltd.
Market Opportunities and Future Outlook
Investment and policy actions focused on supply resilience and advanced modalities create whitespace in high-value manufacturing, injectable capacity, and bio/CDMO services in Japan. In 2026, company actions point to concrete demand for local and regional production capability: Eli Lilly announced a JPY 20 billion expansion at its Seishin plant in Kobe to boost output for diabetes and obesity medicines, and AGC Biologics announced a USD 350 million Yokohama site to expand CDMO services spanning cell therapy, mammalian, and mRNA capabilities. Together, these initiatives connect with ongoing concerns around supply disruptions and import dependence, and they reinforce demand for partners supporting sterile fill-finish, cold-chain logistics, and tech transfer services.
On the demand side, premium segments are increasingly shaped by faster pathways and evidence expectations rather than volume alone. The PMD Act implementation in May 2026 and PMDA operational updates around conditional approvals and application requirements lift the value of regulatory-grade real-world evidence, pharmacovigilance systems, and companion-diagnostic integration for oncology and rare-disease products. Distribution modernization also remains a near-term opportunity, as telehealth-enabled prescription fulfillment already supports the growth of online and mail-order channels, encouraging manufacturers and wholesalers to build digitally integrated patient support and specialty fulfillment models for complex biologics and home-administered injectables.
Recent Industry Developments in Japan Pharmaceutical Market
- June 2026: Otsuka Pharmaceutical reported positive Phase 3b results for centanafadine in adults with ADHD comorbid with anxiety. The readout supports Otsuka's CNS pipeline positioning in Japan and underpins continued late-stage investment in differentiated, specialty therapies where clinical evidence can help defend value under tightening pricing dynamics.
- August 2025: Daiichi Sankyo and AstraZeneca secured PMDA approval for Enhertu in HER2-low breast cancer. The label expansion broadened the treatable population and reinforced antibody-drug conjugates as a centerpiece of oncology innovation and hospital-channel demand in Japan.
- August 2024: Japan Tobacco and Torii Pharmaceutical announced VTAMA Cream 1% (tapinarof) was listed on the NHI schedule for atopic dermatitis and plaque psoriasis under a licensing agreement with Dermavant Sciences. NHI listing enabled reimbursed access for a steroid-free topical option and highlighted continued room for differentiated dermatology products even amid routine price revisions.
Japan Pharmaceutical Market Report Scope and Research Methodology
Market Definition and Coverage
For this study, the market covers the value of human medicines sold in Japan, including prescription and over-the-counter drugs, measured at ex-factory prices and converted to USD using average annual exchange rates.
Scope exclusions: Veterinary medicines, medical devices, bulk APIs shipped for export, and Kampo traditional supplements are not counted.
Segments Covered in This Report
- By Drug Type
- Prescription Drugs
- Over-the-Counter (OTC) Drugs
- By Therapeutic Area
- Oncology
- Cardiovascular
- Anti-diabetic
- Central Nervous System
- Infectious Disease
- Respiratory
- Others
- By Molecule Type
- Small-molecule
- Biologics
- Biosimilars
- By Formulation
- Oral
- Injectable
- Topical
- Other Formulations
- By Distribution Channel
- Hospital Pharmacies
- Retail Pharmacies
- Online & Mail-Order Pharmacies
Data Sources, Market Sizing, and Validation
Desk Research
To build the core data backbone, we start by mapping Japan drug demand and supply signals that can be checked year after year. Public sources such as Japan's Ministry of Health, Labor and Welfare publications, the Pharmaceuticals and Medical Devices Agency updates, OECD health statistics, World Bank indicators, and IMF macro series help anchor population, utilization, and currency assumptions.
We then layer in company annual reports, investor decks, earnings call notes, and credible industry press coverage to understand product mix shifts, price revisions, and patent related events. For cross-checks on filings, drug approvals, and patenting intensity, selective paid subscriptions are used for company financials and patent databases, which helps keep the model consistent when disclosures vary. The desk sources cited are illustrative, and many additional public references are used to clarify data points and validate assumptions.
Primary Interviews and Surveys
Primary inputs come from structured conversations and short surveys with manufacturers, distributors, hospital and clinic procurement stakeholders, and pharmacy channel participants, so the pricing and volume logic reflects how drugs are actually sold in Japan. Because this is a single-country market, the focus stays on customer cohorts and product families rather than regional splits, and follow-ups are done when desk signals and interview feedback do not line up.
Distribution of primary research fieldwork respondents
| Company type | Respondent position |
|---|---|
| Top tier: 32% | CXOs: 13% |
| Mid tier: 53% | Functional/Unit leaders: 40% |
| Smaller Players: 15% | Managers: 47% |
Market-Sizing & Forecasting
Sizing begins with a top-down build that reconstructs Japan medicine sales using ex-factory value logic, then aligns it to demand-side signals that can be observed across years. Key inputs include prescription versus OTC mix, major reimbursement price revision cycles, new drug approvals and launch timing, generic share movement, and the therapy mix tilt toward high-value categories such as oncology and immunology.
Once the total is formed, we corroborate it with selective bottom-up approximations, such as sampled SKU level average price times volume checks, distributor channel checks, and partial roll-ups from disclosed company revenues, which are then adjusted for coverage gaps. Where company reporting is not clean, revenues are normalized to Japan-only exposure and to ex-factory pricing so the totals do not drift.
For forecasting, scenario analysis is used, supported by expert views on how price cuts, aging-driven demand, and innovation pace are likely to play out. Assumptions are kept transparent so that small changes in exchange rates, reimbursement price pressure, or launch cadence can be tested without rebuilding the full model.
Data Validation & Update Cycle
Outputs are validated through triangulation across independent signals, including public health spending trends, approval pipelines, and reported sales direction from listed participants. Large variances are flagged, traced back to the driver (price, volume, mix, or currency), and then reviewed again before final sign-off.
The report is refreshed annually, and interim updates are triggered when material events occur, such as policy changes that shift reimbursement pricing or major product launches that reshape mix. Before delivery, we do a final pass to confirm the latest public releases and expert feedback are reflected in the model.
Mordor Intelligence's Japan Pharmaceutical Market Size Measured Against Other Published Estimates
Published market sizes for Japan pharmaceuticals often do not match because the counted scope and pricing basis can be different, and sometimes currency timing is handled in a simpler way. It also varies whether the number reflects manufacturer-level value or the reimbursed price level, which can change the final total.
The biggest gap drivers in Japan usually come from whether estimates use ex-factory pricing versus reimbursement list pricing, and whether they include adjacent categories such as Kampo supplements or medical devices. Differences also show up when a source uses a fiscal-year drug list value, or when exchange rates are taken from a single point in time rather than an annual average, which can move a USD figure even if yen sales are stable.
Benchmark comparison
| Source | Market Size | Gaps in Research Methodology |
|---|---|---|
| Mordor Intelligence | USD 88.14 B (2025) | |
| Industry Institution A | USD 76.60 B (2024) | Often presented in yen and discussed at an industry overview level, then converted to USD with limited clarity on pricing basis and whether the figure is calendar-year demand or a blended reporting window. |
| Market Data Bulletin B | USD 79.10 B (2024) | Tracks prescription drug value on a reimbursement price basis for a fiscal period, which can diverge from manufacturer-level ex-factory valuation and creates timing differences versus calendar-year views. |
The table shows a noticeable spread that mostly comes from pricing basis and time window choices, and in Mordor Intelligence's model the number is tied to human prescription and OTC drugs at ex-factory prices with USD conversion based on the average annual exchange rate. With those steps stated clearly, users can trace the total back to repeatable drivers and then adjust assumptions when their internal planning uses a different pricing or period convention.
Key Questions Answered in the Report
How large will Japan’s pharmaceutical market be in 2031?
It is forecast to reach USD 96.78 billion by 2031 on a 1.57% CAGR.
Which therapeutic segment is expanding the fastest?
Oncology leads, supported by a 4.19% CAGR and growing use of antibody–drug conjugates.
What share do biologics hold and how quickly are they growing?
Biologics segment are projected to grow at a 4.97% CAGR through 2031.
How are online pharmacies changing drug distribution?
Regulatory changes in 2024 enabled telehealth prescription fulfilment, allowing online channels to grow at a 4.51% CAGR through 2031.
Why are specialty drugs prioritized by domestic firms?
Patent expiries and biennial price cuts erode margins on mass-market drugs, pushing companies toward high-value assets that earn launch premiums.
What is the key supply-chain risk facing manufacturers?
Over 80% of critical APIs are imported, exposing firms to geopolitical disruptions and quality-control issues.