
Market Overview
| Study Period | 2020 - 2031 |
|---|---|
| Forecast Data Period | 2026 - 2031 |
| Base Year Market Size (2025) | USD 4.35 Billion |
| Market Size (2026) | USD 4.57 Billion |
| Market Size (2031) | USD 5.87 Billion |
| Growth Rate (2026 - 2031) | 5.12% CAGR |
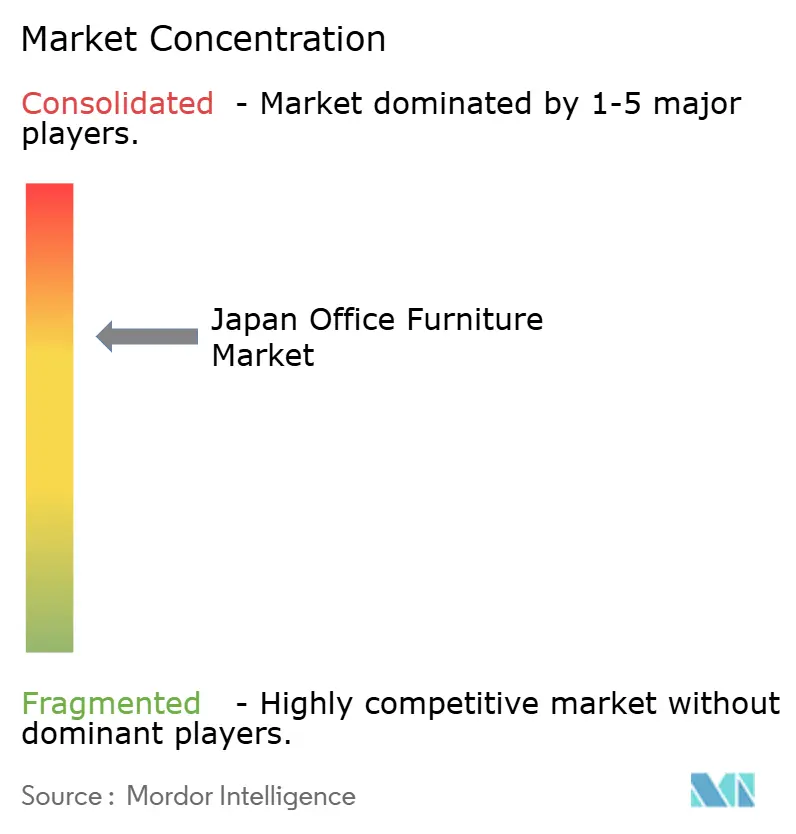
| Market Concentration | Medium |
Major Players *Disclaimer: Major Players sorted in no particular order Image © Mordor Intelligence. Reuse requires attribution under CC BY 4.0. | |
Japan Office Furniture Market Analysis by Mordor Intelligence
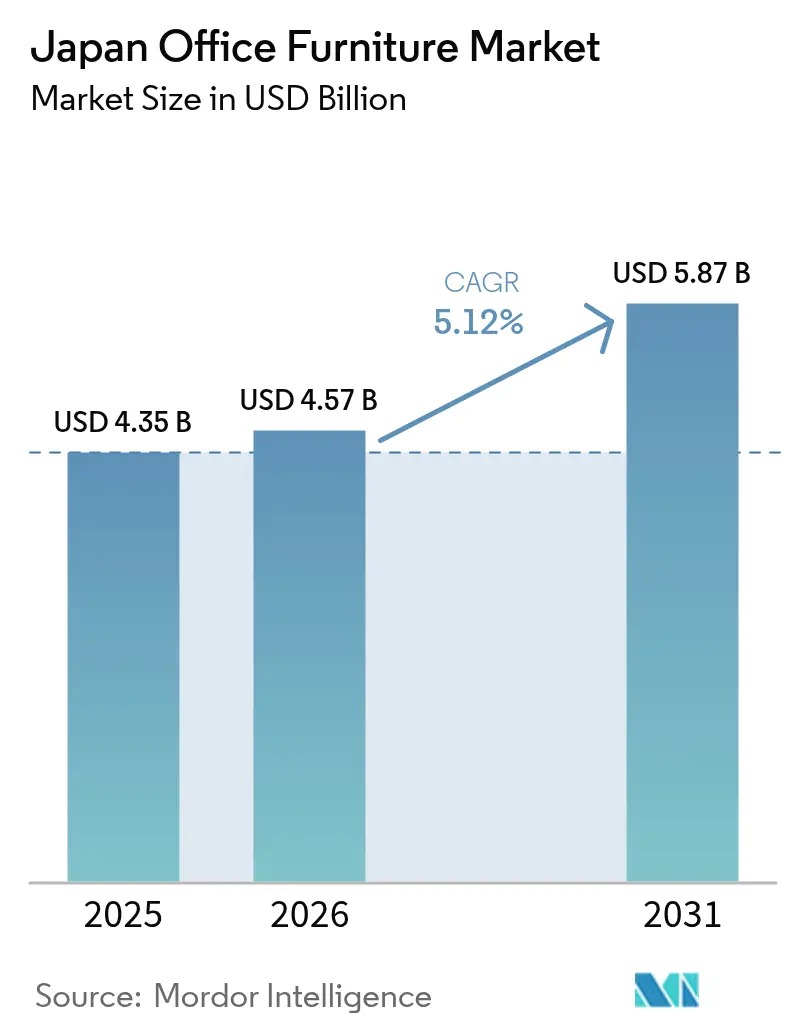
Japan Office Furniture Market size in 2026 is estimated at USD 4.57 billion, growing from 2025 value of USD 4.35 billion with 2031 projections showing USD 5.87 billion, growing at 5.12% CAGR over 2026-2031.
Hybrid work models, government telework incentives, and activity-based working (ABW) layouts are reshaping purchasing criteria toward flexible, technology-enabled furnishings that improve well-being and space efficiency. Renovation cycles that were deferred during the pandemic have restarted as corporate balance sheets stabilize and as landlords compete through premium amenity upgrades. Kanto’s dominance anchors national demand, yet rapid growth in Kyushu–Okinawa signals geographic diversification of corporate expansions. High market concentration enables incumbents to scale R&D on sensor-fitted furniture, though it also limits price competition for mid-sized buyers.
Key Report Takeaways
By material, wood captured 54.34% of Japan office furniture market share in 2024, while plastics is projected to expand at a 7.87% CAGR through 2030.
By product, desks held 26.26% of the Japan office furniture market size in 2024, and smart desks are growing at a 9.76% CAGR to 2030.
By distribution channel, multi-branded stores commanded 40.85% share of the Japan office furniture market size in 2024, but online platforms recorded the fastest growth at 12.76% CAGR.
By geography, Kanto led with 49.34% Japan office furniture market share in 2024, whereas Kyushu–Okinawa is advancing at a 6.33% CAGR.
Note: Market size and forecast figures in this report are generated using Mordor Intelligence’s proprietary estimation framework, updated with the latest available data and insights as of 2026.
Japan Office Furniture Market Trends and Insights
Drivers Impact Analysis*
| Driver | (~) % Impact on CAGR Forecast | Geographic Relevance | Impact Timeline |
|---|---|---|---|
| Renovation cycles rebound post-COVID | +1.2% | Tokyo, Osaka, Nagoya | Medium term (2-4 years) |
| Corporate shift to ABW layouts | +1.5% | Major metros, regional roll-out | Long term (≥4 years) |
| Telework-linked tax incentives | +0.8% | Nationwide, urban uptake | Short term (≤2 years) |
| Ergonomic health regulations | +0.6% | Nationwide | Medium term (2-4 years) |
| Export lift for reused furniture | +0.4% | Asia-Pacific routes | Long term (≥4 years) |
| AI-based space analytics | +0.8% | Tech hubs, national spread | Long term (≥4 years) |
| Source: Mordor Intelligence | |||
Stagnant GDP-linked renovation cycles rebounding post-COVID
The stabilization of GDP in 2024 facilitated the release of capital budgets that had been restricted during the pandemic. This development allowed property owners and tenants to address deferred investments in workspace enhancements, reflecting a renewed focus on improving operational efficiency and meeting evolving workplace demands. Flexible desks, acoustic pods, and IoT-ready seating form the core of these upgrade packages, rewarding suppliers that bundle traditional craftsmanship with embedded connectivity. Fiscal-year 2025 budgets earmark larger allocations for workplace modernization, accelerating order volumes for modular fittings that cut installation time. Compliance with newer MHLW safety guidelines further shortens furniture life cycles within large corporates.
Corporate demand for activity-based working (ABW) layouts
Large enterprises are abandoning fixed seating in favour of zones dedicated to focus, collaboration, and relaxation, a shift proven to lift creative performance in peer-reviewed studies. Modular tables, lightweight partitions, and locker-based storage allow rapid reconfiguration as teams fluctuate between onsite and remote. Employee satisfaction surveys show 90% approval rates for ABW workstyles, enabling procurement teams to justify premium prices for specialized furniture. Manufacturers respond with quick-lock casters, stackable power rails, and upholstery options that dampen open-office noise without sacrificing visual openness. As hybrid attendance patterns normalize, ABW’s emphasis on spatial adaptability positions it as a long-run growth engine for the Japan office furniture market.
Government tax incentives for telework-supportive furniture
Since 2024, companies can deduct up to 100% of qualifying furniture that facilitates hybrid work. Height-adjustable desks, ergonomic chairs, and integrated charging hubs dominate corporate wish lists because tax treatment sharply improves their total cost of ownership. SMEs, which account for 99.7% of Japanese firms, are particularly sensitive to these savings and have shortened replacement cycles from seven to four years. Procurement teams track productivity metrics to validate incentive claims, thereby boosting demand for sensor-equipped models that generate usage data. The policy dovetails with national digital-transformation goals and channels steady orders toward domestic OEMs with certified telework lines.
Ergonomic-related occupational-health regulations
Revised MHLW rules require companies with more than 50 employees to provide lumbar-support seating and adjustable desks, or face fines that exceed the cost of compliance[1]Ministry of Health, Labour and Welfare, “Telework Model Regulations,” mhlw.go.jp . Technology and finance tenants, where screen-time intensity is highest, represent the early adopters, replacing chairs and task lighting ahead of inspection deadlines. International brands tailor catalogues to Japanese Industrial Standards, while local firms leverage cultural insights on sitting postures to refine cushion angles and breathable fabrics. Compliance software now checkpoints furniture specifications during lease renewals, guaranteeing recurring demand for certified models. Ergonomic mandates thus create a protective revenue stream within the Japan office furniture market.
Restraints Impact Analysis*
| Restraint | (~) % Impact on CAGR Forecast | Geographic Relevance | Impact Timeline |
|---|---|---|---|
| Shrinking white-collar workforce | −1.8% | Nationwide, rural severity | Long term (≥4 years) |
| High urban rents temper refurbishments | −1.1% | Tokyo, Osaka | Medium term (2-4 years) |
| Engineered-wood cost volatility | −0.7% | Nationwide | Short term (≤2 years) |
| Slow IoT protocol standardization | −0.5% | Early adopters | Medium term (2-4 years) |
| Source: Mordor Intelligence | |||
Declining white-collar workforce due to aging demographics
Japan’s working-age population continues to contract as retirements outpace new entrants, trimming aggregate desk demand[2]Ministry of Internal Affairs and Communications, “Workforce Demographics,” soumu.go.jp . Leading corporations are strategically reducing their office footprints, as evidenced by the adoption of desk-sharing models and the downsizing of headquarters. This shift is particularly evident in manufacturing-centric regions, where corporate consolidations have resulted in an increased availability of office space. In urban centres, the inflow of foreign labour has mitigated some of the impacts of these changes; however, suburban suppliers are experiencing a decline in order volumes due to reduced demand. The hybrid work model has partially supported the furniture market by driving higher ergonomic standards for home offices. Nevertheless, the overall growth in furniture unit sales is projected to decelerate over the long term, reflecting a broader adjustment in market dynamics.
High urban rents are limiting large office refurbishments
Tokyo's Grade A office rents have reached an unprecedented level of JPY 37,012 (USD 252) per m², significantly impacting budget allocations for interior renovations. Small and medium-sized enterprises (SMEs) are deferring comprehensive floor refurbishments, instead opting for cost-effective alternatives such as upholstery and hardware refreshes, which are less expensive than new installations. Rising vacancy rates in secondary locations are prompting businesses to prioritize capital investment in retaining these spaces over furniture upgrades. Corporations are increasingly implementing "space-compression" strategies, including the adoption of benching systems and fold-away tables, to optimize functionality within constrained office areas. Suppliers specializing in multi-purpose furniture designs are gaining market share; however, overall revenue growth in the sector remains subdued, constrained by persistent rental inflation. A recovery in growth is anticipated only when rental pressures begin to ease.
*Our forecasts treat driver/restraint impacts as directional, not additive. The impact forecasts reflect baseline growth, mix effects, and variable interactions.
Segment Analysis
By Material: Wood Dominance Faces Sustainability Pressures
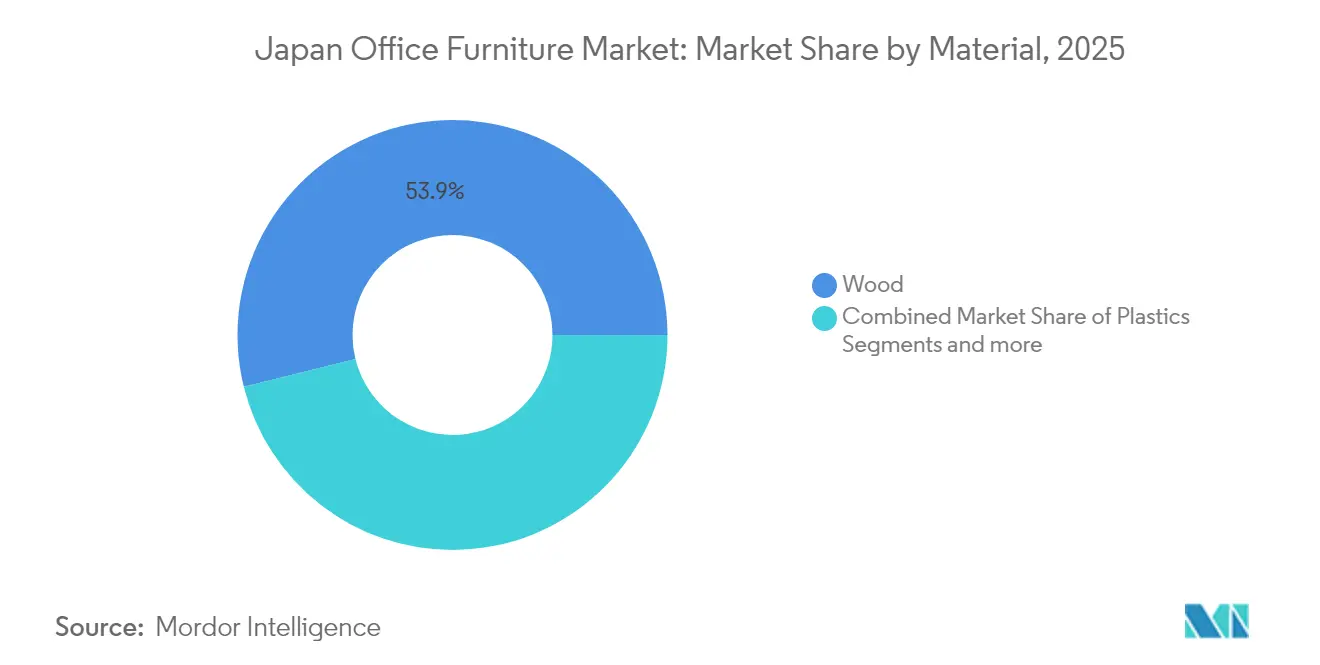
Wood retained 53.86% Japan office furniture market share in 2025, sustained by cultural affinity for natural aesthetics and traditional joinery. Import dependence, however, exposes costs to global timber volatility, pushing buyers to experiment with recycled and bio-based composites that lower carbon footprints. Plastics segment accelerates at 7.74% CAGR, fuelled by advances in post-consumer resin blends that satisfy ESG audits without sacrificing structural integrity. Metal frames remain indispensable for sit-stand desks where durability and motorized actuation require steel or aluminium substructures.
Plastics’ growth also stems from their compatibility with embedded sensors, because moulded cavities simplify housing for IoT modules. Domestic OEMs trial biomass-derived polypropylene while international brands test ocean-bound plastics for chair shells aimed at environmentally sensitive procurement teams. Meanwhile, wood suppliers pursue chain-of-custody certification to preserve their premium positioning. Pilot projects using domestic cedar have raised utilization rates marginally above 40%, yet volume scale-up awaits mechanized drying and lamination upgrades in rural mills. Against this backdrop, circular models such as Kokuyo–ChopValue’s chopstick-based panels hint at a hybrid future where waste streams supply next-generation wood composites.


By Product: Smart Desks Revolutionize Traditional Categories
Desks led with 25.98% share of the Japan office furniture market size in 2025, underpinned by enterprise spending on height-adjustable models that mitigate sedentary health risks. Smart desks grow 9.58% CAGR, integrating wireless chargers, posture alerts, and ambient-light sensors that feed workplace analytics dashboards. Seating innovations are keeping pace with Kokuyo’s “ingCloud” chair auto-calibrates via a 3D Ultra Auto Fit mechanism and transmits anonymized usage data for predictive maintenance.
Category crossover blurs lines between tables and storage as modular pods combine power trunks, whiteboard surfaces, and lockable compartments. Lounge furniture adopts acoustic fabrics that double as sound panels, supporting video-conference clarity in hybrid meeting zones. Swivel chairs integrate dual lumbar supports tailored to Japanese anthropometrics, a feature co-developed by Officecom and SIHOO. Large corporates increasingly quantify ROI through reduced sick days and elevated employee-engagement scores, validating premium expenditures on sensor-rich models.
By Distribution Channel: Digital Transformation Accelerates Online Growth
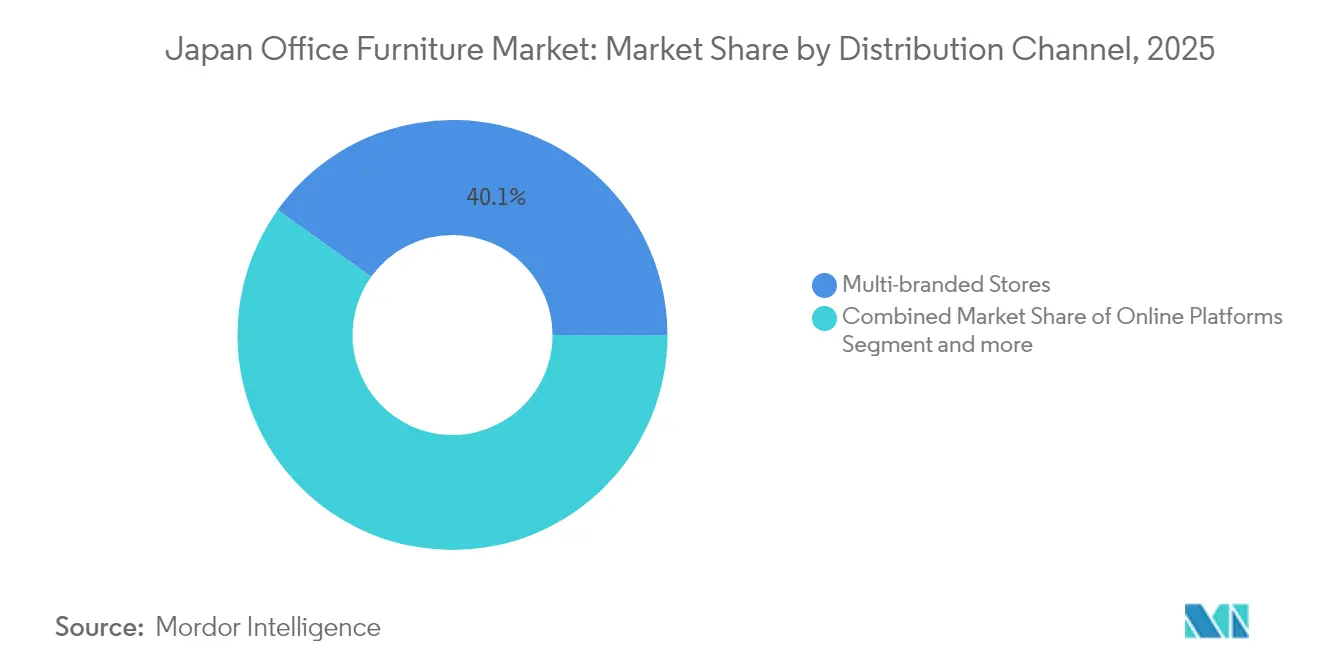
Multi-branded showrooms held a 40.12% share in 2025 because tactile evaluation remains essential for high-involvement purchases. Nonetheless, online platforms surge 12.43% CAGR as 3D configurators, augmented reality (AR) placement tools, and procurement-workflow APIs shrink buyer friction. Corporates now shortlists products virtually, then dispatches facility managers to in-store “experience centres” for final verification. Specialty stores retain relevance by curating ergonomic or design-icon ranges not widely available elsewhere, while leasing programs align with circular-economy objectives by bundling maintenance and take-back services.
E-commerce operators invest in AI chatbots that parse building layouts to recommend SKU bundles, effectively serving as digital specifiers. Integration with enterprise resource planning (ERP) systems speeds bulk orders, cutting purchase-order cycles from weeks to days. Yet last-mile delivery for fully assembled items still requires local logistics, leading to omnichannel alliances between pure-play online retailers and regional warehouse networks. The outcome is a hybrid landscape where digital discovery and physical fulfilment coexist, each amplifying the other.
Geography Analysis
Kanto sustained 48.88% Japan office furniture market share in 2025 on the strength of Tokyo’s concentration of headquarters, ministries, and global finance. Grade A rent escalation reinforces demand for high-value, space-efficient solutions such as compact sit-stand stations and modular collaboration hubs. Kansai’s steady inflows from Osaka finance and Kobe tech parks support replacement cycles centred on ergonomic upgrades rather than full renovations.
Kyushu–Okinawa posts the fastest 6.21% CAGR to 2031, propelled by Fukuoka’s push to attract start-ups through favourable office-conversion grants that stipulate modern, flexible interiors. Chubu benefits from automotive R&D clusters that favour specialized drafting benches and vibration-isolated worktables. Tohoku and Hokkaido capture modest growth as regional revitalization policies encourage satellite offices in lower-cost cities, stimulating purchases of modular kits that can traverse narrow stairwells common in older buildings. Chugoku–Shikoku sees incremental gains linked to logistics and shipbuilding firms upgrading control rooms with integrated consoles. Nationwide, furniture suppliers establish decentralized service depots to shorten installation times and meet the service-level agreements demanded by corporate customers executing multi-site rollouts. Geography thus shapes logistics strategy as much as demand, reinforcing the need for agile distribution footprints.
Regulatory Landscape
Japan office furniture suppliers operate within a standards-led environment shaped by government procurement rules and product-safety and labeling obligations. The Ministry of the Environment administers Green Purchasing Law guidance that sets criteria for office furniture supplied into public procurement, emphasizing material selection and environmental attributes such as durability and reparability. On product specifications, Japanese Industrial Standards are widely referenced in B2B tenders, including JIS S 1031:2016 for office desks and tables and JIS S 1043:2016 for height-adjustable swivel chairs, anchoring baseline performance, safety, and usability requirements.
Beyond standards, industry and enforcement bodies influence compliance pathways. The Japan Office and Institutional Furniture Association (JOIFA) publishes product safety guidelines covering key office categories (desks, chairs, storage, partitions), which many manufacturers use to align testing and documentation. The Consumer Affairs Agency oversees the Household Goods Quality Labeling Act for consumer protection through labeling, while the Ministry of Economy, Trade and Industry (METI) enforces the Consumer Product Safety Act for applicable items, reinforcing traceability and conformance as procurement increasingly scrutinizes safety and ESG documentation.
Value Chain Analysis
The Japan office furniture value chain runs from upstream materials and components (timber and engineered wood, metals for frames and mechanisms, plastics and foams, upholstery textiles, and electronics for sensor-enabled products) through design and engineering, manufacturing/assembly, and downstream distribution and installation. Domestic leaders combine in-house product development with external sourcing for motors, sensors, and connectivity modules used in sit-stand and smart desks, and they increasingly attach workspace planning and fit-out services to furniture projects. Recent partner-led moves illustrate this shift toward solutions: KOKUYO formed a global business alliance with Senba (effective July 1, 2025) to pair furniture with construction and design capabilities for office space delivery.
Downstream, multi-branded stores and specialty dealers remain important for specification and tactile evaluation, while online platforms extend reach via configuration and workflow tools, and larger project business depends on installers and facility services. Logistics and last-mile handling (assembled, bulky items) are a key constraint, pushing the ecosystem toward shared warehousing and delivery optimization; for example, Home Eco Logistics (a Sumitomo Forestry subsidiary) expanded its JUCORE logistics service to the Kansai (Keihanshin) region in August 2025 to improve building-material delivery amid labor shortages. Sustainability requirements under green procurement and association guidance also influence material traceability and end-of-life programs, encouraging use of certified timber and circular take-back or refurbishment options.
Competitive Landscape
The top-five players controlled a significant share of 2024 revenue, giving the Japan office furniture market a pronounced oligopolistic profile. Kokuyo, Okamura, and Itoki lead with full-stack offerings that span design consulting, manufacturing, and after-sales services, leveraging vertical integration to accelerate product refresh cycles. Kokuyo is allocating a significant portion of its revenue toward research and development, focusing on advancements in IoT sensors, the integration of recycled materials, and the development of software dashboards. These initiatives aim to transform traditional furniture offerings into comprehensive service platforms, aligning with the company's strategic innovation objectives.
International entrants such as Herman Miller localize flagship lines through partnerships with Japanese distributors, often adding compact footprints and seismic-resistant features to suit domestic building codes. Chinese brand SIHOO co-develops ergonomic chairs with Officecom, signalling cross-border collaboration around price-competitive innovation. Disruptive start-ups target circular economy niches, offering subscription models that bundle maintenance and refurbishment, which appeal to CSR-minded corporates.
Private-equity interest in the broader workspace ecosystem is rising, illustrated by EQT’s USD 2.7 billion acquisition of elevator supplier Fujitec, a move that underscores confidence in Japan’s office-infrastructure outlook. Consolidation abroad also reverberates locally as HNI’s planned USD 2.2 billion buyout of Steelcase may spawn a larger global rival capable of contesting domestic incumbents on project tenders[4]AInvest, “HNI to Buy Steelcase,” ainvest.com .
Japan Office Furniture Industry Leaders
Kokuyo Co., Ltd.
Itoki Corporation
Okamura Corporation
Plus Corporation
Uchida Yoko Co., Ltd.
- *Disclaimer: Major Players sorted in no particular order

Market Opportunities and Future Outlook
Government programs that subsidize telework and workplace upgrading create a clear commercialization lane for ergonomic, adjustable, and hybrid-ready furniture bundles, particularly among SMEs that respond strongly to reduced effective purchase costs. A concrete policy catalyst came in April 2024 when the Ministry of Health, Labour and Welfare (MHLW) increased the subsidy rate for equipment installation under its Telework Course from 30% to 50%, supporting investments in work-environment improvements and accelerating demand for compliant seating, height-adjustable desks, and related accessories that meet procurement documentation requirements.
A second opportunity area is the shift from selling furniture as stand-alone SKUs to delivering integrated workplace systems that combine modular hardware with software for wayfinding, room/desk utilization, and space analytics. Itoki started selling Appspace in August 2025 to centralize signage, visitor reception, and floor guides for hybrid offices, reflecting buyer pull for managed workplace platforms alongside physical fit-outs. In June 2026, Itoki announced development of Itoki Office Devices, linking furniture sensors with AI agents to provide real-time utilization and productivity analytics, expanding the addressable scope for suppliers that can package sensor-ready furniture, data services, and installation/maintenance into one proposal for ABW renovations and multi-site rollouts.
Recent Industry Developments
- July 2026: Kokuyo announced participation in ARCHIDEX 2026 in Kuala Lumpur, showcasing the Any Way furniture series and the ingCloud chair under an agile work-styles theme. The move extends Kokuyo's office solutions visibility in Asia and supports cross-border project and distributor conversations beyond the domestic replacement cycle.
- June 2026: Kokuyo announced a major upgrade to its ingCloud desk and chair sensing platform, enabling real-time utilization analytics for ABW projects.
- February 2026: Kokuyo expanded availability of the EZ mesh office chair through its global brand Lamex to additional markets, broadening the mid-to-premium seating range for hybrid work environments.


Research Methodology Framework and Report Scope
Market Definition and Coverage
This market covers the value of office furniture sold in Japan for commercial workspaces, including core items such as seating, desks, tables, and storage units, across offline and online channels.
Scope exclusions: This sizing excludes furniture mainly bought for residential use and non-furniture office fit-out items such as lighting, flooring, and interior construction services.
Segmentation Overview
- By Material
- Wood
- Metal
- Plastics
- Other Materials
- By Product
- Meeting Chairs
- Lounge Chairs
- Swivel Chairs
- Office Tables
- Storage Cabinets
- Desks
- By Distribution Channel
- Multi-branded Stores
- Specialty Stores
- Online Platforms
- Other Distribution Channels
- By Geography
- Kanto
- Kansai
- Chubu
- Kyushu–Okinawa
- Tohoku
- Hokkaido
- Chugoku–Shikoku
Data Sources, Market Sizing, and Validation
Desk Research
Desk research was used to set market boundaries and to ground the model in Japan-specific demand and supply signals. Public sources such as Japan's Ministry of Economy, Trade and Industry (METI) and the Statistics Bureau of Japan were reviewed for manufacturing and business activity indicators, and Japan Customs trade statistics were used to sense-check import and export movements tied to relevant furniture categories.
To translate these signals into a usable market model, industry context was pulled from sources such as the Japan Furniture Industry Association, standards and procurement notes from public agencies, and peer-reviewed papers that discuss workplace ergonomics and office design adoption. We also reviewed company filings, investor presentations, and reputable business press to map channel shifts and product mix changes. Where public time series were too broad, directionality was validated using paid subscriptions for company financials and a shipment-level import and export database. These sources are illustrative, and other references were also used for data collection, validation, and clarification during the research process.
Primary Interviews and Surveys
Primary work focused on interviews and short surveys with manufacturers, distributors, multi-brand retailers, online sellers, office space planners, and large buyers who manage corporate procurement. Since the scope is Japan-only, respondent inputs were checked across key business hubs so that pricing, replacement cycles, and channel splits could be corrected when desk research was not fully aligned.
Distribution of primary research fieldwork respondents
| Company type | Respondent position | Region |
|---|---|---|
| Top tier: 35% | CXOs: 14% | |
| Mid tier: 49% | Functional/Unit leaders: 41% | |
| Smaller Players: 16% | Managers: 45% |
Market-Sizing & Forecasting
Sizing starts with a top-down build where macro and sector indicators are converted into an addressable spending pool for office furniture in Japan, then filtered by what is actually purchased through furniture channels. The model is subsequently corroborated using selective bottom-up checks, such as rolling up sampled supplier revenues, channel checks with distributors and retailers, and ASP times unit-volume approximations for common items like chairs, desks, and storage.
Inputs that mattered most included new office fit-out activity, office occupancy and relocation intensity, renovation and replacement cycles, average selling price movement by product type, and the share shift between contract sales and online-led retail purchases. When key data points were missing for smaller private participants, gaps were handled through conservative ratio-based assumptions tied to channel size and observable footprint, and then corrected through interview feedback. Forecasts are built using scenario analysis supported by expert views on workplace policy (hybrid versus office-forward), commercial real estate activity, and expected pricing trends for wood, metal, and plastics, which together shape volume and value growth over time.
Data Validation & Update Cycle
Model outputs are cross-checked against independent signals, such as trade direction, category-level production trends, and reported performance commentary from major market participants. Where variances appear unusually high, assumptions are reopened, outliers are reviewed, and targeted follow-ups are triggered with interviewees to confirm whether the change is real or a data artifact.
Before sign-off, the analysis goes through multiple internal review steps so that scope logic, math, and unit consistency are aligned across years. Reports are refreshed annually, and interim updates are made when material events occur, such as sharp input-cost swings or large channel disruptions. Right before delivery, a final refresh pass is completed so clients receive the most current view available at the time.
Mordor Intelligence's Japan Office Furniture Market Size Versus Other Published Estimates
It is normal to see different market size figures published for Japan office furniture, even when the same end label is used. The differences usually come from what is counted as office furniture, how channels are treated, and whether the value is built from a demand pool or from a narrower set of reported revenues.
In Japan, the biggest spread is typically created when some estimates keep the scope close to a limited tracked set of product lines or cities, and then apply a cautious pricing curve, while others include a broader office fit-out replacement cycle across the full country and normalize currency timing differently.
Benchmark comparison
| Source | Market Size | Gaps in Research Methodology |
|---|---|---|
| Mordor Intelligence | USD 4.35 B (2025) | |
| Global Consultancy A | USD 3.43 B (2023) | Uses an earlier base year and can understate recent channel rebalancing, especially where online and multi-brand retail gained share, which reduces the carried-forward value into later years. |
| Trade Media B | USD 1.18 B (2024) | Often reflects a narrower tracked universe and may exclude parts of the contract and refurbishment demand, so the number skews toward a smaller demand pool rather than total office furniture spending. |
The table shows that scope width, timing, and pricing logic are practical reasons for the drift in published figures, and those choices can move the total by billions of dollars. By treating Japan-wide replacement demand and channel coverage as required inputs before forecasting, and then validating with trade and interview checks, the resulting total is less likely to miss large purchase routes. This is consistent with the approach applied here by Mordor Intelligence.


Key Questions Answered in the Report
What is the projected value of the Japan office furniture market by 2031?
Forecasts place the market at USD 5.87 billion by 2031.
Which material segment is growing fastest in Japan’s office furniture sector?
Plastics lead with a 7.74% CAGR, driven by recycled and sensor-friendly resins.
How fast are online sales channels expanding?
Online platforms are advancing at a 12.43% CAGR through 2031.
Which region shows the highest growth rate?
Kyushu–Okinawa registers the fastest 6.21% CAGR to 2031.
Why are smart desks gaining traction?
They integrate sensors and height-adjustment features that enhance ergonomics and supply space-utilization data, supporting hybrid work strategies.
Which companies dominate the Japan office furniture sector?
Kokuyo, Okamura, Itoki, Plus and Kurogane together controlled a significant share of 2024 sales, giving them outsized influence over pricing and product innovation.
Page last updated on:






