
Market Overview
| Study Period | 2020 - 2031 |
|---|---|
| Forecast Data Period | 2026 - 2031 |
| Base Year Market Size (2025) | USD 56.01 Billion |
| Market Size (2026) | USD 57.94 Billion |
| Market Size (2031) | USD 68.61 Billion |
| Growth Rate (2026 - 2031) | 3.44 % |
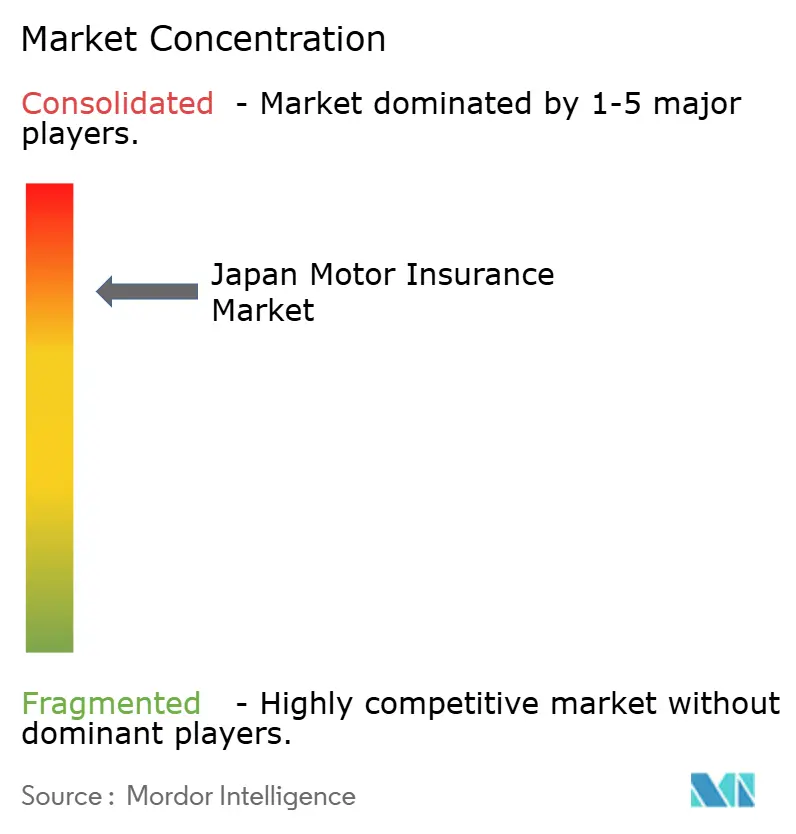
| Market Concentration | High |
Major Players *Disclaimer: Major Players sorted in no particular order Image © Mordor Intelligence. Reuse requires attribution under CC BY 4.0. | |
Japan Motor Insurance Market Analysis by Mordor Intelligence
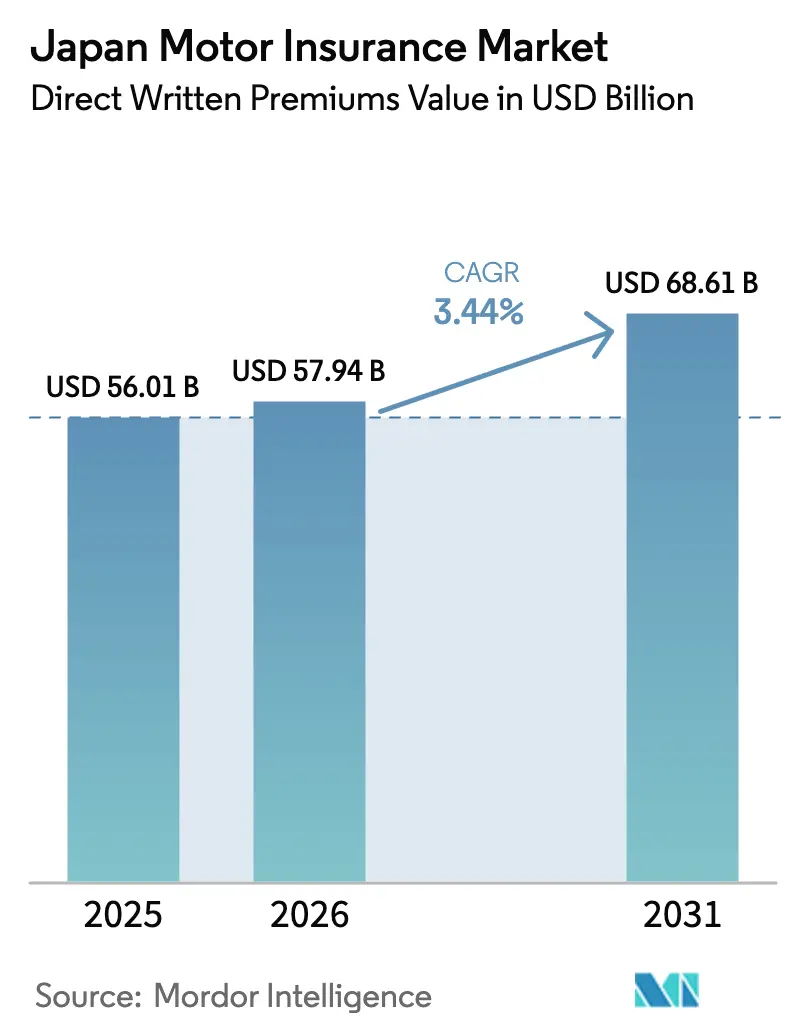
The Japan Motor Insurance Market size in terms of direct written premiums value is expected to grow from USD 56.01 billion in 2025 to USD 57.94 billion in 2026 and is forecast to reach USD 68.61 billion by 2031 at 3.44% CAGR over 2026-2031.
The growth path reflects a shift from volume expansion toward value optimization as aging demographics and stable vehicle usage temper policy growth while rising vehicle complexity and climate exposures raise insured values and loss costs. Insurers are leaning into pricing discipline, product redesign, and telematics as accident frequency remains low but claim severity climbs with ADAS and electrification. Distribution change is underway as the Financial Services Agency pushes greater transparency and agent conduct standards, which raises price competition and accelerates direct and embedded channels. The competitive core remains stable, yet operational reforms and digital capabilities weigh more heavily on economics than sales volume, which keeps profitability improvements tied to underwriting precision rather than customer acquisition.
Key Report Takeaways
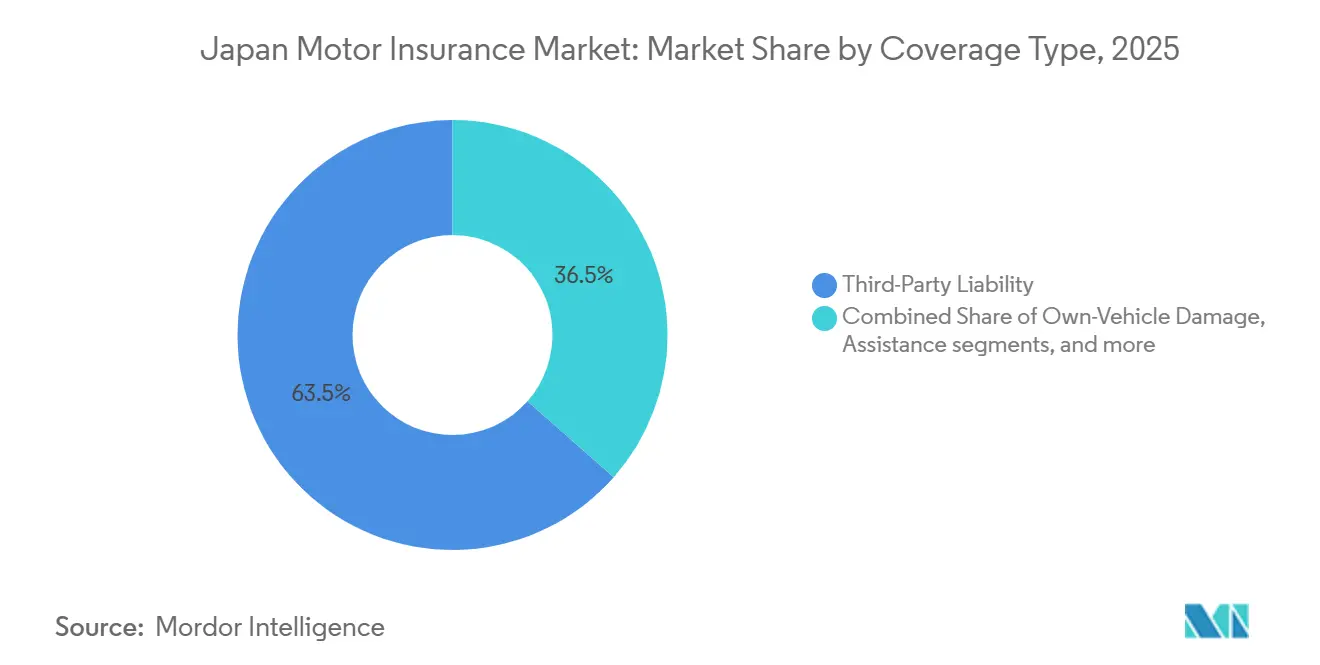
- By coverage type, third-party liability led with 63.5% of Japan's motor insurance market share in 2025, while own-vehicle damage coverage is set to expand at a 6.8% CAGR through 2031.
- By vehicle type, passenger cars accounted for 56.8% of premiums in 2025 in the Japan motor insurance market, while commercial vehicles are projected to record the fastest growth at a 5.4% CAGR through 2031.
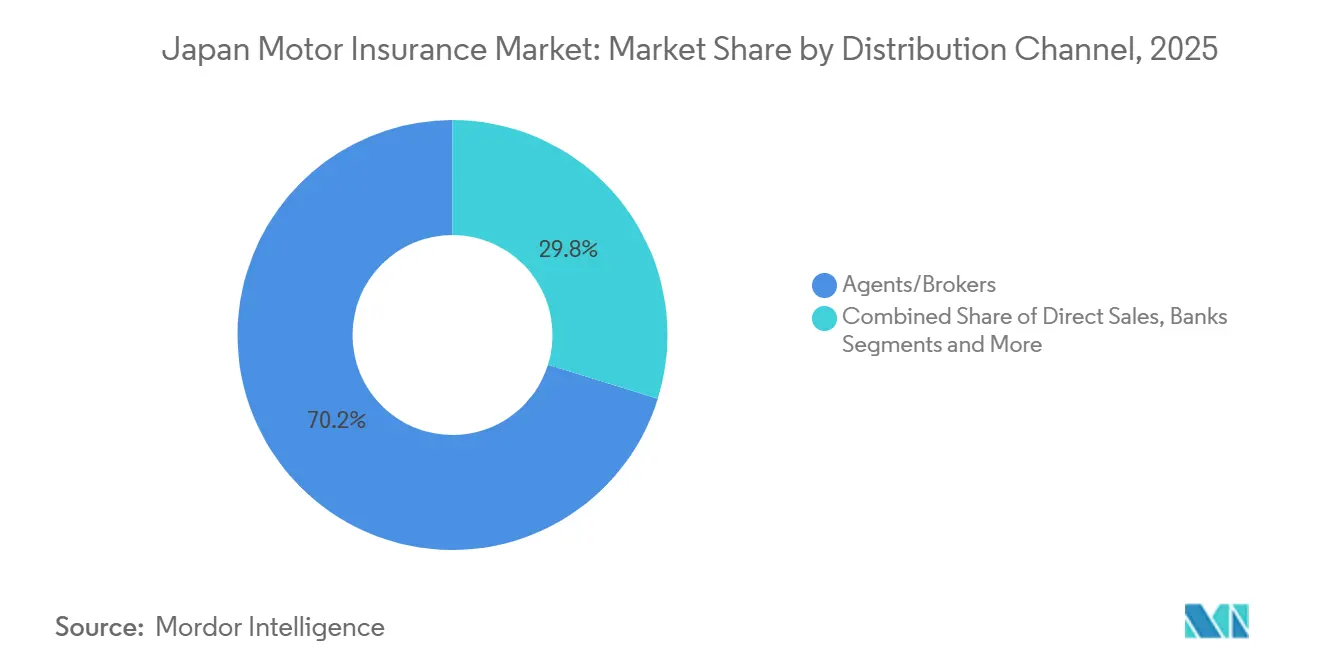
- By distribution channel, agents and brokers held 70.2% share in 2025 in the Japan motor insurance market, while digital platforms and other emerging channels are forecast to grow at a 6.54% CAGR through 2031.
- By powertrain, ICE vehicles represented 58.7% of premiums in 2025 in the Japan motor insurance market, while EV premiums are expected to grow at a 4.6% CAGR through 2031.
Note: Market size and forecast figures in this report are generated using Mordor Intelligence’s proprietary estimation framework, updated with the latest available data and insights as of January 2026.
Japan Motor Insurance Market Trends and Insights
Drivers Impact Analysis*
| Driver | (~) % Impact on CAGR Forecast | Geographic Relevance | Impact Timeline |
|---|---|---|---|
| Passenger cars in use sustain CALI demand | +0.7% | National, concentrated in Tokyo (134 fatalities), Kanagawa (139), and Hokkaido (129) | Long term (≥ 4 years) |
| Gradual rise in vehicle kilometers traveled | +0.5% | National, with the urban-rural divide as metropolitan areas recover faster | Medium term (2-4 years) |
| ADAS and drive recorders are incentivized by regulation | +1.2% | National, with FSA and MLIT coordinating across prefectures | Medium term (2-4 years) |
| Mandatory third-party liability amid tourism recovery | +0.6% | National, with spillover to tourist-heavy regions (Kyoto, Osaka, Okinawa) | Short term (≤ 2 years) |
| Spread of electric and hybrid vehicles | +0.9% | Core adoption in Tokyo, Kanagawa, Aichi; secondary in Osaka, Fukuoka | Long term (≥ 4 years) |
| Government push for automated driving | +0.8% | National, early gains in Fukui (Eiheiji-cho), Chiba, with 19 areas operating year-round | Long term (≥ 4 years) |
| Source: Mordor Intelligence | |||
Passenger cars in use sustain CALI demand
The increasing number of passenger cars in use sustains demand for compulsory motor insurance. Japan had 62.32 million passenger cars on the road at the end of 2024, equal to 79.1% of the nation’s 78.74 million motor vehicles, which anchors compulsory automobile liability insurance demand under mandatory law[1]. The average service life lengthened to 13.32 years by March 2024, which keeps vehicles insured longer and lifts renewal volumes even as new registrations soften. Compulsory automobile liability premiums totaled JPY 688.9 billion in fiscal 2022, representing 6.6% of total non-life premiums written, which underscores the baseline volume the mandate creates. While traffic fatalities fell to 2,547 in 2025, police recorded 287,236 injury accidents, sustaining a steady need for third-party coverage despite the safety gains. The Financial Services Agency held compulsory premium rates unchanged in January 2026, signaling claims stability, and the policyholder protection mechanism maintains a 100% coverage ratio that shields consumers even in the event of insurer distress.
Gradual rise in vehicle kilometers traveled. Support higher premium volume
A gradual rise in total vehicle kilometers traveled by passenger cars supports higher premium volumes despite population decline. Total vehicle kilometers traveled reached 697,505 million in fiscal 2024, with passenger cars accounting for 565,021 million, a recovery trend that supports exposure-based pricing even as the number of drivers flattens[2]. Insurers use annual mileage as a key factor in voluntary policy pricing, so higher usage can lift aggregate premium pools without raising policy counts. Logistics operators face a projected 34% capacity shortage by fiscal 2030, which pushes fleet utilization higher and increases risk exposure per vehicle in commercial lines. Imported EVs accounted for 70% of registered EVs in 2024 and posted an average monthly distance of 472 kilometers, the longest among powertrains, which suggests electrification may add modest upward pressure on mileage. Urban corridors recover faster than rural areas, which creates a two-speed usage pattern that shows up in rate filings and telematics-derived pricing models.
ADAS and drive recorders are incentivized by regulation
Regulatory incentives like differentiated insurance rates for vehicles with ADAS and drive recorders encourage the adoption of safer, premium-covered cars. Advanced emergency braking reached 97.8% installation in new domestic passenger cars in 2024, and acceleration control for pedal error reached 99.0%, which improves safety outcomes and allows insurers to price discounts for these features. Policymakers promote safety support cars and telematics programs, creating a favorable framework for behavior-based pricing. Pioneer and Tokio Marine partnered in July 2025 on connected dash cams that enable the Drive Agent Personal service launched in January 2026, which layers incident alerts and driver assistance into underwriting. MS&AD’s telematics portfolio surpassed 1.85 million vehicles by June 2024, while Sompo Japan’s recorder-integrated product exceeded 370,000 units, and its fleet solution reached 4,700 companies and 150,000 vehicles. GIROJ reference loss cost rates enable companies to reflect lower frequency from ADAS-equipped vehicles, translating technology gains into premium advantages and faster feature adoption.
Mandatory third-party liability amid tourism recovery
Mandatory third-party liability for all vehicles ensures baseline market penetration amid urbanization and tourism recovery. The Automobile Liability Security Act requires compulsory automobile liability insurance for every registered vehicle, which creates 100% penetration and removes adverse selection in basic third-party coverage. The contract operates on a no-loss, no-profit basis and allocates investment income to accident prevention and victim support, which stabilizes the scheme and keeps pricing changes evidence-based. The government also maintains a 100% policyholder protection ratio for this contract line, which strengthens consumer confidence and avoids interruptions in coverage. Rental car and carsharing demand recovered in 2024 based on official household spending data, which points to higher mobility consumption and consistent CALI renewals in tourist-heavy prefectures. The supervisory framework assigns GIROJ to set standard full rates and reference loss costs, while the FSA, MLIT, and NPA align system approval, safety recording, and traffic rules for Level 3 and Level 4, which ensures coverage remains enforceable as technologies advance.
Restraints Impact Analysis*
| Restraint | (~) % Impact on CAGR Forecast | Geographic Relevance | Impact Timeline |
|---|---|---|---|
| High market saturation limits new customer growth | -0.6% | National, most acute in aging prefectures (Shimane, Tottori, Akita) | Medium term (2-4 years) |
| An aging population and a declining birthrate shrink the auto pool | -0.8% | National, faster in rural prefectures with depopulation | Long term (≥ 4 years) |
| Average premium rate pressure from competition | -0.5% | National, intensified by digital entrants and direct channels | Short term (≤ 2 years) |
| Rising elderly driver risk raises claims | -0.4% | National, concentrated where 65+ exceed 30% of the population | Medium term (2-4 years) |
| Source: Mordor Intelligence | |||
High market saturation limits new customer growth
High market saturation with high motor insurance penetration limits new customer growth and fuels price competition. Voluntary automobile insurance penetration reached 99.6% for unlimited bodily injury and 96.5% for property damage in fiscal 2023, so new policy growth depends on share shifts rather than new buyers. Insured vehicles totaled around 79 million for bodily injury liability, including 62 million private passenger cars and 16 million light four-wheeled passenger cars, which leaves little room to expand coverage counts[3]. Regulatory actions against premium adjustment practices removed informal price coordination among major carriers and forced open competition that puts sustained pressure on rates and expenses. Combined ratios deteriorated in fiscal 2024, which drove insurers to implement rate increases like Tokio Marine’s October 2025 revision to return below 95% in fiscal 2026. Direct channels, such as the rebranded Tokio Marine Direct and Rakuten’s ecosystem, add price transparency that compresses agency-based margin while shifting growth to digital models.
An aging population and a declining birthrate shrink the auto pool
The shrinking automobile insurance market due to an aging population and declining birthrate reduces new drivers and vehicle turnover. Individuals aged 65 and older accounted for 55.9% of traffic fatalities in 2025, which underscores an aging driver base that elevates risk while total drivers shrink. The transport sector faces a 34% capacity shortfall by fiscal 2030, including a 28% bus driver gap, which reflects broader demographic contraction that weakens vehicle turnover and new policy issuance[4]. Insurers acknowledge the structural drag from demographics even as auto accident cases rose in fiscal 2023 due to mobility recovery and inflation, not expanding customer pools. The government’s rideshare pilots help address mobility in rural areas but can cannibalize private ownership, which affects personal policy demand. Rural prefectures like Shimane and Tottori illustrate the challenge with low fatalities and ongoing depopulation that erode the insurable base over time.
*Our forecasts treat driver/restraint impacts as directional, not additive. The impact forecasts reflect baseline growth, mix effects, and variable interactions.
Segment Analysis
By Coverage Type: Mandatory third-party dominates, yet own-damage coverage races ahead
Third-party liability coverage captured 63.5% of Japan motor insurance market share in 2025 due to the universal CALI mandate that covers all 78.74 million vehicles in use. The supervisory framework held standard full rates unchanged in January 2026, which signaled steady claims and helped stabilize renewals in the Japan motor insurance market. The CALI scheme directs investment income to prevention and victim support and uses a no-loss, no-profit approach that keeps pricing apolitical and linked to experience data. The market size in voluntary segments grows at a faster pace than compulsory lines as product design and telematics expand optional benefits. Own-vehicle damage policies are set to grow at a 6.8% CAGR to 2031 as ADAS, glass, and battery-related repairs increase costs that customers aim to insure. Rising sensor recalibration needs and parts availability push claims severity higher, which supports greater attachment of comprehensive, collision, and assistance riders.
Electric vehicles add complexity to own-damage risk with battery replacement values reaching several million yen, which raises insured values and average premiums. Insurers respond with specialized products for high-voltage systems, thermal runaway, and charger liability as EV volumes grow and imported EVs account for a large share of registrations. Sompo’s coverage for the Everiwa Charger Share platform exemplifies new liability use cases around property damage and injury in charging interactions. Telematics and dash cam integrations are expanding within comprehensive products, as seen in Pioneer’s devices for Tokio Marine’s Drive Agent Personal launch in January 2026. Voluntary auto claims outpaced premium growth in fiscal 2024, which reflects inflationary repair costs and supports rate revisions and coverage redesign to protect margins.

By Vehicle Type: Passenger dominance intact, yet commercial fleets accelerate
Passenger cars accounted for 56.8% of premiums in 2025, with 62.32 million units in use and an average vehicle age of 9.34 years, which supports frequent repair events and strong renewal cycles. Insured vehicles under voluntary auto reached around 79 million for bodily injury liability, highlighting the depth of private and light passenger coverage in the Japan motor insurance market. Longer service life increases policy duration and keeps replacement rates lower, which directs growth toward premium per policy rather than policy count. The Japan motor insurance market size for commercial lines is set to expand faster due to logistics constraints and fleet digitization. Commercial vehicles are forecast to grow at a 5.4% CAGR through 2031 as logistics operators raise utilization to fill a projected 34% capacity gap by fiscal 2030 and seek telematics-based risk controls.
Carriers are building B2B risk ecosystems to support fleets under pressure from driver shortages and route constraints. Tokio Marine assembled the Logistics Consortium baton in November 2024 with 11 cargo carriers to test relay transportation from February 2026, which expands cross-company solutions that embed insurance. Sompo’s SMILING ROAD for fleets reached 4,700 companies and 150,000 vehicles, which shows scale for behavior-based safety programs and premium discounts tied to telematics. Trucks and buses have longer service lives than passenger cars, which supports stable renewal streams and nuanced coverage for aging assets. Electrification targets for light commercial vehicles add new battery and downtime exposures that require tailored products in the Japan motor insurance industry.
By Distribution Channel: Agents entrenched, yet digital platforms sprint
Agents and brokers held 70.2% share in 2025, reflecting deep relationships and enterprise account embeddedness across the market. Rising compliance standards are changing the channel as the FSA moved in December 2025 to require comparative explanations and sale-by-recommendation for omnibus agents, which pushes customer-first product comparisons. Carriers are removing cost support and secondments to agencies while tightening disciplinary rules to address pricing and information issues. The Japan motor insurance market size in direct and embedded channels is growing faster as telematics and ecosystem access reduce acquisition and service costs. Digital platforms and other emerging channels are projected to grow at a 6.54% CAGR through 2031, driven by e-commerce cross-sell, banking partnerships, and OEM affinity programs.
Ecosystem players illustrate the pace shift. Rakuten General Insurance reached 263,827 new policies in 2024 with strong cross-sell from its commerce, banking, and telecom services. Tokio Marine rebranded E.design as Tokio Marine Direct in July 2025 and reported October 2025 sales and premium income at 1.2x year-over-year, which points to improved consumer recognition. SBI Insurance adopted Finatext’s Inspire platform to digitize group operations and expanded to 26 regional financial institutions by September 2025, which supports embedded models. These moves show how digital entrants compress agent economics while incumbents adopt similar tools within the market to preserve share.
By Powertrain: ICE vehicles anchor premiums, yet EV coverage compounds fastest
ICE vehicles represented 58.7% of premiums in 2025 and continue to anchor pricing because of long data histories and repair infrastructure. EV premiums are projected to grow at a 4.6% CAGR through 2031, supported by policy goals for 100% electrified new passenger car sales by 2035 and rising registrations that demand new products. Imported EVs accounted for 70% of registered EVs in 2024 and recorded longer monthly driving distances, which raises exposure and refined rating needs. The market relies on targeted endorsements for battery safety, high-voltage systems, and charger liability as METI’s plan to reach 300,000 charging ports by fiscal 2030 unfolds. Early product designs for EV road services and charger-sharing liability signal a broader suite of electrification-linked covers in the industry.
Hybrids formed the largest alternative fuel group with over 2.0 million registrations in 2024, while PHVs reached 43,113, and FCVs remained in early adoption, which shapes a diverse risk mix. Clean diesel registrations concentrated in commercial applications also add to the mix with favorable torque and economy profiles, but face emerging emissions regulations. The next-decade policy split expects next-generation vehicles to reach 50-70% of new passenger sales, which changes fleet composition and claims profiles over time. Insurers are investing in AI models to improve pricing for electrified powertrains, which is important because historical loss data remains thin for batteries and advanced electronics. Better data quality from telematics and event recorders will improve total loss settlements and salvage management as EV residual values become clearer in the Japan motor insurance market.
Geography Analysis
Premium volumes and risk profiles vary by region as urban density and aging shape claim patterns. Tokyo and Kanagawa recorded 134 and 139 fatalities in 2025, which reflects concentrated traffic and higher collision frequency that raise average premiums and coverage attachment rates. Hokkaido ranked third with 129 fatalities and faces winter hazards and long-distance driving, which increases comprehensive claims for weather and wildlife events. Net premium income for automobile insurance rose by JPY 447 billion to JPY 9,578 billion in fiscal 2024, with urban areas contributing outsized gains as rate revisions captured repair inflation. Osaka and Aichi also hold significant premium pools due to manufacturing, distribution intensity, and population concentration that sustain the market.
Rural prefectures such as Shimane and Tottori had only 17 fatalities in 2025 and face shrinking populations that reduce vehicle ownership per capita. Transport capacity shortages are more acute in these regions, which drives interest in public rideshare pilots and alters personal vehicle usage patterns that affect policy demand. Local agents remain central to distribution outside metropolitan areas, while digital channel penetration lags due to demographics and fewer ecosystem cross-sell touchpoints. The compulsory program’s rate schedule accounts for remote islands and Okinawa, which recognizes specific risks such as typhoons and repair network constraints that influence the Japan motor insurance market. Tourism recovery supports rental car policies in destinations such as Okinawa, which offsets some decline in personal policy counts.
Automated driving is scaling through targeted pilots and rural deployments, which alters regional risk. Eiheiji-cho in Fukui launched Level 4 services in May 2023 and was followed by 18 other year-round locations by late 2024, with more sites planned through 2027. Urban-adjacent pilots in Chiba are testing safety verification with insurer involvement to refine policy design for operator liability. EV adoption clusters in Tokyo, Kanagawa, and Aichi due to charging access and income effects, which raises exposure to battery and infrastructure claims in those corridors. The Japan motor insurance market size tied to electrification and automation will increasingly mirror infrastructure rollouts as expressway chargers upgrade to 90 kW or higher and local networks expand.
Regulatory Landscape
Japan motor insurance is governed by a dual framework, compulsory automobile liability insurance (CALI) under the Automobile Liability Security Act and voluntary motor lines under the Insurance Business Act under the Financial Services Agency (FSA) supervisory guidelines. For CALI, the General Insurance Rating Organization of Japan (GIROJ) calculates standard full rates and reference loss costs. The FSA, together with the Minister of Land, Infrastructure, Transport and Tourism (MLIT), is involved in approvals, which keeps the scheme aligned to the no-loss, no-profit principle.
Rate governance tightened in the latest council cycle. After the FSA noted in January 2025 that a CALI rate revision was not necessary at that time (based on limited divergence from planned loss ratios), the FSA/MLIT CALI Council decided in April 2026 on a premium rate increase effective November 2026 (about a 6% average increase across vehicle types) to rebalance income and expenditure. The regime has also expanded to new mobility categories, including the April 2024 implementation of CALI reference premium rates for specified small motorized bicycles (for example, electric kickboards) following Road Traffic Act-related definitions.
Value Chain Analysis
Japan motor insurance value creation starts with policy design and rate-making anchored by GIROJ reference loss costs and, for CALI, government-supervised standard full rates approved through the FSA. Risk selection and distribution are carried out through (i) incumbent non-life insurers and their large agency networks, (ii) direct and digital platforms, and (iii) embedded channels tied to auto ecosystems, with mutual aid cooperatives (Kyosai) also participating alongside insurers. A distinctive downstream node is the motor channel agency model, where dealerships and repair shops can combine insurance solicitation with repair fulfillment, influencing both acquisition and claims outcomes.
Claims, repair, and settlement are the largest operational cost center, increasingly shaped by repair inflation, ADAS-related recalibration, and complex parts supply chains. Insurers use claims experience to update pricing and product design, reflected in recurring rate and product changes highlighted in major group disclosures (for example, Sompo Holdings cited revenue uplift from auto and fire product revisions in its FY2025 results communication released in May 2026). Governance and capital linkages across the ecosystem also shape partnering behavior, with major groups publicly committing in 2025 to unwind cross-shareholdings, which can change how insurers coordinate with automotive distributors, banks, and platform partners.
Competitive Landscape
The Japan motor insurance market is an oligopoly anchored by Tokio Marine, MS&AD, and Sompo, which command the majority of domestic non-life net premiums written. MS&AD held the major market share at the group level in fiscal 2023, and all three giants undertook operational reforms after regulatory actions addressing premium adjustments and claims handling. The shift to open competition lifted transparency and pushed cost reductions, underwriting improvements, and digital channel development to restore combined ratios. Tokio Marine’s combined ratio rose to 98.0% for auto in fiscal 2024, which led to an 8.5% rate increase in October 2025 to target sub-95% from fiscal 2026. The trio’s focus in 2026 centers on telematics, claims cost control for ADAS-heavy repairs, and channel reforms that lower expense ratios.
Telematics and connected services are key differentiators. Aioi Nissay Dowa surpassed 1.85 million telematics auto insurance contracts in June 2024, which pairs safe driving scores with discounts and engagement. Sompo’s drive recorder product exceeded 370,000 cumulative unit sales, and the SMILING ROAD fleet program covered around 150,000 vehicles across 4,700 companies. Tokio Marine partnered with Pioneer to launch the Drive Agent Personal service in January 2026, which integrates connected dash cams for incident alerts and driver assistance. The insurance market sees new white spaces in Level 4 service coverage, battery liability, and charger-sharing protections as automation and electrification advance.
Digital and embedded challengers scale with ecosystem synergies. Rakuten grew its web-based policy sales 33.7% year-over-year in 2024, exploiting cross-sell advantages across commerce, banking, and telecom to lower acquisition costs in the market. The SBI Insurance Group crossed 3 million in-force contracts by April 2025 and expanded distribution through 26 regional banks by September 2025, using technology to streamline group policy operations and embedded offers. Finatext’s acquisition of an AI insurtech in October 2025 and deployment at SBI shows how generative AI enables accident reception and sales support functions that reduce service costs. Incumbents are replicating these tools while managing agent relationships and compliance changes that reconfigure commission economics.
Japan Motor Insurance Industry Leaders
-
Tokio Marine Group
-
Sompo Holdings
-
MS&AD Insurance Group
-
Rakuten Insurance Group
-
SBI Insurance Group
- *Disclaimer: Major Players sorted in no particular order
Market Opportunities and Future Outlook
Pricing and product whitespace is opening in segments where mandated and voluntary pricing are being recalibrated together. The April 2026 FSA/MLIT CALI Council decision to raise CALI premiums effective November 2026 (around a 6.2% average increase cited in council reporting) resets the compulsory baseline and encourages carriers to refine voluntary coverage layers around bodily injury, own-damage, and assistance, particularly where repair inflation and vehicle complexity are rising. The immediate opportunity is to bundle clearer value propositions above the mandatory floor, using disciplined underwriting and redesigned endorsements rather than relying on policy count growth in a saturated market.
Technology-led underwriting and claims operations are also creating a more concrete differentiation path, supported by live deployments and partnerships. Tokio Marine and Nichido Fire Insurance launched Drive Agent Personal in January 2026 using network-connected dash cams supplied by Pioneer, turning incident detection and assistance into an integrated part of the motor policy. Sompo Holdings disclosed a strategic partnership and investment with Zego (announced April 2026) to develop telematics and usage-based insurance models for Japan, signaling continued build-out of behavior-based pricing, fleet analytics, and embedded distribution. These initiatives create room for carriers and ecosystem partners (OEMs, fleet operators, and digital platforms) to commercialize data-driven pricing, faster claims triage, and new liability covers linked to charging, shared mobility, and advanced driver assistance features.
Recent Industry Developments
- June 2026: Japan’s Financial Services Agency published an overview of major non-life insurance groups’ fiscal results as of March 31, 2026, noting higher underwriting revenue driven mainly by domestic rate and product revisions. The disclosure reinforced that pricing and product actions, rather than exposure growth, are central to restoring underwriting performance in motor lines. This environment increases the payoff from disciplined segmentation, claims cost control, and channel efficiency programs.
- May 2026: Sompo Holdings released FY2025 results materials highlighting that revenue growth in the coming fiscal year is supported by the realized effects of rate increases and product revisions in auto and fire insurance. The update points to how large incumbents are using portfolio-wide repricing and coverage redesign to counter repair inflation and elevated loss costs. It also signals continued investment capacity for digital claims workflows and telematics-led differentiation in motor.
- June 2024: MS&AD reported scale-up in telematics-based motor insurance, with Aioi Nissay Dowa exceeding 1.85 million telematics auto insurance contracts by June 2024. This level of adoption supports behavior-based pricing and more automated FNOL and claims triage. It also raises competitive pressure on carriers without comparable connected-vehicle programs to match service levels and pricing granularity.
Research Methodology Framework and Report Scope
Market Definition and Coverage
For this study, the Japan motor insurance market is sized as the value of motor insurance premiums written in Japan, covering mandatory and optional protection linked to passenger and commercial road vehicles.
Scope exclusions: It does not include non-motor P&C lines, reinsurance-only flows, or standalone roadside services sold without an insurance policy.
Segmentation Overview
- By Coverage Type
- Third-Party Liability
- Own-Vehicle Damage
- Collision
- Comprehensive (Theft, Glass, Fire, etc.)
- Assistance & Add-ons (Roadside, Legal)
- By Vehicle Type
- Passenger Cars
- Commercial Vehicles
- By Distribution Channel
- Direct
- Agents/Brokers
- Banks
- Embedded Channels (OEM, Affinity, etc.)
- Digital Platforms and Other Emerging Channels
- By Powertrain
- ICE Vehicles
- Electric Vehicles
- Hybrid Vehicles
- Others (Hydrogen FCEV, LPG/CNG, etc.)
Data Sources, Market Sizing, and Validation
Desk Research
Desk research is used to set the starting structure for the model and to anchor Japan-specific demand signals that influence premium pools. We referenced public statistical and supervisory sources such as Japan Financial Services Agency publications, General Insurance Association of Japan releases, Ministry of Land, Infrastructure, Transport and Tourism vehicle stock and registration tables, Statistics Bureau of Japan price and household indicators, and OECD macro series.
We also reviewed insurer annual reports, solvency and results disclosures, investor presentations, and reputable press coverage to understand pricing actions and claims pressure. Select paid databases were used for company financials, news and financials, and patent lookups to track product and distribution changes over time. These examples are not exhaustive, and we checked many additional sources to collect, validate, and clarify the final numbers.
Primary Interviews and Surveys
Primary work was used to pressure-test the desk assumptions and fill gaps where public data is delayed or reported in a different format. We spoke with insurance executives, pricing and underwriting leaders, distribution heads, and claims managers across Japan, and we also included inputs from repair ecosystem and fleet-side stakeholders to confirm what is changing in volumes, average premium per policy, and loss trends.
Distribution of primary research fieldwork respondents
| Company type | Respondent position |
|---|---|
| Top tier: 26% | CXOs: 13% |
| Mid tier: 56% | Functional/Unit leaders: 39% |
| Smaller Players: 18% | Managers: 48% |
Market-Sizing & Forecasting
Sizing is built using a top-down approach where national premium pools are reconstructed from insurance premium disclosures and then aligned to motor-specific splits using coverage mix and channel mix checks. The totals are then corroborated with selective bottom-up approximations, such as sampled average premium per policy multiplied by insured vehicle counts, and channel checks on renewal and new business patterns, which helps adjust for reporting gaps.
Inputs we relied on include insured vehicle parc and new registrations, average premium movement by coverage type (compulsory versus voluntary), claim frequency and repair cost inflation signals, distribution shift toward direct and digital touchpoints, and vehicle powertrain mix (ICE, hybrid, and EV), since it changes repair severity. For forecasting, we used scenario analysis supported by simple multivariate relationships between premium growth, vehicle parc change, CPI-linked repair inflation, and expected pricing actions discussed in interviews. Where a variable could not be built directly, we used conservative ranges and then narrowed them based on expert consensus and consistency with historical premium behavior.
Data Validation & Update Cycle
Outputs are validated through multiple checks, including reconciling the implied premium per vehicle against plausible ranges, comparing growth with vehicle parc and repair inflation signals, and reviewing sudden jumps that do not match known market events. When mismatches appear, we re-check currency conversion timing, base-year alignment, and whether a source is reporting gross versus direct written premium concepts.
Before sign-off, a second analyst reviews the model logic, assumptions, and year-by-year movements, followed by a final sense check against independent indicators. Reports are refreshed annually, and interim updates are made when material events affect pricing, claims, regulation, or vehicle mix. Right before delivery, we run a fresh pass so clients receive the most current view available.
Mordor Intelligence's Japan Motor Insurance Market Size Measured Against Other Published Estimates
Published market values can differ even when they look like they cover the same topic, mainly because premium metrics and timing choices are not consistent across sources. Differences also show up when one estimate is built from written premiums and another is derived from a broader insurance pool with allocation assumptions.
In this study, the refresh cadence and the conversion timing used for JPY to USD are treated as first-order decisions, and average premium progression is cross-checked with coverage mix and loss-cost signals, which keeps the 2025 value tied to what insurers are actually writing in that year, a discipline applied by Mordor Intelligence.
Benchmark comparison
| Source | Market Size | Gaps in Research Methodology |
|---|---|---|
| Mordor Intelligence | USD 56.01 B (2025) | |
| Trade Journal A | USD 44.10 B (2030) | Uses a forward-year gross written premium figure, and the USD value depends heavily on the exchange-rate assumption at the forecast end year, which makes it hard to compare to a base-year direct written premium sizing. |
| Syndicated Publisher B | USD 54.69 B (2024) | Anchors the base year one year earlier and may apply a different definition of written premiums and included add-ons, so the implied average premium path and starting premium pool do not line up year-on-year. |
The spread in values is mostly explained by year selection, premium metric choice, and how currency is timed for USD reporting. By stating the premium basis, aligning the base year cleanly, and validating average premium movement against vehicle and claims signals, our estimate stays traceable to repeatable checks rather than a single headline projection.
Key Questions Answered in the Report
What is the current size and growth outlook for Japan motor insurance through 2031?
The Japan motor insurance market is estimated at USD 57.94 billion in 2026 and is projected to reach USD 68.61 billion by 2031 at a 3.44% CAGR.
Which coverage type leads and which grows fastest in Japan motor insurance?
Third-party liability led with 63.5% share in 2025, while own-vehicle damage coverage is expected to grow at a 6.8% CAGR through 2031.
How are distribution channels shifting in Japan motor insurance?
Agents and brokers held 70.2% share in 2025, but digital platforms and other emerging channels are projected to grow at a 6.54% CAGR through 2031 as the FSA enhances agent conduct standards.
What are the main implications of electrification for policy and claims in Japan?
EV growth raises insured values and introduces battery and charging liabilities, with EV premiums expected to grow at a 4.6% CAGR through 2031, and specialized products already in the market.
Where are risk and premium volumes concentrated across Japan?
Urban prefectures such as Tokyo, Kanagawa, Osaka, and Aichi concentrate premium volumes due to traffic density and commercial activity, while rural areas face aging demographics and rideshare pilots that change personal policy demand.
What regulatory changes are affecting pricing and distribution in 2026?
The FSA kept CALI rates unchanged and proposed comparative explanation and sale-by-recommendation rules for omnibus agents, which increase transparency and push digital shifts.