
Market Overview
| Study Period | 2020 - 2031 |
|---|---|
| Forecast Data Period | 2026 - 2031 |
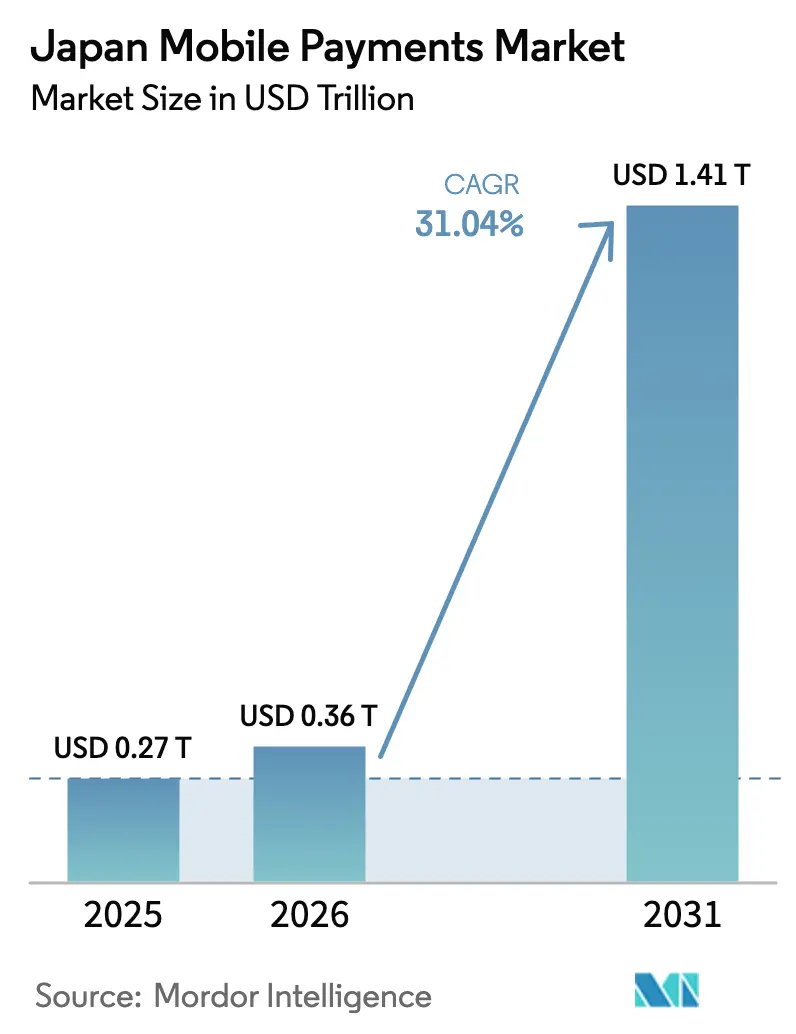
| Base Year Market Size (2025) | USD 0.27 Trillion |
| Market Size (2026) | USD 0.36 Trillion |
| Market Size (2031) | USD 1.41 Trillion |
| Growth Rate (2026 - 2031) | 31.04 % |
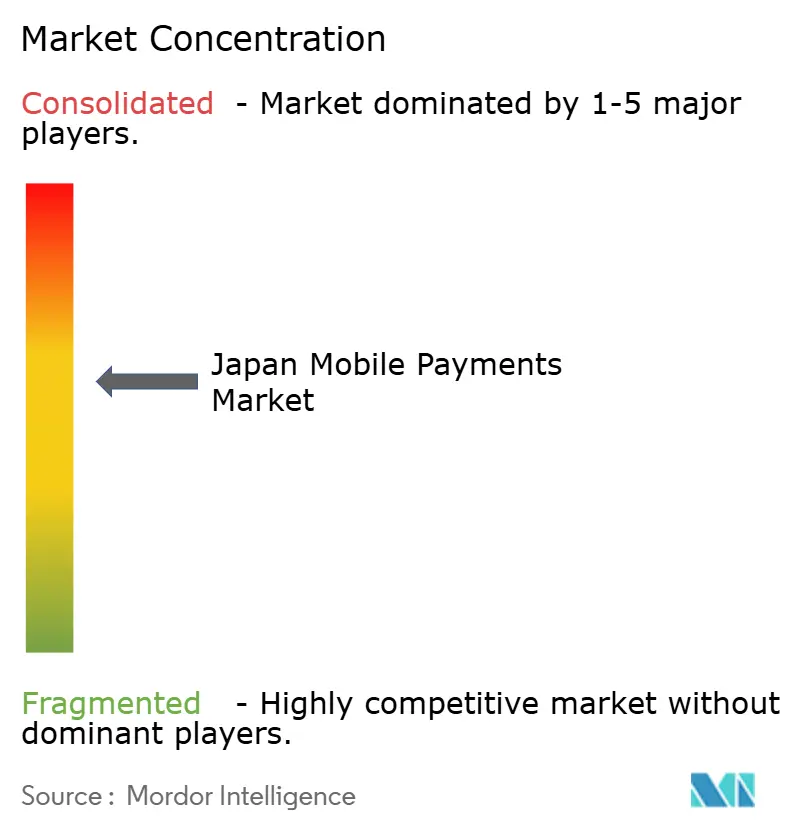
| Market Concentration | Medium |
Major Players *Disclaimer: Major Players sorted in no particular order Image © Mordor Intelligence. Reuse requires attribution under CC BY 4.0. | |
Japan Mobile Payments Market Analysis by Mordor Intelligence
The Japan mobile payments market size stood at USD 0.36 trillion in 2026 and is projected to reach USD 1.41 trillion by 2031, registering a 31.04% CAGR. The expansion aligns with the government’s Cashless Vision that aims for an 80% cashless ratio by 2030, rising from 42.8% in 2024. Mobile wallet adoption, rapid e-commerce penetration, and 5G-enabled smartphone ubiquity underpin this structural pivot toward digital transactions. Real-time settlements, led by domestic bank transfer infrastructure and emerging real-time payment rails alongside movement toward a digital yen, further compress settlement latencies, while inbound tourism recovery places new volume across retail, hospitality, and transportation spend. Competitive dynamics remain fluid as telecom-backed wallets, e-commerce ecosystems, and payment gateways race to convert Japan’s remaining cash-reliant segments.
Key Report Takeaways
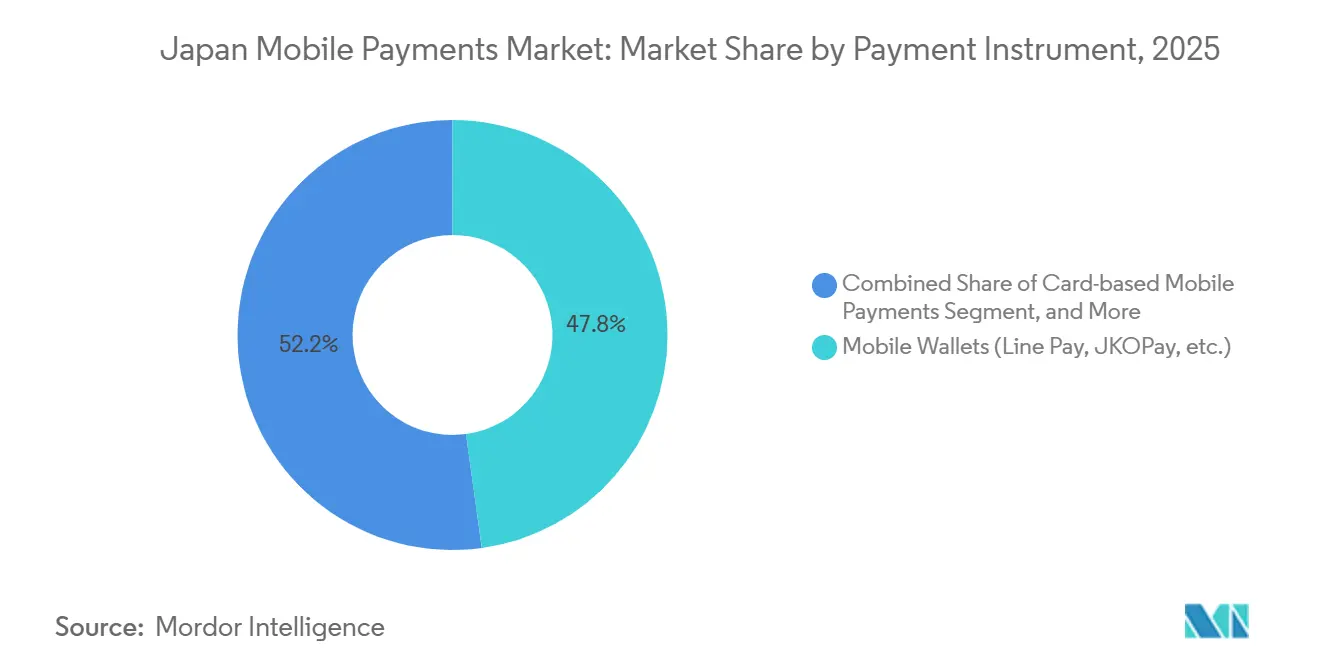
- By payment instrument, mobile wallets secured 47.83% of payment instrument share in 2025, whereas real-time transfers are set to advance at a 31.76% CAGR through 2031.
- By transaction channel, e-commerce channels accounted for 47.83% of transaction volume in 2025, while cross-border and tourist payments are forecast to expand at a 31.83% CAGR through 2031.
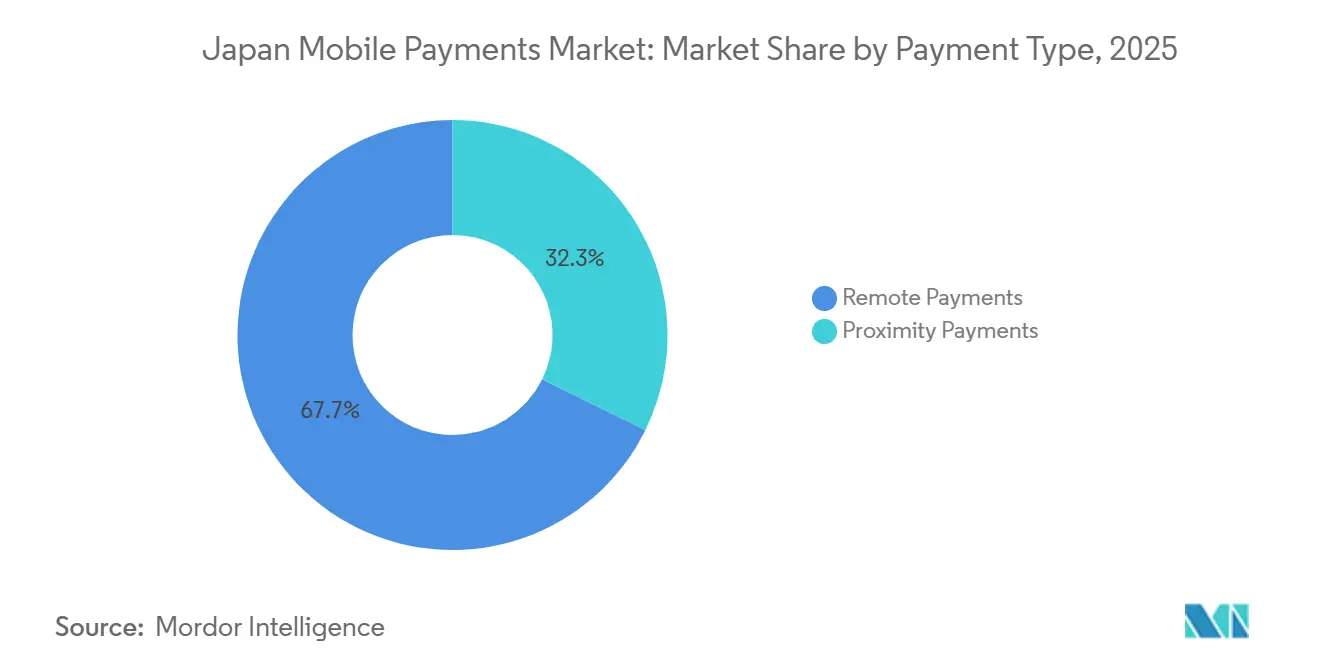
- By payment type, remote payments represented 67.72% of transaction types in 2025 and are projected to grow at a 32.03% CAGR to 2031.
- By end-user industry, retail and fast-moving consumer goods held 34.72% of end-user industry revenue in 2025, whereas hospitality and tourism show the fastest trajectory with a 31.98% CAGR through 2031.
Note: Market size and forecast figures in this report are generated using Mordor Intelligence’s proprietary estimation framework, updated with the latest available data and insights as of January 2026.
Market Trends and Insights
Drivers Impact Analysis of Japan Mobile Payments Market*
| Driver | (~) % Impact on CAGR Forecast | Geographic Relevance | Impact Timeline |
|---|---|---|---|
| Government Cashless Vision 80% Target by 2030 | +8.2% | National – Tokyo, Osaka, Nagoya | Medium term (2-4 years) |
| E-commerce and M-commerce Boom | +7.5% | National – urban and logistics hubs | Short term (≤2 years) |
| Nationwide QR-Code Incentives for SMEs | +5.8% | National – regional cities, rural clusters | Medium term (2-4 years) |
| High Smartphone and 5G Penetration | +4.9% | National – 5G corridors | Long term (≥4 years) |
| Digital-yen Pilot Integration Pathways | +2.6% | National – financial districts | Long term (≥4 years) |
| Payroll Digitization After Labor Act Revision | +2.0% | National – large enterprises | Medium term (2-4 years) |
| Source: Mordor Intelligence | |||
Government Cashless Vision 80% Target by 2030
The Ministry of Economy, Trade and Industry raised the national cashless ratio goal to 80% by 2030 after surpassing 40% two years ahead of schedule. Subsidies now offset up to two-thirds of terminal costs for small and medium enterprises, a decisive incentive for nearly 60% of merchants that remained cash-only through 2024. Credit cards still generate most digital turnover, yet QR payments have already reached double-digit share, reflecting a generational pivot toward smartphone-centric transactions. Urban cashless ratios above 50% highlight the momentum in Tokyo, Osaka, and Nagoya, whereas rural prefectures lag, creating expansion headroom for wallet providers. JPQR standardization seeks to unify codes across eight Asian networks in time for Expo 2025, removing a key interoperability hurdle.[1]
E-commerce and M-commerce Boom Across Retail and Services
Japan’s e-commerce sector touched USD 112.9 billion in 2024, with mobile commerce already exceeding half of all online turnover. Ecosystem leaders such as Rakuten seamlessly bridge shopping, payment, credit, and loyalty, producing higher repeat-purchase frequency and lower checkout friction. Peer-to-peer platforms like Mercari embed Merpay to keep payments native to the browsing flow, reinforcing conversion gains of 15%-20% over desktop. Mobile-first design has broad appeal in fashion, electronics, and food delivery, while inbound shoppers leverage UnionPay and Alipay Plus to blur domestic and international transaction boundaries.
Nationwide QR-Code Acceptance Incentives for SMEs
Acquirer fees of 2%-4% and legacy hardware costs between USD 500 and USD 2,000 long discouraged smaller merchants. The government’s subsidy scheme reduces capex, while PayPay’s free QR stickers and cashback promotions effectively yield sub-1.5% net fees during campaigns. JPQR now lets stores display a single code that works across PayPay, Rakuten Pay, d-Barai, au PAY, and regional bank wallets, trimming integration effort. Rural adoption, once 18-24 months behind urban centers, is accelerating as local banks co-sponsor training and incentives. This convergence narrows Japan’s digital divide while driving volume into the Japan mobile payments market.
High Smartphone and 5G Penetration Enabling Wallet Adoption
Smartphone connections reached 194 million in 2025, equal to 157% of the population, and 5G already blankets 37% of residents. Low-latency networks support instant confirmations, augmented-reality coupons, and biometric checks that cut checkout times nearly in half versus physical cards. Telecom wallets leverage carrier billing to pre-authenticate users and extend credit via phone invoices, sidestepping conventional scoring hurdles for students and gig workers. Apple Pay and Google Pay dominate premium devices, yet domestic wallets hold mass-market Android positions, prompting the Mobile Payment Alliance to pursue deeper interoperability for seamless experiences.
Restraints Impact Analysis of Japan Mobile Payments Market*
| Restraint | (~) % Impact on CAGR Forecast | Geographic Relevance | Impact Timeline |
|---|---|---|---|
| Aging SME POS Hardware and High Fees | -3.8% | National – rural, suburban clusters | Short term (≤2 years) |
| Fragmented Wallet Ecosystem | -2.9% | National – multi-brand retail | Medium term (2-4 years) |
| Cyber-fraud and Card-not-Present Chargebacks | -1.7% | National – e-commerce, peer-to-peer | Short term (≤2 years) |
| Slow QR Interoperability Cross-border | -1.2% | China, South Korea, Taiwan, ASEAN corridors | Medium term (2-4 years) |
| Source: Mordor Intelligence | |||
Aging SME POS Hardware and High Acquirer Fees
Roughly 60% of small merchants still use outdated terminals or remain cash-only, wary of fees that erode already thin margins. Even with subsidies, residual hardware costs and maintenance deter operators in low-volume rural sites. Wallet providers respond with zero-capex QR decals and periodic fee holidays, yet such promotions need cross-subsidies from urban spend to stay viable. The resulting two-tier ecosystem slows nationwide ubiquity for the Japan mobile payments market.
Fragmented Wallet Ecosystem Confusing Users and Merchants
PayPay, Rakuten Pay, d-Barai, au PAY, Merpay, and numerous regional wallets each push proprietary codes, loyalty schemes, and promotions. Stores juggling up to eight decals face operational clutter, and integrated multi-wallet terminals add USD 1,000-1,500 in upfront expense. JPQR consolidation reached only 15,000 stores by 2024, far from the 100,000 target, partly because each provider hesitates to forfeit brand differentiation. LINE Pay’s 2025 shutdown signals inevitable attrition, yet network-effect scale is still some distance away.
*Our forecasts treat driver/restraint impacts as directional, not additive. The impact forecasts reflect baseline growth, mix effects, and variable interactions.
Japan Mobile Payments Market Segment Analysis
By Payment Instrument:
Wallet Share Anchors While Real-Time Transfers AccelerateWallets held 47.83% of payment instrument volume in 2025 within the Japan mobile payments market. PayPay alone processed 7.8 billion transactions worth JPY 12.5 trillion (USD 83.3 billion) in fiscal 2024, leveraging telecom backing and cashback incentives to reach 70 million users. Rakuten Pay turns ecosystem points into tender and ranks highest in satisfaction surveys three years running, while d-Barai and au PAY employ carrier billing to extend micro-credit. Despite this lead, real-time transfers are predicted to post a 31.76% CAGR, underpinned by Bank of Japan settlement upgrades and an impending digital yen decision. The Japan mobile payments market size tied to real-time rails therefore expands faster than any other instrument category. Interbank APIs and yen-backed stablecoin pilots by major banks illustrate a path toward programmable money that could bypass legacy card networks.
Card tokenization via Apple Pay and Google Pay keeps premium iOS and Android users within near-field communication ecosystems, yet these segments remain smaller than QR-driven wallets. Carrier billing supports niche digital-content purchases and prepaid top-ups but faces regulatory limits on credit exposure. Meanwhile, Payment Card Industry Data Security Standard requirements introduced in 2024 raise compliance costs, tilting smaller issuers toward gateway partnerships. These factors collectively maintain wallets as the anchor but set the stage for real-time and central bank digital currency solutions to gain incremental share inside the Japan mobile payments industry.

By Transaction Channel:
E-commerce Plateaus as Cross-Border Volumes SurgeE-commerce represented 47.83% of all transaction volume in 2025, buoyed by one-click wallet integrations that cut cart abandonment by up to one-fifth. Mobile commerce’s 58.2% share of online spend underscores consumer comfort with biometric checkouts on handheld devices. Yet the highest growth resides in cross-border and tourist channels at a 31.83% CAGR, a shift that will reshape the Japan mobile payments market. Visitor arrivals rebounded to 36.87 million in 2024 and are headed toward the 60 million goal, funneling additional spend through Alipay Plus and UnionPay networks.
Transport-integrated e-money, namely Suica and PASMO, expands in-store acceptance beyond rail gates, reinforcing hybrid digital-physical commerce. Peer-to-peer transfers also rise, driven by PayPay’s zero-fee model, highlighting consumer appetite for instant, bank-free remittances. Together, these trends diversify revenue streams while increasing competitive pressure on static e-commerce channels within the Japan mobile payments market.
By Payment Type:
Remote Transactions Dominate While Hybrid Models EmergeRemote transactions accounted for 67.72% of payment activity in 2025, driven by robust e-commerce, bill pay, and peer-to-peer use cases. The segment’s 32.03% CAGR signals sustained momentum for the Japan mobile payments market size. However, an uptick in card-not-present fraud underscored the need for 3D Secure version 2.0, which now reduces false approvals by up to 40%.
Proximity payments still anchor in-store retail, hospitality, and transportation. Suica Renaissance, set for autumn 2026, plans to add QR capabilities for 155 million rail e-money users and to narrow the gap between offline and online experiences. As wallets overlay augmented-reality offers, the boundary between remote and proximity payments shrinks, steering the Japan mobile payments market toward unified app architectures that seamlessly manage both modes.
By End-User Industry:
Hospitality Outruns Retail Amid Tourism RevivalRetail and fast-moving consumer goods delivered 34.72% of 2025 spend, sustained by convenience-store networks that accept Nanaco, WAON, and universal QR codes. Department stores blend private-label e-money with loyalty analytics, but online-native formats grow quicker by integrating payment deep into browsing journeys. Hospitality and tourism, projected to expand at a 31.98% CAGR, benefit from instantaneous tax-free refunds and multi-wallet acceptance that captures higher-value tourist purchases. This momentum enlarges the Japan mobile payments market share attached to hotels, restaurants, and entertainment, eclipsing traditional retail growth.
Transportation retains relevance via contactless transit cards now extending to retail checkouts, while utilities and telecom rely on carrier billing to aggregate household payments. Healthcare and education show latent demand yet await clearer regulatory pathways. Overall, divergent trajectories across industries reinforce why wallet providers tailor propositions to sector-specific pain points within the broader Japan mobile payments industry.
Geography Analysis
Tokyo, Osaka, and Nagoya accounted for most of the 2025 transaction volume, thanks to dense merchant networks, high smartphone usage, and frequent promotional campaigns. Cashless ratios surpassing most in these cities spotlight rapid adoption, whereas rural prefectures such as Hokkaido and Kyushu remain at a signficiant rate, constrained by aging merchant bases and slower broadband rollout. Regional banks partnered with national wallets in 2025 to deliver localized incentives, yet rural uptake still trails urban uptake by up to 2 years. Achieving most of the national cashless target hinges on closing this digital divide.
Cross-border corridors with China, South Korea, Taiwan, and ASEAN markets gain prominence as JPQR interoperability extends to eight Asian networks. Alipay Plus boasts acceptance at more than 1 million Japanese sites, and UnionPay covers 2 million, turning Ginza, Dotonbori, and Gion districts into frictionless tourist spending zones. The Bank of Japan’s digital yen pilot includes real-time foreign exchange, hinting at fee-free cross-border capabilities by 2026.[2]
Suburban logistics hubs in Saitama, Chiba, and Kanagawa experienced a sharp uptick in mobile commerce during 2025, driven by same-day delivery models that favor app-based checkouts. As 5G coverage accelerates toward 92% by 2030, augmented-reality promotions and biometric security will migrate into secondary cities, adding new nodes to the Japan mobile payments market.
Regulatory Landscape
Japan's mobile payments are regulated primarily by the Financial Services Agency (FSA) under the Payment Services Act (PSA), with related oversight for deferred payment/credit structures handled through frameworks administered by the Ministry of Economy, Trade and Industry (METI). A key regulatory step was the Act to Amend the Payment Services Act (Act No. 66 of 2025), enacted on June 6, 2025, which introduced and clarified rules for digitalized payment services, including a framework for stablecoins as Electronic Payment Instruments, along with refinements for fund transfer and related payment services.
In 2026, implementation moved quickly. The Cabinet approved the required government ordinances and Cabinet Office orders on May 19, 2026, and the amended PSA provisions took full operational effect on June 13, 2026. This included requirements affecting stablecoin intermediaries and tighter AML/CFT compliance expectations. Interoperability standardization also continues to shape the operating environment, with the Payments Japan Association maintaining JPQR specifications (MPM and CPM) to support unified QR acceptance across mobile payment providers.
Value Chain Analysis
The Japan mobile payments value chain begins with funding and account rails, including banks and interbank transfer infrastructure, and then moves through licensed payment providers such as Funds Transfer Service Providers and Prepaid Payment Instrument Issuers. Acceptance enablement follows, with acquirers, payment gateways, and POS/QR acceptance tools connecting consumer payment initiation to merchant processing. Above these layers, platform operators and ecosystems, including telecom-backed wallets and e-commerce marketplaces, drive onboarding, loyalty, and repeat use-case frequency.
Merchants across retail, transport, and hospitality connect through gateway APIs and multi-payment acceptance solutions that bundle wallets, cards, and alternative methods. Along the chain, regulation and standards influence where value is captured and how products are designed, particularly via the FSA-administered PSA and the METI-linked installment/credit rules for stored value, BNPL, transfers, and stablecoin-linked payment propositions. The main friction points tend to sit at the last mile, where fragmented QR networks and legacy cash-reliant acceptance in smaller merchants slow integration. JPQR and partnerships among wallets, gateways, and financial institutions are aimed at reducing integration effort and improving interoperability across channels, including cross-border and tourism flows.
Competitive Landscape
The market is moderately fragmented. PayPay accounts for most QR payments and captures one-fifth of all cashless volume, yet no single player dominates every instrument or channel. GMO Payment Gateway processes JPY 21 trillion (USD 140 billion) annually for 150,000 merchants, acting as neutral plumbing for multiple wallets.[3] Telecom-backed offerings leverage carrier billing data to underwrite micro-credit, while Rakuten builds stickiness through an ecosystem prism that links shopping, banking, and securities.
Product roadmaps pivot on biometric authentication, augmented-reality commerce, and server-managed wallets. JR East’s Suica Renaissance illustrates how transportation incumbents can leverage vast cardholder bases to expand beyond transit. Meanwhile, major banks tested yen-backed stablecoins in November 2025, signaling readiness to enter programmable money segments if a digital yen gains official traction. Continued wallet consolidation is probable, following LINE Pay’s 2025 exit and PayPay’s acquisition of a 40% stake in Binance Japan, a move that integrates crypto trading into mainstream consumer wallets.
The Financial Services Agency's Payment Card Industry Data Security Standard compliance mandate enforced in 2024 elevated baseline security requirements, yet persistent card-not-present fraud losses of JPY 54.1 billion (USD 360 million) in 2024 underscore the need for continuous investment in three-dimensional secure authentication and behavioral analytics
Japan Mobile Payments Industry Leaders
-
GMO Payment Gateway Inc.
-
SB Payment Service Corp.
-
PayPay Corporation
-
Rakuten Payment, Inc.
-
LY Corporation (Line Pay)
- *Disclaimer: Major Players sorted in no particular order
Japan Mobile Payments Market Companies Covered in this Report
- GMO Payment Gateway Inc.
- SB Payment Service Corp.
- NETSTARS Co., Ltd.
- Canal Payment Service Co., Ltd.
- Digital Garage, Inc.
- Visa Worldwide Japan Co., Ltd.
- Mastercard Asia/Pacific Pte. Ltd.
- JCB Co., Ltd.
- American Express International, Inc.
- UnionPay International Co., Ltd.
- PayPay Corporation
- Rakuten Payment, Inc.
- NTT DOCOMO, Inc. (d-Barai)
- LY Corporation (Line Pay)
- KDDI Corporation (au PAY)
- AEON Financial Service Co., Ltd. (WAON)
- Seven & i Holdings Co., Ltd. (Nanaco)
- Mercari, Inc. (Merpay)
- PayPal Japan K.K.
- Mitsubishi UFJ NICOS Co., Ltd. (MUFG Wallet)
Market Opportunities and Future Outlook
One clear opportunity sits in simplifying merchant acceptance and improving security-led upgrades as Japan shifts from adoption counts toward higher transaction frequency. METI's revised tracking approach, which reported a 58.0% cashless ratio for 2025 under its Domestic Index announced March 31, 2026, places more weight on everyday spend categories and merchant coverage than headline penetration alone. That framing creates room for providers to onboard and retain cash-heavy SMEs using low-friction QR acceptance and integrated tooling, such as billing, loyalty, and reconciliation.
A second opportunity is regulated digital-asset adjacent payments and programmable settlement use-cases tied to the June 13, 2026 operationalization of the amended Payment Services Act. That update formalizes requirements around Electronic Payment Instruments and related intermediaries. In parallel, the Bank of Japan expanded experimentation in March 2026 through a sandbox testing settlements and bank deposits using tokenized central bank money points, which shapes product roadmaps linking wallets, gateways, and merchants to faster, more automated settlement and treasury workflows. This is particularly relevant for e-commerce and cross-border-heavy sectors such as hospitality and tourism.
Recent Industry Developments in Japan Mobile Payments Market
- July 2026: GMO Payment Gateway launched a Part-Time Job Recruitment and Retention Plan that connects job media Gigabaito with PayPay Paycheck to support digital payroll. The plan links payments into HR workflows, extending mobile-payment-linked value beyond checkout and supporting higher transaction stickiness in labor-intensive merchant segments.
- June 2025: GMO Payment Gateway added the BNPL service atokara to its PG Multi-Payment Service in collaboration with Sumitomo Mitsui Card Company and GMO Payment Service. This expanded checkout options for merchants using the gateway and strengthened pay-later propositions inside mobile-driven e-commerce flows.
- November 2024: GMO Payment Gateway updated its PG Multi-Payment Service SDK to enable PayPay payments without requiring a transition to the PayPay app. The streamlined in-app checkout reduces payment friction for merchants and supports higher conversion in mobile commerce journeys.
Japan Mobile Payments Market Report Scope and Research Methodology
Market Definition and Coverage
We define the Japan mobile payments market as the value of payments initiated on a mobile device and completed through a recognized payment rail, covering both consumer and merchant use cases in Japan, measured in USD for the stated year.
Scope exclusions: We exclude cash payments and non-payment mobile banking activities (such as balance checks) that do not result in a payment transaction.
Segments Covered in This Report
- By Payment Instrument
- PromptPay / RTP Transfers
- Mobile Wallets (e.g., PayPay, Rakuten Pay, d-Barai)
- Card-based Mobile Payments
- Carrier Billing / Others
- By Transaction Channel
- In-store POS
- E-commerce
- P2P Transfers
- Bill and Government Payments
- Cross-border / Tourist
- By Payment Type
- Proximity Payments
- Remote Payments
- By End-User Industry
- Retail and FMCG
- Transportation and Mobility
- Hospitality and Tourism
- Utilities and Telecom
- Healthcare and Education
- Other End-User Industries
Data Sources, Market Sizing, and Validation
Desk Research
Desk work begins by setting clear boundaries for what counts as a mobile payment in Japan, then mapping those boundaries to channels where transaction value can be tracked consistently over time. We leaned on public payment statistics and cashless updates from sources such as the Bank of Japan, Japan's Ministry of Economy, Trade and Industry, Japan's Statistics Bureau, and broader payment frameworks from the Bank for International Settlements.
To keep the estimates anchored, we also reviewed merchant and consumer payment behavior signals from sources such as industry association publications, card scheme and acquirer disclosures, company filings, and investor presentations. In a few places, we used paid subscriptions that compile company financials, news, and patent activity, and we used them only to fill gaps and cross-check timelines, not to set the final market totals. The sources listed here are illustrative, and additional public and proprietary references were used to collect, validate, and clarify the data.
Primary Interviews and Surveys
Primary work focused on confirming how transaction value flows across proximity and remote payments, and how instrument mix changes the implied average ticket size. We spoke with stakeholders across payment acceptance, wallet ecosystems, merchant sectors, and enabling infrastructure. We then used those inputs to validate adoption assumptions for major urban and regional demand pockets in Japan.
Distribution of primary research fieldwork respondents
| Company type | Respondent position |
|---|---|
| Top tier: 34% | CXOs: 16% |
| Mid tier: 50% | Functional/Unit leaders: 39% |
| Smaller Players: 16% | Managers: 45% |
Market-Sizing & Forecasting
Our core model uses a top-down approach, where national cashless payment value, channel splits (in-store POS, e-commerce, P2P, bill and government), and mobile share assumptions are used to reconstruct the mobile payments pool for Japan. We corroborate the outputs using selective bottom-up approximations, such as sampled merchant acceptance checks and wallet driven volume signals, to keep results realistic when public splits are not fully visible.
Key inputs used in the build included smartphone usage as a practical proxy for addressable users, merchant acceptance expansion for QR and contactless, e-commerce spending direction, the mix shift between wallets, card-based mobile payments, and account-to-account transfers, and the expected change in average transaction value as usage moves from smaller everyday purchases into higher value categories. For the forecast, we relied on scenario analysis supported by expert views on adoption speed, merchant incentives, and regulation driven cashless targets, and the variables were stress-tested before finalizing the growth path. Where bottom-up checks had coverage gaps by channel, we applied conservative ranges and then narrowed them after follow-up validation with interviewees.
Data Validation & Update Cycle
Validation is done through multiple checks so the final number is not driven by a single data stream. We compare modeled totals against independent signals like cashless share progress, channel growth, and instrument mix shifts, and we investigate outliers such as sudden changes in average ticket size or a channel growing faster than the overall spending pool.
Before sign-off, the model and assumptions go through multi-step analyst review, and experts are re-contacted if a key input falls outside expected bounds. Reports are refreshed annually, and interim updates are made when material events occur, such as major rule changes, large pricing shifts, or step-changes in adoption. Right before delivery, we run a final pass to ensure the latest public releases and meaningful market moves are reflected.
Mordor Intelligence's Japan Mobile Payments Market Size Measured Against Other Published Estimates
Published market sizes for Japan mobile payments often differ because the included payment instruments and channels are not consistent across studies. Some figures represent transaction value, while others align more closely with revenue pools. Timing also affects comparability, since year-end currency conversion, the exact base year used, and how average transaction value evolves can change a large USD total.
The main gap drivers usually come from whether account-to-account transfers and bill or government payments are counted, and whether cross-border and tourist spend is included in the same bucket. Another common difference is refresh behavior, since newer releases of cashless statistics can materially change the last two years and then feed into the forecast. Mordor Intelligence typically uses a defined currency window, validation checks, and a final lock date, which can result in a different 2025 value compared with estimates that rely on older FX timing or a simplified ticket-size assumption.
Benchmark comparison
| Source | Market Size | Gaps in Research Methodology |
|---|---|---|
| Mordor Intelligence | USD 0.27 T (2025) | |
| Industry Publisher A | USD 1.73 T (2024) | This figure appears to use a broader transaction value pool that can fold in adjacent digital payment flows and may apply a different FX conversion window, which inflates the USD value versus a tighter mobile-initiated definition. |
| Trade Portal B | USD 0.16 T (2024) | This estimate is closer to a mobile money framing and can undercount card-based mobile payments at POS and larger ticket remote commerce, which pulls the total down when compared with a full mobile payments channel set. |
The table shows that the spread is largely explained by scope choices (which instruments and channels are treated as mobile payments) and by how the value is translated into USD for a given year. By keeping the scope rules explicit, checking ticket-size progression against channel behavior, and aligning the timing of inputs, we arrive at a practical number that can be traced back to clear levers and revisited when new statistics are released.
Key Questions Answered in the Report
What is the current value of the Japan mobile payments market?
The market stands at USD 0.36 trillion in 2026 and is projected to reach USD 1.41 trillion by 2031.
Which payment instrument holds the largest share?
Mobile wallets lead with 47.83% of payment instrument volume in 2025.
Which segment is growing fastest through 2031?
Real-time payment transfers are forecast to expand at a 31.76% CAGR.
How will inbound tourism influence payment volumes?
Cross-border and tourist channels are expected to grow at a 31.83% CAGR on the way to the government’s 60 million visitor target.
What restrains small merchants from adopting cashless solutions?
High acquirer fees and outdated point-of-sale hardware remain the most prominent barriers despite subsidy programs.