Market Overview
| Study Period | 2020 - 2030 |
|---|---|
| Base Year For Estimation | 2024 |
| Forecast Data Period | 2025 - 2030 |
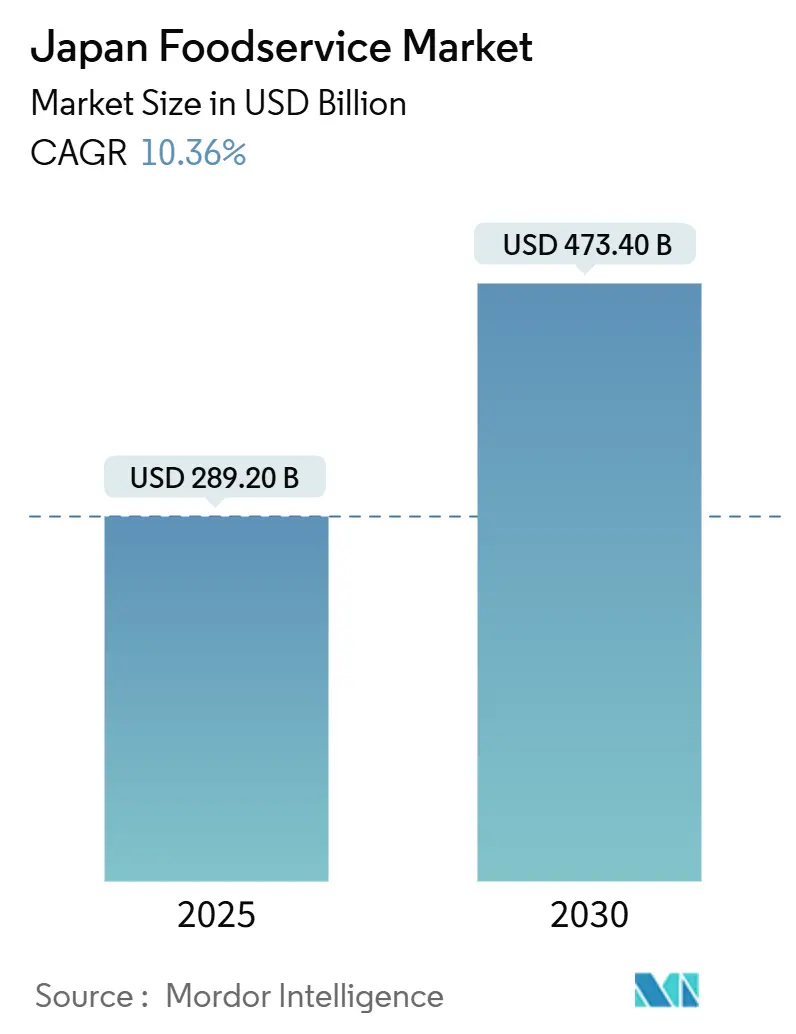
| Market Size (2025) | USD 289.20 Billion |
| Market Size (2030) | USD 473.40 Billion |
| Growth Rate (2025 - 2030) | 10.36% CAGR |
| Market Concentration | Low |
Major Players
*Disclaimer: Major Players sorted in no particular order Image © Mordor Intelligence. Reuse requires attribution under CC BY 4.0. |
|
Japan Foodservice Market Analysis by Mordor Intelligence
The Japan Foodservice Market size is estimated at USD 289.20 billion in 2025, and is expected to reach USD 473.40 billion by 2030, at a CAGR of 10.36% during the forecast period (2025-2030). This exceptional growth trajectory reflects Japan's post-pandemic economic recovery, accelerated by the return of international tourism and widespread digital transformation across the industry. The market's expansion is fundamentally driven by structural shifts in consumer behavior, with busy urban lifestyles fueling demand for convenient dining solutions and the resurgence of inbound tourism creating unprecedented opportunities for authentic culinary experiences [1]Source: Japan National Tourism Organization, "Inbound Tourism", jnto.go.jp. The tourism comeback has lifted spending at restaurants positioned near airports, railway hubs, and key cultural sites, while strong urban wage growth is enabling consumers to trade up to premium coffee, specialty desserts, and experiential full-service formats.Operators are investing in mobile apps, QR-code menus, and in-store robots to confront a historic labor shortfall, and these technologies in turn improve table turns and encourage higher ticket sizes. However, the Japan foodservice market is navigating compressed margins due to higher import costs, persistent wage pressure, and continued dependence on overseas commodities.
Key Report Takeaways
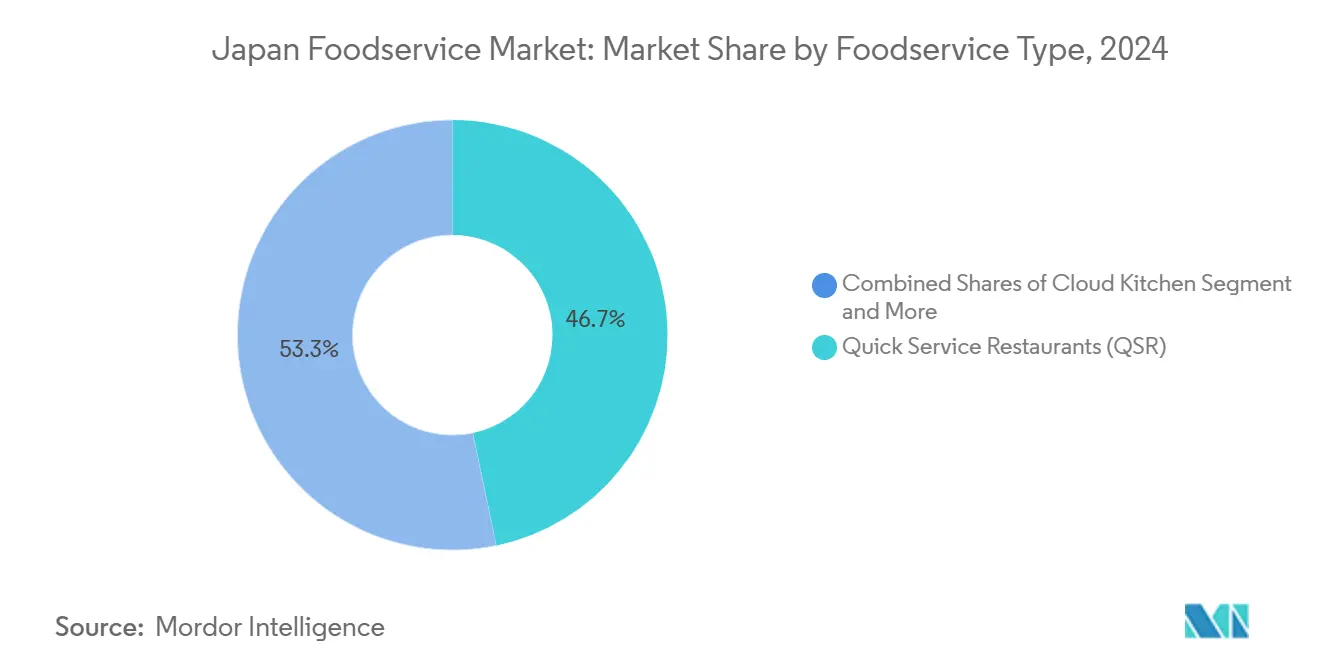
- By foodservice type, Quick Service Restaurants led with 46.72% revenue share in 2024, while Cloud Kitchens are forecast to expand at a 12.03% CAGR through 2030.
- By outlet, independent operators accounted for 75.32% of the Japan foodservice market share in 2024; chained outlets show the fastest growth at 11.25% CAGR to 2030.
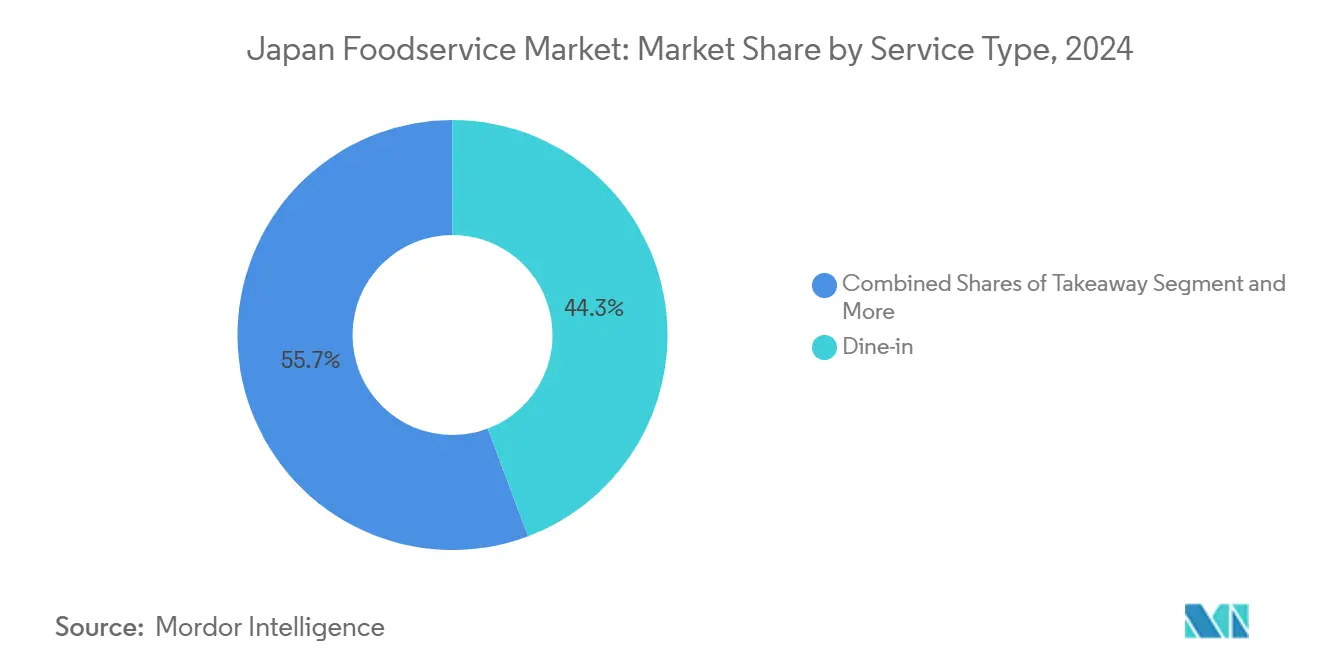
- By service type, dine-in captured 44.27% of spend in 2024; takeaway is set to advance at a 10.87% CAGR over 2025-2030.
- By location, standalone venues commanded 77.36% of sales in 2024, whereas lodging-based venues are projected to grow at a 12.01% CAGR to 2030.
Japan Foodservice Market Trends and Insights
Drivers Impact Analysis
| Driver | (~) % Impact on CAGR Forecast | Geographic Relevance | Impact Timeline |
|---|---|---|---|
| Busy modern life fuels demand for quick convenience | +2.1% | National, concentrated in Tokyo, Osaka, Nagoya metropolitan areas | Short term (≤ 2 years) |
| Global tourism boosts authentic dining experiences | +1.8% | National, with peak impact in Tokyo, Kyoto, Osaka tourist corridors | Medium term (2-4 years) |
| Consumers demand healthier, sustainable, local menus | +1.4% | National, with early adoption in urban centers | Long term (≥ 4 years) |
| Digital apps and in-store robots drive efficiency | +1.6% | National, faster deployment in major metropolitan areas | Medium term (2-4 years) |
| Growing interest in diverse international cuisines | +1.2% | National, concentrated in cosmopolitan urban markets | Long term (≥ 4 years) |
| High-quality pre-prepared meals gain acceptance | +1.0% | National, with stronger penetration in convenience-focused segments | Medium term (2-4 years) |
| Source: Mordor Intelligence | |||
Busy Modern Life Fuels Demand for Quick Convenience
Japan's accelerating urbanization and evolving work culture are fundamentally reshaping dining patterns, with time-pressed consumers increasingly prioritizing convenience over traditional sit-down experiences. The Ministry of Health, Labour and Welfare reported that average working hours in the service sector increased by 3.2% in 2024, while commuting times in major metropolitan areas extended due to hybrid work patterns creating irregular schedules according to the Ministry of Health, Labour and Welfare. This temporal compression is driving explosive growth in grab-and-go formats, mobile ordering systems, and express service concepts that can deliver quality meals within 10-15 minutes. Quick Service Restaurants are responding by redesigning kitchen workflows and implementing AI-powered demand forecasting to reduce wait times, while convenience stores are expanding their prepared food offerings to capture the growing "nakashoku" (eating at home but not cooking) trend. The demographic shift toward single-person households, which now represent 38% of all Japanese households, further amplifies demand for portion-controlled, individually packaged meal solutions that align with busy lifestyle requirements accorign to the Statistics Bureau of Japan.
Global Tourism Boosts Authentic Dining Experiences
The remarkable recovery of Japan's inbound tourism sector is creating unprecedented demand for authentic culinary experiences, with international visitors reaching 25.07 million in 2024, approaching pre-pandemic levels of 31.9 million in 2019 according to the Japan National Tourism Organization. Tourist spending on food and beverage represents approximately 22% of total expenditure, translating to over USD 11 billion in direct market impact, with particularly strong demand for regional specialties and traditional dining formats that offer cultural immersion. The World Travel & Tourism Council projects continued growth in Japanese tourism through 2030, driven by visa liberalization, increased flight capacity, and Japan's positioning as a premium destination for culinary tourism[2]Source: World Travel & Tourism Council, "The World Travel & Tourism Council (WTTC) represents the global Travel & Tourism private sector", wttc.org. Restaurant operators are capitalizing on this trend by developing tourist-specific menu formats with multilingual descriptions, cultural context, and Instagram-worthy presentation that appeals to social media-savvy international visitors. The ripple effect extends beyond tourist hotspots, as domestic consumers increasingly seek out "authentic" experiences inspired by international visitor preferences, creating a halo effect that benefits traditional and regional cuisine segments nationwide.
Consumers Demand Healthier, Sustainable, Local Menus
Health consciousness and environmental sustainability are emerging as primary decision factors for Japanese consumers, particularly among younger demographics who prioritize nutritional transparency and ethical sourcing practices. The Japan Organic & Natural Foods Association reported a 15.3% increase in organic food consumption in 2024, while plant-based menu options expanded across 34% of major restaurant chains [3]Source: Japan Organic & Natural Foods Association, "10/24Seminar on Organic Food Export", jona-japan.org. This shift is compelling operators to redesign menus around locally sourced ingredients, reduce food waste through portion optimization, and implement transparent labeling systems that communicate nutritional and environmental impact information. Regulatory frameworks are evolving to support this trend, with the Ministry of Agriculture, Forestry and Fisheries introducing new certification standards for sustainable restaurant practices and local sourcing verification systems. The economic premium for organic and locally sourced ingredients is being offset by consumer willingness to pay 8-12% higher prices for meals that align with their values, creating sustainable business models for operators who can authenticate their sustainability claims through third-party verification systems.
Digital Apps and In-Store Robots Drive Efficiency
Labor shortages averaging 15-20% across the foodservice sector are accelerating digital transformation initiatives, with operators investing heavily in automation technologies to maintain service levels while controlling costs. Mobile ordering platforms now process over 40% of QSR transactions, while in-store robotics deployments increased by 67% in 2024, led by major chains like Skylark and Saizeriya implementing serving robots and automated cooking systems. AI-powered inventory management systems are reducing food waste by 12-18% while optimizing supply chain efficiency, enabling operators to maintain consistent menu availability despite supply chain disruptions. The integration of contactless payment systems, QR code ordering, and predictive analytics is creating operational efficiencies that translate directly to improved profit margins and customer satisfaction scores. These technological investments are particularly critical given Japan's aging workforce and declining birth rates, which will continue to constrain labor availability throughout the forecast period, making automation adoption a strategic imperative rather than a competitive advantage.
Restraints Impact Analysis
| Restraint | (~) % Impact on CAGR Forecast | Geographic Relevance | Impact Timeline |
|---|---|---|---|
| Increased competition from independent vendors and street-food sellers | -1.3% | National, with higher intensity in urban entertainment districts | Short term (≤ 2 years) |
| Inconsistencies in food safety measures and adherence to hygiene standards | -0.9% | National, with regional variations in enforcement | Medium term (2-4 years) |
| Severe labor shortages strain service capacity | -2.2% | National, most acute in metropolitan areas and rural regions | Long term (≥ 4 years) |
| Reliance on imports creates supply chain fragility | -1.1% | National, with sector-specific vulnerabilities in protein and grain imports | Medium term (2-4 years) |
| Source: Mordor Intelligence | |||
Severe Labor Shortages Strain Service Capacity
Japan's foodservice sector faces an unprecedented labor crisis, with unemployment rates at historic lows of 2.4% and an aging population creating structural workforce constraints that threaten operational capacity across all segments according to the Statistics Bureau of Japan. The industry's labor shortage rate reached 76.2% in 2024, the highest among all service sectors, forcing operators to reduce operating hours, limit menu complexity, and implement significant wage increases that compress profit margins. Average hourly wages in foodservice increased by 8.7% in 2024, outpacing inflation and creating cost pressures that smaller independent operators struggle to absorb without raising menu prices. The demographic challenge is compounded by cultural factors, as younger workers increasingly avoid foodservice careers due to demanding schedules and limited advancement opportunities, creating a vicious cycle of understaffing and operational stress. Compliance with Japan's revised Labor Standards Act, which limits overtime and mandates rest periods, further constrains operational flexibility while increasing labor costs per hour worked.
Reliance on Imports Creates Supply Chain Fragility
Japan's food self-sufficiency rate of only 38% creates significant vulnerability to global supply chain disruptions, commodity price volatility, and geopolitical tensions that can rapidly impact foodservice operators' cost structures and menu availability. The yen's weakness against major currencies increased food import costs by an average of 12.8% in 2024, with pressure on wheat, soybeans, and meat products that form the foundation of many restaurant menus. Supply chain disruptions from climate events, trade disputes, and shipping constraints have forced operators to maintain higher inventory levels and develop alternative sourcing strategies, both of which increase working capital requirements and operational complexity. The concentration of import dependencies in specific commodities creates systemic risks, as disruptions to key suppliers can simultaneously impact multiple operators and segments, leading to coordinated price increases that reduce consumer demand and market growth potential.
Segment Analysis
By Foodservice Type: QSR Dominance Accelerates Digital Innovation
Quick Service Restaurants command a dominant 46.72% market share in 2024, reflecting Japanese consumers' increasing preference for speed, convenience, and value-oriented dining experiences. Cloud Kitchens emerge as the fastest-growing segment with a 12.03% CAGR through 2030, driven by delivery demand and operators' need to reduce real estate costs while expanding geographic reach. Full Service Restaurants maintain steady performance despite labor constraints, with Asian cuisine concepts particularly benefiting from tourism recovery and domestic interest in regional specialties. The QSR segment's growth is accelerated by successful digital transformation initiatives, including mobile ordering platforms that now process 43% of transactions and AI-powered kitchen automation that reduces labor requirements by up to 30%.
Café and Bars segment benefits from Japan's evolving coffee culture and after-work socializing patterns, with specialty coffee shops experiencing particular strength as consumers seek premium experiences and Instagram-worthy environments. The segment's performance is supported by the growing acceptance of higher price points for artisanal products and the expansion of third-wave coffee concepts that emphasize origin transparency and brewing expertise. Cloud Kitchen operators are leveraging technology to optimize delivery routes and reduce food preparation times, enabling them to capture market share from traditional dine-in establishments while maintaining higher profit margins through reduced overhead costs.
Note: Segment shares of all individual segments available upon report purchase
Get Detailed Market Forecasts at the Most Granular Levels
Download PDF
By Outlet: Independent Resilience Meets Chain Efficiency
Independent outlets maintain a commanding 75.32% market share in 2024, demonstrating the enduring appeal of personalized service, local specialties, and community connections that characterize Japan's traditional dining culture. However, chained outlets are expanding rapidly at 11.25% CAGR through 2030, leveraging operational efficiencies, standardized processes, and technology investments to combat labor shortages and supply chain challenges more effectively than smaller operators. The competitive dynamics reflect a fundamental tension between authenticity and efficiency, with independent operators offering unique culinary experiences while chains provide consistency and convenience that appeals to time-pressed consumers.
Chained outlets benefit from economies of scale in procurement, technology deployment, and staff training, enabling them to maintain service levels despite labor constraints while offering competitive pricing. The recent wave of M&A activity, including Skylark's acquisition of Suisan Udon for JPY 24 billion (USD 160 million) in September 2024, demonstrates chains' strategic focus on expanding market presence through acquisition rather than organic growth. Independent operators are responding by forming purchasing cooperatives, adopting shared technology platforms, and developing niche positioning strategies that emphasize artisanal quality and local sourcing to differentiate from standardized chain offerings.
By Service Type: Takeaway Surge Reshapes Operations
Dine-in experiences maintain the largest market share at 44.27% in 2024, reflecting Japanese cultural preferences for social dining and the experiential value of restaurant atmospheres. Takeaway services represent the fastest-growing segment at 10.87% CAGR through 2030, driven by convenience demands, time constraints, and the normalization of off-premise consumption patterns established during the pandemic according to the Japan Food Service Association. Delivery services continue expanding but face profitability challenges due to commission fees and logistics costs that compress operator margins. The service type evolution is forcing fundamental operational changes, with restaurants redesigning kitchen workflows to accommodate multiple fulfillment channels and investing in packaging solutions that maintain food quality during transport.
The growth in takeaway and delivery is supported by digital platform proliferation and consumer comfort with mobile ordering systems, which now account for over 35% of off-premise orders. Operators are optimizing menu offerings for each service type, with takeaway-specific items designed for portability and delivery menus focused on items that travel well and maintain temperature. The Ministry of Health, Labour and Welfare's food safety guidelines for delivery services require specific temperature control and packaging standards, creating compliance costs but ensuring consumer confidence in off-premise dining options according to the Ministry of Health, Labour and Welfare.
Note: Segment shares of all individual segments available upon report purchase
Get Detailed Market Forecasts at the Most Granular Levels
Download PDF
By Locations: Standalone Strength Amid Lodging Recovery
Standalone locations dominate with 77.36% market share in 2024, reflecting Japan's neighborhood-centric dining culture and the prevalence of independent operators who prefer street-level visibility and direct customer relationships. Lodging-based establishments represent the fastest-growing location segment at 12.01% CAGR through 2030, directly benefiting from tourism recovery as hotel occupancy rates approach pre-pandemic levels and international visitors seek convenient dining options within their accommodations. Retail locations maintain steady performance, supported by shopping center foot traffic and the integration of dining with retail experiences that appeal to family consumers and tourists.
Travel locations, including airports and train stations, are experiencing robust recovery as domestic and international travel normalizes, with operators investing in express service formats that cater to time-sensitive travelers. The location-based performance differences reflect varying recovery patterns, with lodging and travel segments benefiting most directly from tourism resurgence while standalone and retail locations depend more on local consumer spending patterns. Leisure locations face mixed performance, with some entertainment districts experiencing strong recovery while others struggle with changed consumer behavior patterns and reduced after-work socializing among office workers who continue hybrid work arrangements.
Competitive Landscape
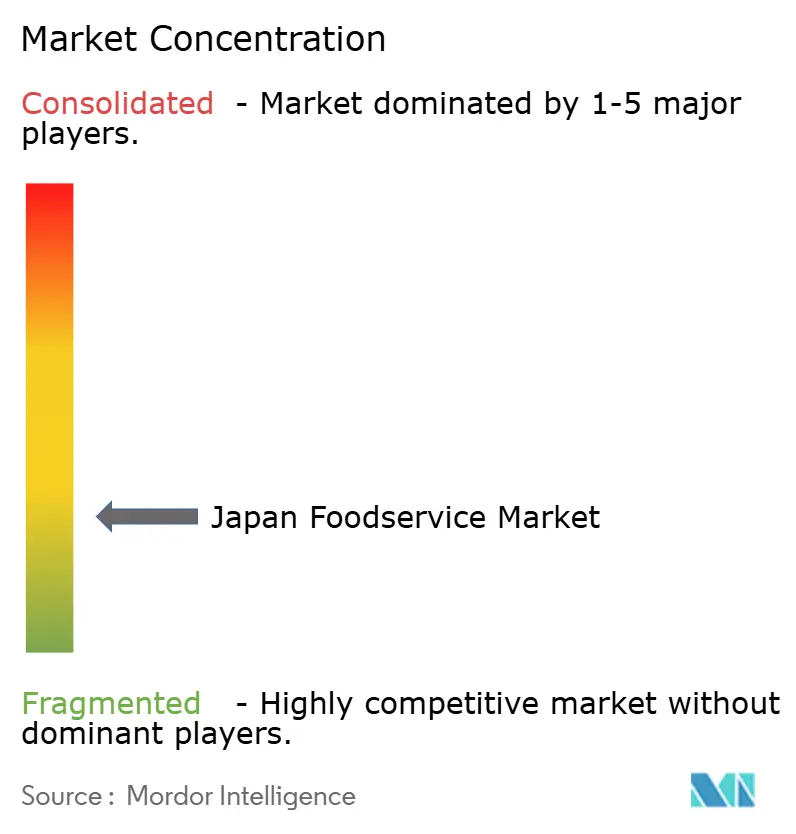
The Japan foodservice market exhibits moderate fragmentation with a concentration, creating a competitive environment where numerous players compete across multiple segments without clear dominant leaders. This fragmentation reflects the market's diversity, with different competitive dynamics in QSR versus full-service segments, and significant variation between urban and rural markets where local preferences and operational requirements differ substantially.
Major international chains like McDonald's, Starbucks, and Domino's compete alongside established Japanese operators such as Zensho Holdings, Skylark, and Yoshinoya, while thousands of independent operators maintain strong local market positions through specialized offerings and community relationships. Opportunities exist in underserved rural markets, emerging format concepts like cloud kitchens, and the intersection of health-conscious dining with convenience-oriented service models that appeal to Japan's aging population and busy urban professionals.
Strategic patterns reveal increasing focus on technology adoption, operational efficiency, and format innovation as competitive differentiators, with successful operators investing heavily in automation, digital ordering systems, and supply chain optimization to address labor shortages and cost pressures. The recent wave of consolidation activity, exemplified by Saint Marc Holdings' acquisition of G-Holdings for JPY 11.2 billion (USD 75 million) in November 2024, demonstrates how operators are pursuing scale advantages through strategic acquisitions rather than organic expansion.
Japan Foodservice Industry Leaders
-
Yum! Brands Inc.
-
MOS FOOD SERVICES, INC.
-
McDonald's
-
Zensho Holdings Co., Ltd.
-
Skylark Holdings Co., Ltd.
- *Disclaimer: Major Players sorted in no particular order
Need More Details on Market Players and Competitors?
Download PDF
Recent Industry Developments
- October 2025: McDonald's celebrated all things Street Fighter with a series of Street Burgers menu items. McDonald's released a series of promo videos, which merged the original arcade graphics of Street Fighter II with fresh sprite art based on McDonald's grub.
- April 2025: McDonald's Live Party was a first-of-its-kind campaign, which seamlessly integrated fandom culture, digital commerce, and interactive live experiences. The platform marked McDonald's Japan's first major initiative aimed at Gen Z, strategically designed to expand usage of Mobile Order & Pay, which represented 20% of transactions – one of the highest adoption rates among global McDonald's markets.
- April 2024: Kura Sushi, Inc., which operated the conveyor-belt sushi chain "Kura Sushi," announced the opening of "Kura Sushi Global Flagship Store Ginza," its sixth global flagship store in Japan, on Thursday, April 25, 2024, inside Marronnier Gate Ginza 2. The store was produced by Kashiwa Sato, one of Japan's top creative directors, and became the first location of a major conveyor-belt sushi chain to open in the Ginza area.
Japan Foodservice Market Report Scope
Cafes & Bars, Cloud Kitchen, Full Service Restaurants, Quick Service Restaurants are covered as segments by Foodservice Type. Chained Outlets, Independent Outlets are covered as segments by Outlet. Leisure, Lodging, Retail, Standalone, Travel are covered as segments by Location.
By Foodservice Type
| Café and Bars | By Cuisine | Bars & Pubs |
| Café | ||
| Juice/Smoothie/Desserts Bars | ||
| Specialist Coffee & Tea Shops | ||
| Cloud Kitchen | ||
| Full Service Restaurants | By Cuisine | Asian |
| European | ||
| Latin American | ||
| Middle Eastern | ||
| North American | ||
| Other FSR Cuisines | ||
| Quick Service Restaurants | By Cuisine | Bakeries |
| Burger | ||
| Ice Cream | ||
| Meat-based Cuisines | ||
| Pizza | ||
| Other QSR Cuisines |
By Outlet
| Chained Outlets |
| Independent Outlets |
By Locations
| Leisure |
| Lodging |
| Retail |
| Sandalone |
| Travel |
By Service Type
| Dine-in |
| Takeaway |
| Delivery |
| By Foodservice Type | Café and Bars | By Cuisine | Bars & Pubs |
| Café | |||
| Juice/Smoothie/Desserts Bars | |||
| Specialist Coffee & Tea Shops | |||
| Cloud Kitchen | |||
| Full Service Restaurants | By Cuisine | Asian | |
| European | |||
| Latin American | |||
| Middle Eastern | |||
| North American | |||
| Other FSR Cuisines | |||
| Quick Service Restaurants | By Cuisine | Bakeries | |
| Burger | |||
| Ice Cream | |||
| Meat-based Cuisines | |||
| Pizza | |||
| Other QSR Cuisines | |||
| By Outlet | Chained Outlets | ||
| Independent Outlets | |||
| By Locations | Leisure | ||
| Lodging | |||
| Retail | |||
| Sandalone | |||
| Travel | |||
| By Service Type | Dine-in | ||
| Takeaway | |||
| Delivery | |||
Need A Different Region or Segment?
Customize Now
Market Definition
- FULL-SERVICE RESTAURANTS - A foodservice establishment where customers are seated at a table, give their order to a server and are served food at a table.
- QUICK SERVICE RESTAURANTS - A foodservice establishment that provides customers convenience, speed, and food offerings at lower prices. Customers usually help themselves and carry their own food to their tables.
- CAFES & BARS - A type of foodservice business that include bars and pubs that are licensed to serve alcoholic drinks for consumption, cafes that serve refreshments and light food items, as well as specialty tea and coffee shops, dessert bars, smoothie bars, and juice bars.
- CLOUD KITCHEN - A foodservice business that utilizes a commercial kitchen for the purpose of preparing food for delivery or takeout only, with no dine-in customers.
| Keyword | Definition |
|---|---|
| Albacore Tuna | It is one of the smallest species of tuna found in the six distinct stocks known globally in the Atlantic, Pacific, and Indian oceans, as well as the Mediterranean Sea. |
| Angus beef | It is beef derived from a specific breed of cattle indigenous to Scotland. It requires certification from the American Angus Association to receive the "Certified Angus Beef" quality mark. |
| Asian cuisine | It includes full-service offerings in restaurants that serve cuisines from cultures such as Chinese, Indian, Korean, Japanese, Bengali, Southeast Asian, etc. |
| Average Order Value | It is the average value of all orders made by the customers at a foodservice establishment. |
| Bacon | It is salted or smoked meat that comes from the back or sides of a pig. |
| Bars & Pubs | It is a drinking establishment that is licensed to serve alcoholic drinks for consumption on the premises. |
| Black Angus | It is beef derived from a black-hided breed of cows that don't have horns. |
| BRC | British Retail Consortium |
| Burger | It is a sandwich consisting of one or more cooked beef patties, placed inside a sliced bread roll or bun roll. |
| Café | It is a foodservice establishment serving various refreshments (mainly coffee) and light meals. |
| Cafes & Bars | It is a type of foodservice business that include bars and pubs that are licensed to serve alcoholic drinks for consumption, cafes that serve refreshments and light food items, as well as specialty tea and coffee shops, dessert bars, smoothie bars, and juice bars. |
| Cappuccino | It is an Italian coffee drink that is traditionally prepared with equal parts double espresso, steamed milk, and steamed milk foam. |
| CFIA | Canadian Food Inspection Agency |
| Chained Outlet | It refers to a foodservice establishment that shares brands, operates in several locations, has central management, and standardized business practices. |
| Chicken Tender | It refers to chicken meat prepared from the pectoralis minor muscles of a chicken bird. |
| Cloud Kitchen | It is a foodservice business that utilizes a commercial kitchen for the purpose of preparing food for delivery or takeout only, with no dine-in customers. |
| Cocktail | It is an alcoholic mixed drink made with either a single spirit or a combination of spirits, mixed with other ingredients such as juices, flavored syrups, tonic water, shrubs, and bitters. |
| Edamame | It is a Japanese dish prepared with soybeans (harvested before they ripen or harden) and cooked in its pod. |
| EFSA | European Food Safety Authority |
| ERS | Economic Research Service of the USDA |
| Espresso | It is a concentrated form of coffee, served in shots. |
| European cuisine | It includes full-service offerings in restaurants that serve cuisines from cultures such as Italian, French, German, English, Dutch, Danish, etc. |
| FDA | Food and Drug Administration |
| Fillet Mignon | It is a cut of meat taken from the smaller end of the tenderloin. |
| Flank Steak | It is a cut of beef steak taken from the flank, which lies forward of the rear quarter of a cow. |
| Foodservice | It refers to the part of the food industry which includes businesses, institutions, and companies which prepare meals outside the home. It includes restaurants, school and hospital cafeterias, catering operations, and many other formats. |
| Franks | Also known as frankfurter or Würstchen, it is a type of highly seasoned smoked sausage popular in Austria and Germany. |
| FSANZ | Food Standards Australia New Zealand |
| FSIS | Food Safety and Inspection Service |
| FSSAI | Food Safety and Standards Authority of India |
| Full service restaurant | It refers to a foodservice establishment where customers are seated at a table, give their order to a server, and are served food at a table. |
| Ghost Kitchen | It refers to a cloud kitchen. |
| GLA | Gross Leasable Area |
| Gluten | It is a family of proteins found in grains, including wheat, rye, spelt, and barley. |
| Grain-fed beef | It is beef derived from cattle that have been fed a diet supplemented with soy and corn and other additives. Grain-fed cows can also be given antibiotics and growth hormones to fatten them up more quickly. |
| Grass-fed beef | It is beef derived from cattle that have only been fed grass as feed. |
| Ham | It refers to the pork meat taken from the leg of a pig. |
| HoReCa | Hotels, Restaurants and Cafes |
| Independent Outlet | It refers to a foodservice establishment that operates with a single outlet or is structured as a small chain with no more than three locations. |
| Juice | It is a drink made from the extraction or pressing of the natural liquid contained in fruit and vegetables. |
| Latin American | It includes full-service offerings in restaurants that serve cuisines from cultures such as Mexican, Brazilian, Argentinian, Colombian, etc. |
| Latte | It is a milk-based coffee that is made up of one or two shots of espresso, steamed milk, and a thin layer of frothed milk. |
| Leisure | It refers to foodservice offered as a part of a recreation business, such as sports arenas, zoos, movie theaters, and museums. |
| Lodging | It refers to foodservice offerings at hotels, motels, guesthouses, holiday homes, etc. |
| Macchiato | It is an espresso coffee drink with a small amount of milk, usually foamed. |
| Meat-based cuisines | This inlcudes food items like fried chicken, steak, ribs, etc. where meat is the primary ingredient for the dish. |
| Middle Eastern cuisine | It includes full-service offerings in restaurants that serve cuisines from cultures such as Arabic, Lebanese, Iranian, Israeli, etc. |
| Mocktail | It is an non-alcoholic mixed drink. |
| Mortadella | It is a large Italian sausage or luncheon meat made of finely hashed or ground heat-cured pork, which incorporates at least 15% small cubes of pork fat. |
| North American | It includes full-service offerings in restaurants that serve cuisines from cultures such as American, Canadian, Caribbean, etc. |
| Pastrami | It refers to a highly seasoned smoked beef, typically served in thin slices. |
| PDO | Protected Designation of Origin: It is the name of a geographical region or specific area that is recognized by official rules to produce certain foods with special characteristics related to location. |
| Pepperoni | It is an American variety of spicy salami made from cured meat. |
| Pizza | It is a dish made typically of flattened bread dough spread with a savory mixture usually including tomatoes and cheese and often other toppings and baked. |
| Primal cuts | It refers to the major sections of the carcass. |
| Quick service restaurant | It refers to a foodservice establishment that provides customers convenience, speed, and food offerings at lower prices. Customers usually help themselves and carry their own food to their tables. |
| Retail | It refers to a foodservice outlet inside a mall. shopping complex or a commercial real estate building, where there are other businesses operating as well. |
| Salami | It is a cured sausage consisting of fermented and air-dried meat. |
| Saturated fat | It is a type of fat in which the fatty acid chains have all single bonds. It is generally considered unhealthy. |
| Sausage | It is a meat product made of finely chopped and seasoned meat, which may be fresh, smoked, or pickled and which is then usually stuffed into a casing. |
| Scallop | It is an edible shellfish that is a mollusk with a ribbed shell in two parts. |
| Seitan | It is a plant-based meat substitute made out of wheat gluten. |
| Self-service kiosk | It refers to a self-order point-of-sale (POS) system through which customers place and pay for their own orders at kiosks, enabling totally contactless and frictionless service. |
| Smoothie | It is a beverage made by placing all the ingredients in a container and processing them together, without removing the pulp. |
| Specialty coffee & tea shops | It refers to a foodservice establishment that serves only various types of tea or coffee. |
| Standalone | It refers to a restaurants that have an independent infrastructure setup and not connected to any other business. |
| Sushi | It is a Japanese dish of prepared vinegared rice, usually with some sugar and salt, accompanied by a variety of ingredients, such as seafood—often raw—and vegetables. |
| Travel | It refers to foodservice offerings such as airplane food, dining on long-distance trains, and foodservice on cruise ships. |
| Virtual Kitchen | It refers to a cloud kitchen. |
| Wagyu Beef | It is beef derived from any of four strains of a breed of black or red Japanese cattle that are valued for their highly marbled meat. |
Need More Details on Market Definition?
Ask a Question
Research Methodology
Mordor Intelligence follows a four-step methodology in all our reports.
- Step-1: Identify Key Variables: In order to build a robust forecasting methodology, the variables and factors identified in Step 1 are tested against available historical market numbers. Through an iterative process, the variables required for the market forecast are set, and the model is built on the basis of these variables.
- Step-2: Build a Market Model: Market size estimations for the forecast years are in nominal terms. Inflation is considered for average order value, and it is forecasted as per predicted inflation rates in the countries.
- Step-3: Validate and Finalize: In this important step, all market numbers, variables, and analyst calls are validated through an extensive network of primary research experts from the market studied. The respondents are selected across levels and functions to generate a holistic picture of the market studied.
- Step-4: Research Outputs: Syndicated Reports, Custom Consulting Assignments, Databases & Subscription Platforms

Get More Details On Research Methodology
Download PDF


