
Market Overview
| Study Period | 2020 - 2031 |
|---|---|
| Forecast Data Period | 2026 - 2031 |
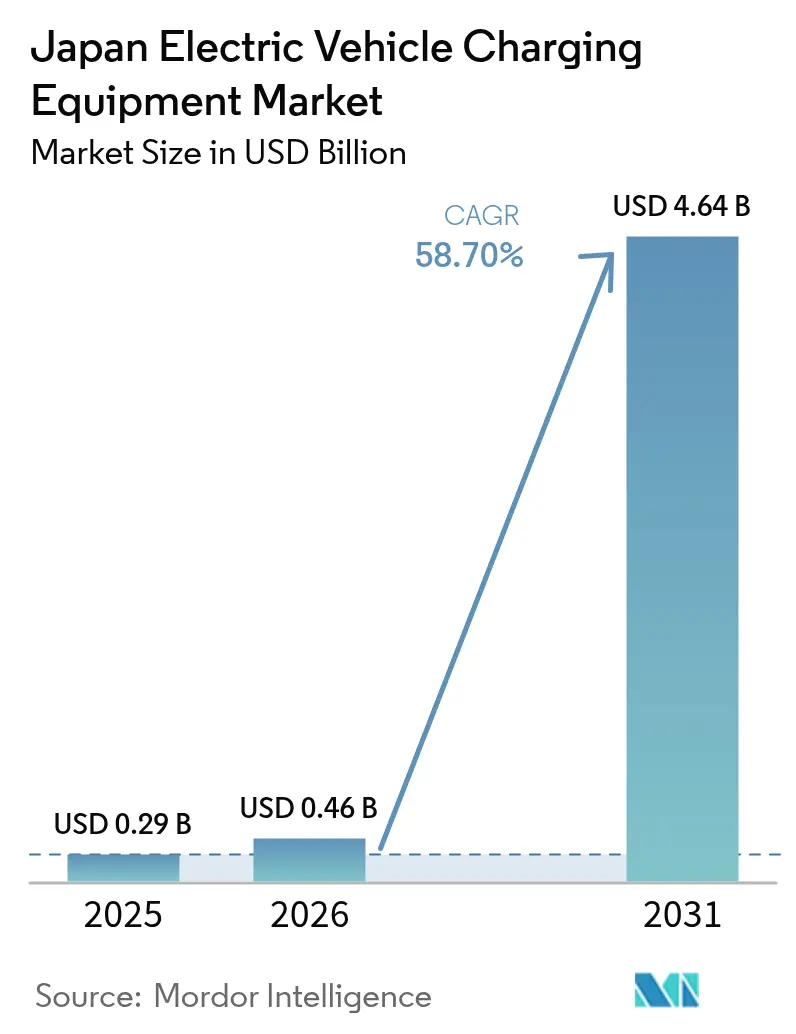
| Base Year Market Size (2025) | USD 0.29 Billion |
| Market Size (2026) | USD 0.46 Billion |
| Market Size (2031) | USD 4.64 Billion |
| Growth Rate (2026 - 2031) | 58.70 % |
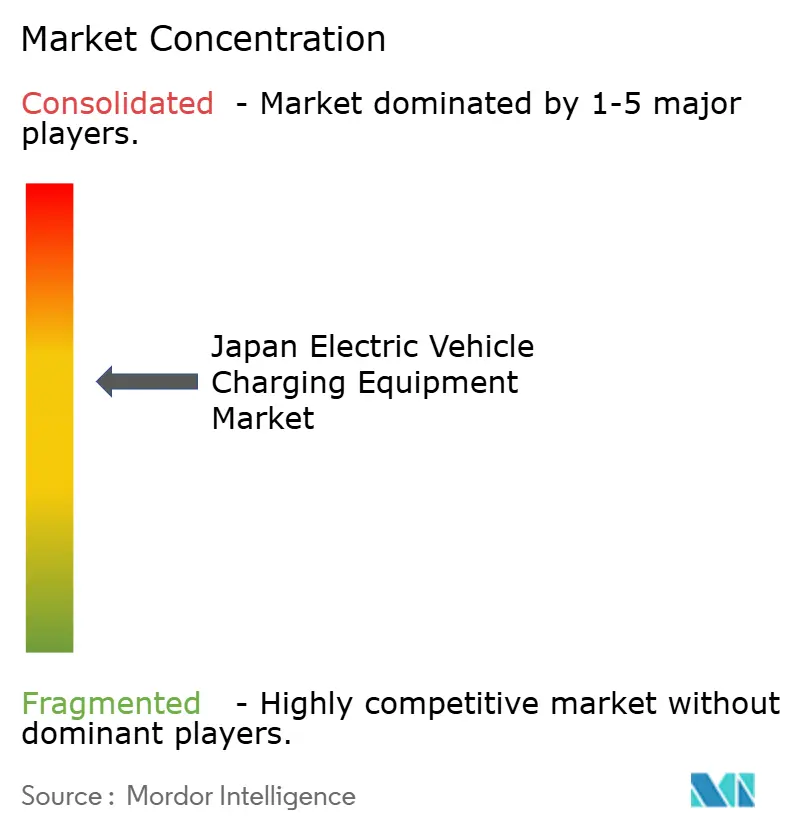
| Market Concentration | Medium |
Major Players *Disclaimer: Major Players sorted in no particular order Image © Mordor Intelligence. Reuse requires attribution under CC BY 4.0. | |
Japan Electric Vehicle Charging Equipment Market Analysis by Mordor Intelligence
The Japan EV charging equipment market size was valued at USD 0.29 billion in 2025 and estimated to grow from USD 0.46 billion in 2026 to reach USD 4.64 billion by 2031, at a CAGR of 58.70% during the forecast period (2026-2031). The Japan EV charging equipment market is propelled by the 2035 gasoline-vehicle sales ban, heavy green-growth spending, and nationwide integration of bidirectional chargers into the power system. Corporate electrification mandates issued by major keiretsu groups give the Japan EV charging equipment market an unusually predictable demand base, allowing faster network build-outs and earlier scale economies than consumer-led models. Technology advances—especially liquid-cooled cords, composite cables, and next-generation CHAdeMO/ChaoJi protocols—position equipment as grid assets rather than simple refueling hardware. Policy coherence between ministries and prefectures sustains subsidy pipelines that narrow payback periods, while component innovation drives total cost of ownership down. Although the Japan EV charging equipment market remains moderately fragmented, utilities have emerged as pivotal ecosystem orchestrators that unlock new revenue through demand-response programs
Key Report Takeaways
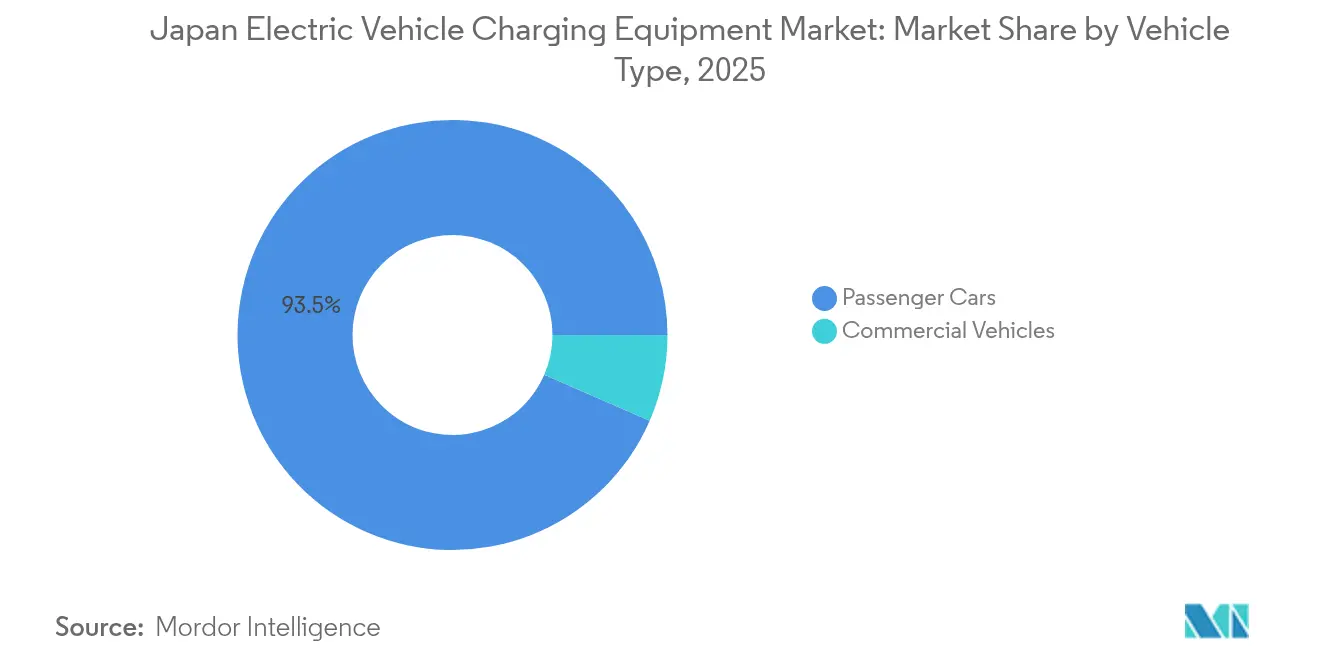
- By vehicle type, passenger cars led the Japan electric vehicle charging equipment market with 93.48% market share in 2025, while commercial vehicles are projected to expand at a 64.30% CAGR through 2031.
- By charging equipment, the Others category charging equipment (terminal blocks, energy meters, safety mechanisms, etc.) held a 33.62% share of the Japan electric vehicle charging equipment market in 2025, and cords & cables are slated for the fastest 63.90% CAGR to 2031.
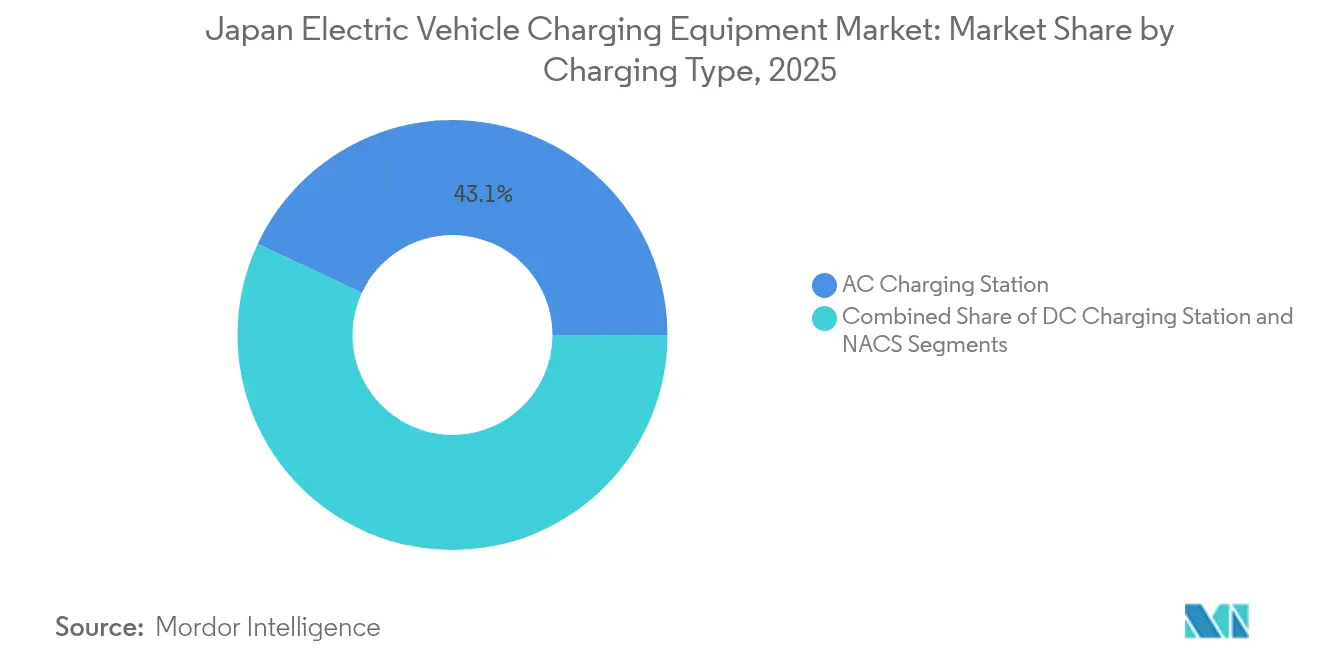
- By charging type, AC stations captured a 43.05% of the Japan electric vehicle charging equipment market in 2025 and are forecast to grow at a 64.70% CAGR through 2031.
- By application type, home charging commanded an 82.95% of the Japan electric vehicle charging equipment market share in 2025, whereas public charging is anticipated to surge at a 91.80% CAGR through 2031.
Note: Market size and forecast figures in this report are generated using Mordor Intelligence’s proprietary estimation framework, updated with the latest available data and insights as of 2026.
Japan Electric Vehicle Charging Equipment Market Trends and Insights
Drivers Impact Analysis*
| Driver | (~) % Impact on CAGR Forecast | Geographic Relevance | Impact Timeline |
|---|---|---|---|
| 2035 Gasoline-Car Sales Ban | +12.8% | Tokyo, Kanagawa, Osaka, Aichi | Long term (≥ 4 years) |
| ESG-Fleet Electrification Mandates | +8.5% | Tokyo, Kanagawa, Osaka | Medium term (2-4 years) |
| METI's Green Growth Fund | +6.2% | Tokyo, Kanagawa, Aichi, Fukuoka | Short term (≤ 2 years) |
| V2H (Vehicle-To-Home) Tariff | +4.1% | Tokyo, Kanagawa, Chiba, Saitama | Medium term (2-4 years) |
| Demand for Bidirectional Chargers | +3.9% | Yamanashi, Miyazaki, Kochi, Tokushima | Long term (≥ 4 years) |
| On-Street Charger Pilots | +2.7% | Osaka, Kyoto, Hyogo | Short term (≤ 2 years) |
| Source: Mordor Intelligence | |||
EV-Shift Stimulus From Japan’s 2035 Gasoline-Car Sales Ban
The ban removes policy ambiguity and accelerates equipment investment because Japanese EV charging equipment market suppliers can confidently model ten-year cash flows. The Japanese government has earmarked trillions for charging build-outs and set a 300,000-public-port target by 2030, an almost eight-fold expansion. Commercial fleets must also comply, triggering immediate depot-charging demand that underpins the Japan EV charging equipment market’s significant CAGR. Tokyo and adjacent prefectures attract the bulk of early funding, reflecting population density and corporate head-office concentration.
Corporate ESG-Fleet Electrification Mandates By Keiretsu Groups
In Japan, the distinctive keiretsu system shifts electric vehicle (EV) adoption from mere consumer choices to unified corporate strategies, leading to unique infrastructure demand patterns not seen in Western markets. Some Japanese companies have pledged to have fully electrified commercial fleets by 2030, locking in long-term charger contracts at factories and logistics hubs. Scale advantages lower per-port installation costs and accelerate return on investment, especially in the Kanto and Kansai economic belts.
Subsidized High-Power Charger Grants Under METI’s Green Growth Fund
Japan’s subsidy program for FY2024-2025 specifically targets high-power charging infrastructure, addressing the critical gap between current AC-dominant installations and future fast-charging requirements. The program's focus on 150kW+ installations signals Japan's strategic shift toward supporting longer-distance travel and commercial vehicle operations, areas where current infrastructure remains inadequate. Grant rules demand grid-integration functions, giving domestic power-electronics makers a head start. Concentrated subsidies in Tokyo, Aichi, and Fukuoka lift utilization and shorten payback to under four years.
V2H Tariff Premiums from Power Utilities
Power utilities treat EV batteries as distributed storage that can feed the grid when wholesale spot prices spike. Under new dynamic-pricing plans, households with bidirectional chargers earn significantly per kWh exported during evening peaks. The arbitrage opportunity shortens payback on a residential 7 kW wall box to under three years, strengthening the consumer business case for the Japanese EV charging equipment market. Utilities also avoid costly gas-turbine starts by tapping aggregated vehicle capacity, which helps them meet carbon-intensity caps without investing in standalone batteries. Prefectures around Tokyo lead subscription growth because they combine high rooftop-solar penetration with stringent grid-stability targets[1].
Restraints Impact Analysis*
| Restraint | (~) % Impact on CAGR Forecast | Geographic Relevance | Impact Timeline |
|---|---|---|---|
| Slow Condominium Retrofit Approvals | -3.2% | Tokyo, Kanagawa, Osaka, Kyoto | Long term (≥ 4 years) |
| High Land-Lease Costs | -2.8% | Tokyo, Kanagawa, Osaka, Aichi | Medium term (2-4 years) |
| CHAdeMO / CCS / NACS Standard Fragmentation | -1.9% | Tokyo, Kanagawa, Osaka, Aichi | Medium term (2-4 years) |
| Low Rural Utilization Rates | -1.4% | Hokkaido, Tohoku, Kyushu rural areas | Long term (≥ 4 years) |
| Source: Mordor Intelligence | |||
Slow Condominium Retrofit Approvals Under the Building Management Act
Japan's Building Management Act mandates unanimous consent from all condominium owners for major electrical modifications. This requirement poses significant hurdles for installing residential charging stations, especially in urban areas dominated by condominium living. While the Act was crafted for traditional building modifications, it fails to address the nuances of EV infrastructure deployment. Here, decisions made by individual owners can have far-reaching implications on the building's overall electrical capacity and safety systems. As EV adoption surges, these constraints intensify, leading to infrastructure bottlenecks. Consequently, many new EV owners are pushed towards public charging solutions, which inflate operational costs and dampen the appeal of EV adoption.
High Land-Lease Costs for Public Fast-Charging Sites Near Expressways
Prime spots for public fast-charging stations, especially those close to expressways and urban hubs, come with steep land lease rates. These premiums challenge the profitability of charging operators, even with high utilization rates. In metropolitan areas, costs soar even higher. This financial strain nudges operators towards secondary locations that lack visibility and accessibility. Such a shift diminishes network convenience and hampers adoption rates, especially among consumers wary of range limitations. This challenge is most pronounced in the deployment of DC fast-charging stations. Their higher power demands lead to heftier infrastructure investments, which operators must recoup over fewer charging sessions than AC installations.
*Our forecasts treat driver/restraint impacts as directional, not additive. The impact forecasts reflect baseline growth, mix effects, and variable interactions.
Segment Analysis
By Vehicle Type: Corporate Fleets Reshape Equipment Demand
Passenger cars held a 93.48% Japan EV charging equipment market share in 2025, furnishing the baseline load for most public networks. Commercial vehicles, however, post a 64.30% CAGR that pulls equipment makers toward depot-grade DC blocks and advanced load-scheduling software. Fleet electrification contracts are typically multi-year, letting suppliers lock in recurring maintenance revenue and forecast parts demand more accurately. Logistics firms like Yamato and Sagawa deploy megawatt hubs that double as micro-grids, using stationary batteries to shave peak demand and sell ancillary services to utilities. These large installations create spillover benefits for retail drivers when operators open excess nighttime capacity to the public.
The corporate pivot also drives connector durability and payment integration innovation because fleet use cases require thousands of mating cycles and centralized billing. Higher throughput accelerates hardware replacement cycles, expanding the aftermarket for cables, seals, and switchgear. Suppliers that bundle hardware with SaaS fleet dashboards gain margin insulation because software churn remains low once integrated into logistics workflows. As corporate adoption scales, the commercial share of the Japan EV charging equipment market size is expected to rise, even if passenger cars remain numerically dominant.

By Charging Equipment: Cords & Cables Outpace Legacy Pillars
The Others (terminal blocks, energy meters, safety mechanisms, etc.) category held 33.62% of the Japan EV charging equipment market share in 2025, but cords and cables are forecast to grow at a 63.90% CAGR. Lightweight composite sheathing cuts cable mass by 40%, mitigating ergonomic strain and reducing maintenance calls linked to dropped connectors. Domestic firms co-develop these designs with resin suppliers, securing exclusive supply contracts that shore up margins. Component scale economies lower per-unit cost significantly, widening adoption among small independent operators.
Traditional pedestal pillars face urban footprint constraints, prompting vendors to roll out slimline wall-mounts that bolt onto existing parking-lot lighting poles. Power supplies and control boards track the overall growth of Japan's EV charging equipment market size but gain an incremental bump from silicon-carbide MOSFET adoption, significantly improving conversion efficiency. Interoperability upgrades follow CHAdeMO’s ChaoJi roadmap, ensuring new hardware remains backward-compatible with earlier vehicles. Suppliers that offer end-to-end hardware suites win municipal tenders because bundling simplifies procurement audits. The component race thus underscores how incremental engineering tweaks can swing large revenue pools in a fast-scaling market.
By Charging Type: AC Dominance Reinforced By Bidirectional Value
AC stations commanded 43.05% of Japan's EV charging equipment market share in 2025 and will expand at a 64.70% CAGR as household V2H use cases multiply. Residential units now ship with factory-flashed firmware enabling 20 kW export, enough to cover peak evening loads for a typical Japanese apartment building’s common areas. Utilities reward bidirectional participation, offsetting longer charge durations than DC. The extra functionality increases equipment utilization even when vehicles are parked, turning idle time into revenue for both owner and operator. In suburban prefectures, builders integrate AC wall boxes into new-home packages, adding only around 1% to construction cost yet boosting property value.
DC fast chargers retain primacy along expressways and fleet depots, where turnaround time dictates route economics. Silicon-carbide power modules and liquid-cooled cables allow significant throughput that recharges next-gen 100 kWh packs in under 10 minutes. However, grid upgrades lag in historic downtowns, funneling investment toward outer-ring logistics parks with ample capacity. The NACS protocol remains under evaluation; pilot adapters from Panasonic achieve a reliable handshake but await government approval. Thus, DC growth, while rapid, stays tethered to infrastructure realities that AC units sidestep through lower amperage draws.
By Application Type: Public Networks Close the Urban Gap
Home installations accounted for 82.95% of Japan's EV charging equipment market size in 2025, favored by single-family owners who can access low overnight tariffs. Yet condominium retrofit headwinds shift urban drivers toward public or workplace chargers, igniting a 91.80% CAGR for public applications. Retail landlords deploy eight-bay clusters to monetize parking dwell times, reporting ancillary sales uplifts as EV drivers linger during charging sessions. Municipalities integrate curbside AC posts into smart-city upgrades, using IoT sensors to adjust parking fees dynamically based on grid load. This policy blueprint spreads from Tokyo’s wards to Osaka and Fukuoka, expanding public-network density.
Workplace charging emerges as a hybrid model: employees reserve AC slots via mobile apps, while unused midday capacity feeds energy back to the building under an internal tariff. The dual-use case improves payback periods and aligns with corporate sustainability audits. Destination sectors like hospitality and big-box retail join the wave, installing chargers to capture eco-conscious travelers. Hardware makers respond with modular designs ranging from two to sixteen heads without new transformers, easing capex decisions. By 2031 the public slice of the Japan EV charging equipment market share is expected to rival the home segment, signaling a mature two-channel ecosystem.
Geography Analysis
Tokyo’s metropolitan cluster dominates the Japan EV charging equipment market, which is supported by a dense population, high GDP per capita, and progressive municipal climate plans. The metro area benefits from overlapping subsidies: Tokyo prefecture covers significant charger hardware costs for small businesses, while national METI grants handle grid-connection fees. Corporate HQs in Marunouchi and Shinjuku mandate workplace charging, accelerating equipment penetration in commercial towers. High utilization rates ensure robust cash flows that attract infrastructure funds.
Industrial champions Toyota and Nissan spur equipment demand in the Chubu and Kansai by electrifying logistics arms. Aichi and Kanagawa prefectures cooperate with utilities to pre-permit transformer upgrades, shrinking construction timelines significantly. These areas double as testbeds for ChaoJi ultra-fast prototypes, giving domestic vendors a home-field advantage. Manufacturing clusters also integrate chargers with rooftop solar and cogeneration plants, creating micro-grids that sell frequency-control services to the main grid. Consequently, regional governments position EV infrastructure as both an industrial policy lever and an energy-transition tool, widening the reach of the Japanese EV charging equipment market.
Rural prefectures, especially Yamanashi, Miyazaki and Kochi, adopt chargers primarily to soak up midday solar surpluses. Battery-buffered AC posts smooth intermittency and provide emergency power during typhoons and earthquakes, a critical resilience feature. Low traffic volumes depress standalone profitability, so local governments bundle chargers with tourism campaigns that highlight eco-routes and green lodging. Though each rural site contributes modest revenue, together they ensure national coverage and lift the Japan EV charging equipment market’s social license to expand.
Regulatory Landscape
Japan’s EV charging equipment deployment is shaped largely by the Ministry of Economy, Trade and Industry (METI) and the Clean Energy Vehicle (CEV) infrastructure subsidy scheme administered through the Next Generation Vehicle Promotion Center. Current policy signals combine long-horizon deployment goals, including a 150,000 charging-units-by-2030 infrastructure push with a public fast-charger target, with multi-year funding windows (FY2026 and FY2027). This structure helps de-risk longer-lead builds such as highway charging hubs.
Compliance and eligibility are tied to certification and standards. In 2024, JARI-RB updated EVSE certification for higher-output AC equipment, with rated current capacity raised from 30A to 50A (up to 10 kW), while the prior 2014 version expired on March 31, 2025. This tightens the refresh cycle for suppliers and installers. Subsidy-linked requirements also reinforce interoperability expectations, with CHAdeMO support positioned as a practical prerequisite for national support. On November 20, 2025, METI announced additional, longer-term subsidy application pathways for Highway Service Areas and Parking Areas to account for longer construction durations and grid-connection complexity.
Value Chain Analysis
The Japan EV charging equipment value chain includes upstream power-electronics and cabling inputs (switchgear, meters, safety mechanisms, silicon-carbide modules, liquid-cooled cords, and composite cable assemblies), midstream charger OEMs and systems integrators (AC wall boxes, DC fast chargers, bidirectional V2H units, and containerized battery-buffered systems), and downstream deployment and operations by utilities, charge point operators, site hosts (retail, workplaces, depots, expressway service areas), and installer networks that handle permitting, civil works, and grid interconnection. Subsidy administration through the CEV program gates many projects, shaping BOM choices and driving demand for certified equipment and grid-integration functions.
Distribution and commercialization increasingly depend on software and payment ecosystems that connect drivers and fleets to multi-operator networks, which elevates the role of platforms alongside hardware. In June 2026, PLUGO Inc. announced its charging equipment compatibility with the TOYOTA Wallet EV charging service, illustrating how interoperability with widely used payment and authentication services can influence equipment selection and utilization. The chain also reflects a shift toward higher-output public hardware aligned with METI infrastructure guidelines, particularly for expressway sites, while residential and workplace adoption is supported by policy attention to V2H and external power supply devices. This is reinforced by METI’s June 2026 publication of subsidy summaries covering V2H charging/discharging equipment and external power supply devices.
Competitive Landscape
The Japan EV charging station market exhibits moderate fragmentation, indicating significant consolidation opportunities as the industry matures. The competitive dynamics favor companies combining hardware capabilities with software platforms, enabling integrated solutions that address vehicle charging and grid management requirements. This integration becomes valuable as utilities seek partners for demand response programs and grid stabilization services.
Strategic partnerships multiply: Utilities such as Tokyo Electric Power ink revenue-sharing pacts that give equipment vendors preferential tariff windows in exchange for demand-response participation. Start-ups like PowerX introduce containerized battery-integrated chargers, lowering peak draw and carving a niche in land-scarce ports. Cross-border M&A accelerates; Hitachi Energy’s acquisition of eks Energy secures advanced power electronics that shorten installation timeframes to a great extent.[2]
Innovation focus shifts from pure hardware to full-stack ecosystems encompassing payment, authentication, and energy-trading modules. Vendors embedding AI-based predictive maintenance cut downtime significantly, a differentiator in franchise tenders. Competitive pressure pushes price per installed kilowatt down by around 8% annually, yet service contracts cushion margin erosion. Investors favor firms offering end-to-end solutions because vertical integration simplifies risk assessment. As consolidation continues, the Japan EV charging equipment market heads toward an oligopoly of hardware-plus-software champions able to underwrite multi-gigawatt rollouts.
Japan Electric Vehicle Charging Equipment Industry Leaders
-
ABB
-
Delta Electronics Inc.
-
Toyota Connected Corporation
-
ENECHANGE Ltd.
-
Schneider Electric SE
- *Disclaimer: Major Players sorted in no particular order
Market Opportunities and Future Outlook
Opportunities cluster around higher-visibility site hosts and higher-output equipment categories that fit national deployment targets and the funding structures behind them. METI and related implementing bodies continue to steer installations toward higher-output public charging, including expressway-oriented guidance, supported by multi-year subsidy windows that back complex builds. This creates whitespace for suppliers that can deliver certified hardware with grid-integration features and remote monitoring. A parallel opportunity remains in multi-dwelling urban areas, where retrofit approvals can slow home charger rollouts and reinforce demand for public, workplace, and retail destination charging that faces less building-level governance friction.
Near-term evidence also points to retail-integrated fast charging and network densification as tangible demand pools. In July 2026, Tesla reported 150 operational Supercharger locations in Japan with 744 stalls, and it opened the first jointly branded Supercharger site with 7-Eleven Japan on July 11 in Kanagawa Prefecture, showing how convenience-store footprints can support 24/7 fast-charging access. Operator-scale deployment is also broadening across networks, with Terra Charge reporting in February 2026 more than 35,000 total installed chargers across Japan, including 1,005 rapid chargers. That scale supports pull-through for power supplies, control boards, metering, and cables as multi-operator sites expand.
Recent Industry Developments
- July 2026: Tesla and 7-Eleven Japan opened their first joint Supercharger site on July 11, 2026 at a 7-Eleven store in Kanagawa Prefecture, equipped with four V3 stalls. The tie-up formalizes convenience stores as host real estate for high-utilization fast charging, strengthening the business case for multi-port deployments with standardized uptime and customer amenities.
- June 2026: The Japan Green Investment Corp. for Carbon Neutrality (JICN) announced funding of up to 300 million yen to support PLUGO Inc. in expanding and streamlining EV charging infrastructure. The financing supports faster rollout and operational improvements, increasing competitive pressure on charger OEMs and installers to deliver scalable, remotely managed equipment.
- September 2024: Panasonic Energy began mass producing 4680 cylindrical batteries at its Wakayama plant, with full-scale output targeted for FY2025 Q2. The ramp strengthens the domestic battery supply base that underpins broader electrification and complements charger demand for grid-aware, demand-managed charging deployments.
Research Methodology Framework and Report Scope
Market Definition and Coverage
This market covers the value of electric vehicle charging equipment sold and installed in Japan, including AC and DC charging hardware used in home and public charging locations. It is measured in USD and reflects equipment revenue rather than electricity sales.
Scope exclusions: It excludes charging network services, subscription fees, standalone software, maintenance contracts, and electricity retailing unless bundled inside the equipment sale price.
Segmentation Overview
- By Vehicle Type
- Passenger Cars
- Commercial Vehicles
- By Charging Equipment
- Pillar
- Cord and Cable
- Control Boards
- Charging Controllers
- Power Supplies
- Others
- By Charging Type
- AC Charging Station
- DC Charging Station
- NACS (North American Charging System)
- By Application Type
- Home Charging
- Public Charging
Data Sources, Market Sizing, and Validation
Desk Research
Desk research was used to set the factual base for EV adoption, charger deployment, and policy timing in Japan before the model was built. We relied on public source types such as METI releases, MLIT transport statistics, IEA Global EV Outlook tables, and trade-body datasets that cover charging standards and rollout targets. We also reviewed customs and trade statistics for electrical equipment to understand import dependence and price movements, which then supported our assumptions on average selling price by charger type.
To connect the market to company reality, we reviewed annual reports, investor decks, and public announcements from charger makers, utilities, and infrastructure operators, along with press coverage from reputed media outlets. Where available, we used paid subscription sources for company financials and news screening, plus an import-and-export shipment-level database to sanity-check equipment flows. These sources are illustrative only, and other public documents and data points were also used for collection, validation, and clarification.
Primary Interviews and Surveys
Primary work focused on validating what gets counted as charging equipment revenue in Japan, then pressure-testing assumptions on shifts between AC and DC, and between home and public deployments. We spoke with stakeholders such as equipment suppliers, installers and EPCs, charge point operators, fleet and depot charging managers, and select policymakers and industry experts across Japan to confirm pricing behavior, replacement cycles, and procurement patterns.
Distribution of primary research fieldwork respondents
| Company type | Respondent position |
|---|---|
| Top tier: 25% | CXOs: 16% |
| Mid tier: 57% | Functional/Unit leaders: 27% |
| Smaller Players: 18% | Managers: 57% |
Market-Sizing & Forecasting
Sizing was done using a top-down build that reconstructs Japan charging equipment demand from the install base and planned additions of charging points, split into AC and DC, and then converted into value using realistic price ranges. Because charger counts alone can mislead, the model also adjusts for replacement demand, utilization-led upgrades, and the mix shift toward higher power DC units, which typically carry higher ticket sizes.
To keep the output anchored, we corroborated the totals with selective bottom-up checks, including sampled supplier revenue disclosures, installer channel checks, and ASP times volume calculations for a few common equipment types. Key inputs used in the model included EV parc growth and charging-to-EV ratios, the share of public versus home charger deployments, average charger power ratings and DC penetration, observed ASP movement by AC and DC units, and lead times linked to public tenders and grid connection work. When inputs were not available at a clean Japan-only level, we handled gaps using a bounded range, then narrowed it through interview feedback and cross-checks against deployment and policy signals.
Forecasting relied on scenario analysis supported by trend lines on EV adoption and public rollout programs, with assumptions reviewed against expert views on permitting speed, grid upgrade pacing, and expected cost declines. The final forecast path was then checked for realism against near-term project pipelines and the historical pace of charger additions.
Data Validation & Update Cycle
Validation was done through repeated variance checks across independent signals, so no single dataset could over-influence the market total. We compared model outputs against charger installation announcements, policy targets, and import and production indicators, and then reviewed outliers such as sudden ASP jumps or unusually high DC shares before sign-off. When a mismatch was found, follow-up outreach was triggered to recheck assumptions and confirm whether the change came from scope, timing, or pricing.
Each report is refreshed annually, and interim updates are made when material events occur, such as policy changes, large funding rounds, or major charging standard shifts. Before delivery, a final analyst review pass is completed so clients receive the most up-to-date view for the base year and the forecast period.
Mordor Intelligence's Japan Electric Vehicle Charging Equipment Market Estimate Compared With Other Published Estimates
Published market values for Japan EV charging equipment can look far apart, even when the topic sounds the same, because the counting rules are not always aligned. Differences usually come from what gets included as equipment, how AC versus DC mix is treated, the base year used, and whether revenue is counted at factory price or at installed system value.
In this study, the demand spine stays closer to pure EVSE hardware sold into home and public use, and it uses charger additions plus replacement cycles as the core driver. This is why some higher figures that fold in broader charging infrastructure and services do not line up with it, a scope decision applied by Mordor Intelligence.
Benchmark comparison
| Source | Market Size | Gaps in Research Methodology |
|---|---|---|
| Mordor Intelligence | USD 0.29 B (2025) | |
| Global Consultancy A | USD 0.99 B (2025) | Uses a broader charging infrastructure lens that can count installed project value and related infrastructure elements, and it is typically more sensitive to fast-charger revenue concentration in the base year. |
| Industry Publisher B | USD 1.44 B (2024) | Uses a different base year and may treat the equipment basket more widely, which can shift the total upward when pricing and deployment timing are not normalized to the same year. |
The comparison shows that most of the spread is explained by scope and timing rather than disagreement on Japan EV adoption direction. By tying the value build to charger additions, charger type mix, and realistic ASP ranges, we keep the estimate traceable to steps that can be rechecked as new deployment data comes out.
Key Questions Answered in the Report
How large is Japan’s EV charging equipment market in 2026?
It is valued at USD 0.46 billion and is projected to reach USD 4.64 billion by 2031 at a 58.70% CAGR.
What share of equipment uses AC technology today?
AC units account for 43.05% of installed capacity, favored for bidirectional V2H functionality.
Which application type is growing fastest?
Public charging is forecast to surge at a 91.80% CAGR through 2031 as urban drivers rely on curbside and retail hubs.
Why are cords and cables expanding so quickly?
Liquid-cooled, lightweight designs enable higher power delivery, driving a 63.90% CAGR for the component category.
What blocks home-charger adoption in cities?
Condominium retrofit rules under the Building Management Act require unanimous consent, delaying approvals.