
| Study Period | 2018 - 2030 |
| Base Year For Estimation | 2024 |
| Forecast Data Period | 2025 - 2030 |
| Market Volume (2025) | 2.32 Thousand MW |
| Market Volume (2030) | 3.66 Thousand MW |
| CAGR | 9.51 % |
| Market Concentration | Medium |
Major Players*Disclaimer: Major Players sorted in no particular order |


Japan Data Center Market Analysis
The Japan Data Center Market size is estimated at 2.32 thousand MW in 2025, and is expected to reach 3.66 thousand MW by 2030, growing at a CAGR of 9.51%. Further, the market is expected to generate colocation revenue of USD 2,511.5 Million in 2025 and is projected to reach USD 4,981.5 Million by 2030, growing at a CAGR of 14.68% during the forecast period (2025-2030).
Japan's data center market industry is undergoing significant transformation driven by the government's comprehensive Digital Garden City Nation scheme, which includes an investment of JPY 5.7 trillion for nationwide digitalization efforts. The Japanese Growth Strategy Council has prioritized digital transformation as a key area for stimulating economic growth, implementing new policies and measures through the "Basic Act on Forming a Digital Society." The Ministry of Economy, Trade, and Industry's recent initiative in 2023 to decentralize data centers across regions demonstrates the government's commitment to digital infrastructure development, with over 100 regional governments expressing interest in hosting new facilities. The industry's maturity is evident in its operational efficiency, with data centers achieving a rack space utilization rate of 75.1% in 2022, indicating robust demand and effective data center capacity management.
The market is witnessing a substantial shift toward sustainable infrastructure development, particularly in the deployment of green data centers. NTT Corporation's significant investment of approximately JPY 40 billion in 2022 for new green data centers exemplifies this trend, with facilities utilizing 100% renewable energy. The Japanese government has implemented ambitious environmental targets, offering tax incentives amounting to JPY 5 billion for carbon neutrality investments in data center infrastructure. These initiatives align with the country's broader goal of achieving zero greenhouse emissions by 2050, encouraging data center operators to adopt energy-efficient technologies and sustainable practices in their operations.
The manufacturing sector's digital transformation is driving significant demand for data center growth services, with Japanese manufacturing companies investing approximately USD 890 million in digital infrastructure. This transformation is characterized by the integration of advanced technologies such as private 5G networks, IoT devices, and smart factory solutions. The industry landscape is evolving rapidly, with 27 operators managing 97 data center facilities expected by 2024, indicating a robust and competitive market environment. The adoption of tier 3 and tier 4 facilities continues to dominate the market, with enterprises prioritizing high reliability and operational efficiency.
Regional development initiatives are reshaping the data center landscape across Japan, with the government actively promoting facilities in colder regions to leverage natural cooling advantages and reduce electricity costs. The Ministry of Internal Affairs and Communications has set an ambitious target of achieving 98% 5G population coverage by the end of March 2024, supporting the distributed data center strategy. The government's plan to invest in subsea cable infrastructure and data center decentralization, part of the JPY 5.7 trillion Digital Garden City Nation scheme, aims to ensure bandwidth diversity and revitalize regional areas. This comprehensive approach to infrastructure development includes plans for constructing more than a dozen data centers in rural areas over the next five years, coupled with the deployment of fiber cable off Japan's west coast.
Japan Data Center Market Trends
Rising smartphone penetration rate and emergence of new e-commerce platform in the country would drive the market
- The total number of smartphone users in Japan was 107.1 million in 2022. It is expected to witness a CAGR of 1.3% during the forecast period, reaching 117.77 million by 2029.
- In 2021, the smartphone penetration rate among households in Japan was close to 89%. The average time people spend on mobile internet use has increased in recent years, offering business opportunities to related industries, such as e-commerce.
- With the emergence of online shopping platforms, small businesses are also switching to online modes of payment and digital presence in the e-commerce world. The big and well-established companies also incorporate e-commerce platforms and the traditional form of business. For instance, in April 2022, Westlake Akishima, a Tokyo-based major supplier of specialty stabilizers for the PVC industry, announced a new e-commerce platform, extending the online buying experience to its buyer with security and convenience. Such developments are shaping the e-commerce and online payment ecosystem, impacting mobile payments in Japan.

Understand The Key Trends Shaping This Market
Download PDF
Expansion of 5G roll out by major mobile operators coupled with government support in same segment would drive the data center market
- The Japanese government assigned the three mobile operators in Japan — NTT Docomo, KDDI au, and Softbank, as well as the new arrival Rakuten Mobile, with 5G spectrum in April 2019. In the coming years, the four Japanese carriers are expected to spend more than USD 14 billion in capital expenditures, including investments in base stations, servers, and fiber optics, to build their 5G networks.
- Since the start of 2021, Japan’s mobile operators have been accelerating their 5G rollout. SoftBank aimed to deploy over 50,000 5G base stations and reach 90% population coverage by the end of March 2022. KDDI au aims to boost from just 10,000 base stations in March 2021 to 50,000 a year later. NTT DoCoMo was expanding its 5G network during 2021, aiming to reach 10,000 base stations by June and 20,000 by the end of March 2022, with 55% population coverage using the new high-speed 5G spectrum.
- The Ministry of International Affairs and Communications aims to continue moving the Japanese 5G experience forward. It set a target of 98% 5G population coverage by the end of March 2024. Overall, Japan aims to boost the amount of spectrum available for 5G services.

OTHER KEY INDUSTRY TRENDS COVERED IN THE REPORT
- Growing inclusion of online businesses along with streaming and online TV adoption leads to the data center demand
- Government initiative towards national broadband strategy and fixed network investment by telecom companies is boosting the market demand
- Government investment of JPY 50 billion on subsea cable and data center decentralization would increase data center demand
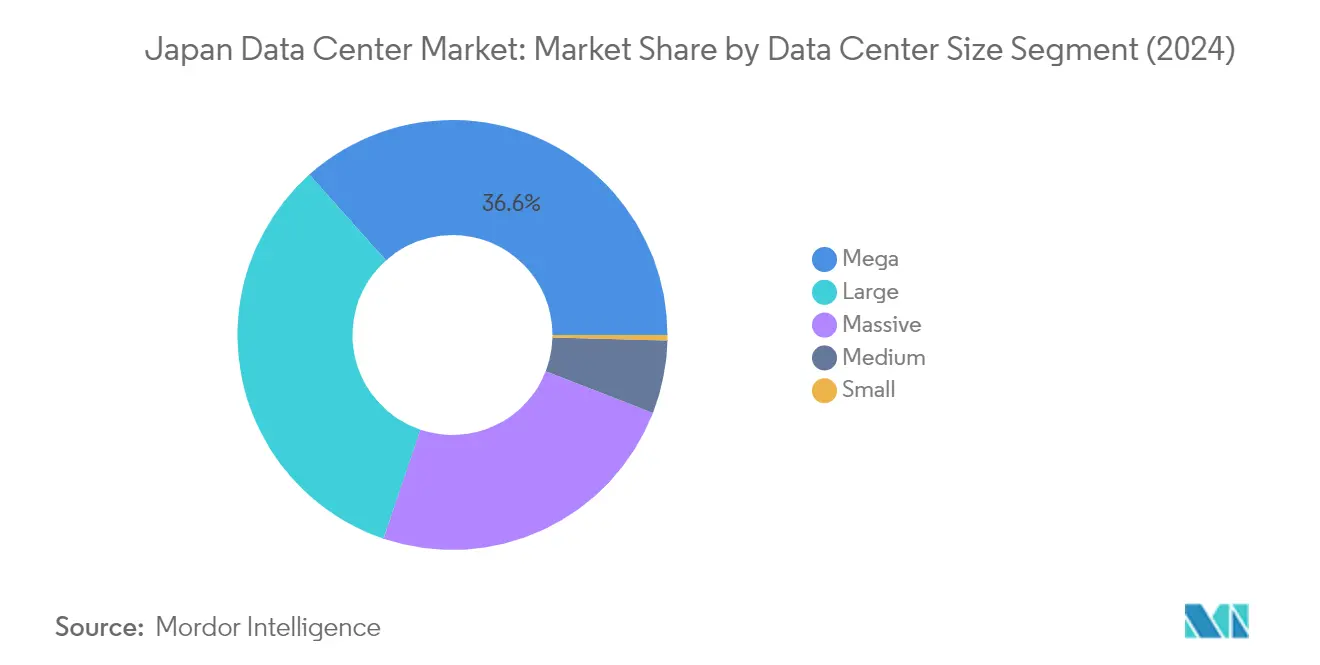
Segment Analysis: Data Center Size
Mega Segment in Japan Data Center Market
The mega data center segment dominates the Japanese data center market, holding approximately 37% data center market share in 2024. With the advent of 5G technology and industrial digitalization, the demand for mega data centers continues to rise significantly in the country. The segment's prominence is particularly evident in Tokyo, where 70% of the mega facilities are located, followed by Okuma and Kitakyushu. Major players like Digital Realty Trust Inc., AirTrunk Operating Pty Ltd, and IDC Frontier Inc. are driving the segment's growth with multiple mega facilities each. These companies are projected to expand their combined capacity to 345 MW, focusing on strategic locations in Tokyo, Osaka, and Kyoto, where local governments offer attractive incentives, including tax benefits on electricity and land.
Small Segment in Japan Data Center Market
The small data center segment is experiencing the highest growth rate in the Japanese data center market, with an expected growth of approximately 13% during 2024-2029. This growth is particularly noteworthy despite the segment's relatively small current market presence. The segment's expansion is driven by companies like Marunouchi Direct Access, Telehouse (KDDI Corporation), Digital Edge, Edge Centre, and AT Tokyo, which primarily operate these facilities across Tokyo. The construction of five new small-size data centers is currently underway, demonstrating continued investment in this segment. However, with the growing popularity of 5G technology and the exponential increase in data generation, there is a notable shift towards massive and mega data centers in the country.
Remaining Segments in Data Center Size Market
The massive, large, and medium segments play crucial roles in Japan's data center market landscape. The massive segment caters to enterprises requiring substantial computing power but not at the scale of mega facilities, with facilities primarily concentrated in Tokyo and Osaka. The large segment serves as a backbone for numerous enterprise-level operations, offering a balance between capacity and manageability. The medium segment focuses on providing specialized services to specific industry verticals, with most facilities maintaining Tier 3 certification standards. These segments collectively contribute to the market's diversity, offering various options to meet different organizational needs and technological requirements.
Segment Analysis: Tier Type
Tier 3 Segment in Japan Data Center Market
Tier 3 data centers dominate the Japanese data center market, accounting for approximately 79% of the total IT load capacity in 2024. This significant data center market share is driven by the segment's superior reliability and affordability compared to other tiers. Tokyo hosts the maximum number of Tier 3 data centers in the country, with a market share of around 57%, followed by Osaka at 22%, while the remaining facilities are spread across Nagoya, Inzai, Yokkaichi, Okuma, and Kitakyushu. Major cloud service providers and enterprises prefer Tier 3 facilities due to their optimal balance of redundancy, performance, and cost-effectiveness. The segment's growth is further supported by the ongoing construction of 17 new Tier 3 data center facilities by major players like Equinix Inc., Digital Realty Trust Inc., NTT Ltd, and Vantage Data Centers, primarily concentrated in Tokyo, Osaka, Kyoto, and Inzai.
Tier 4 Segment in Japan Data Center Market
The Tier 4 segment is experiencing remarkable growth in the Japanese data center market, with projections indicating an expansion rate of approximately 23% during 2024-2029. This accelerated growth is primarily driven by increasing demand for maximum reliability and uptime from mission-critical applications and services. The segment is witnessing substantial investments in new facilities, particularly in Tokyo's hotspot, with plans for the construction of mega data centers boasting capacities exceeding 400 MW. The growth is further supported by the increasing adoption of advanced technologies and the rising need for fault-tolerant infrastructure among financial institutions and large enterprises. Major operators are focusing on incorporating cutting-edge cooling systems, power distribution, and security features to meet the stringent requirements of Tier 4 certification.
Remaining Segments in Tier Type Segmentation
Tier 1 & 2 data centers represent a small portion of the Japanese data center market, primarily serving specific niche requirements. These facilities are mainly concentrated in Tokyo and Okinawa, with plans for new small data centers in Okinawa and Nagoya. While these tiers offer basic infrastructure and are more cost-effective, their lower redundancy levels and higher downtime risks make them less attractive for most businesses in Japan's technology-driven market. The limited adoption of Tier 1 & 2 facilities reflects the market's strong preference for higher tier certifications that provide better reliability and performance guarantees.
Segment Analysis: Absorption
Utilized Segment in Japan Data Center Market
The utilized segment dominates the Japanese data center market, accounting for approximately 78% of the total IT load capacity in 2024, demonstrating its significant market presence. This segment is also projected to grow at around 7% CAGR during 2024-2029, driven by increasing digitization efforts across the country. The Japanese government's massive digitalization initiative with a budget of JPY 5.7 trillion has been a key factor in driving utilization rates. While Japan's public spending on cloud services remains among the lowest globally, corporate adoption is progressing rapidly, with penetration rates rising significantly for SaaS, IaaS, and PaaS services, particularly in back-office applications. The utilized capacity is experiencing constant growth due to the increasing demand from various sectors, and Japan is positioned to become a major data center market in North Asia, especially as the allure of Hong Kong diminishes with growing regional challenges. The segment's strong performance is further supported by the country's robust technological infrastructure and favorable business environment for data center operations.
Non-Utilized Segment in Japan Data Center Market
The non-utilized segment represents the available capacity in Japanese data centers that remains to be leveraged, playing a crucial role in the market's future expansion potential. This segment serves as a strategic reserve for accommodating sudden surges in demand and provides flexibility for data center operators to scale their operations. The availability of non-utilized capacity enables data centers to maintain operational efficiency while ensuring they can respond quickly to new client requirements. Data center operators carefully manage this capacity to optimize their resource allocation and maintain competitive pricing structures. The segment also acts as a buffer for peak usage periods and helps maintain service quality during high-demand situations. The presence of non-utilized capacity is particularly important in major technology hubs like Tokyo and Osaka, where demand can fluctuate significantly based on market conditions and technological advancements. This segment also provides opportunities for new market entrants and existing players to expand their operations without immediate infrastructure investments.
Japan Data Center Industry Overview
Top Companies in Japan Data Center Market
The market is characterized by significant investments in infrastructure modernization and expansion initiatives by leading players. Data center companies in Japan are focusing on developing energy-efficient facilities with advanced cooling systems and implementing sustainable practices to reduce carbon footprints. Strategic partnerships with cloud service providers and network operators are becoming increasingly common to enhance service offerings and market reach. Operators are also emphasizing the importance of obtaining various international certifications and standards to ensure service quality and reliability. The industry is witnessing a trend toward developing carrier-neutral facilities with high-density computing capabilities and enhanced interconnection options. Companies are actively pursuing geographic expansion, particularly in key metropolitan areas like Tokyo and Osaka, while also exploring emerging locations for new facility development.
Market Dominated by Global Technology Leaders
The Japanese data center market exhibits a balanced mix of global technology conglomerates and domestic telecommunications giants. International players like Equinix, Digital Realty Trust, and AirTrunk operate alongside domestic powerhouses such as IDC Frontier (SoftBank Group) and NEC Corporation, creating a competitive yet collaborative ecosystem. The market structure is characterized by strategic partnerships between global and local players to leverage respective strengths in technology expertise and local market knowledge. The industry is witnessing increasing consolidation through joint ventures and strategic alliances, particularly in the development of hyperscale facilities.
The market demonstrates moderate concentration levels, with the top players collectively holding a significant data center market share by company while maintaining healthy competition. Merger and acquisition activities are primarily driven by the need to expand geographic presence and enhance technological capabilities. Companies are increasingly focusing on developing specialized offerings for different market segments, from retail colocation to wholesale services. The competitive landscape is further shaped by the entry of new international players and the expansion of existing operators, leading to increased investment in infrastructure development and service innovation.
Innovation and Sustainability Drive Future Growth
Success in the market increasingly depends on operators' ability to provide sustainable, energy-efficient solutions while maintaining high service reliability. Companies need to focus on developing next-generation cooling technologies and implementing renewable energy solutions to meet growing environmental concerns. The ability to offer flexible, scalable solutions that can accommodate varying customer requirements, from small enterprises to hyperscale clients, is becoming crucial. Operators must also invest in advanced security measures and maintain multiple compliance certifications to address growing cybersecurity concerns and regulatory requirements.
Market players need to develop strong relationships with cloud service providers and establish robust interconnection ecosystems to remain competitive. The focus should be on building strategic locations near business hubs while also exploring emerging markets in secondary cities. Companies must invest in automation and artificial intelligence to optimize operations and reduce costs. The regulatory environment, particularly regarding data sovereignty and environmental standards, will continue to shape market dynamics. Success will also depend on the ability to provide value-added services such as hybrid cloud solutions and edge computing capabilities, while maintaining competitive pricing structures. The largest data center companies are likely to lead these innovations, ensuring they capture significant data center shares in the evolving market.
Japan Data Center Market Leaders
-
Digital Realty Trust Inc.
-
Equinix Inc.
-
IDC Frontier Inc. (SoftBank Group)
-
NEC Corporation
-
NTT Ltd
- *Disclaimer: Major Players sorted in no particular order

Need More Details on Market Players and Competiters?
Download PDF
Japan Data Center Market News
- November 2022: Equinix announced its 15th International Business Exchange (IBX) data center in Tokyo, Japan. The company said that it had made an initial investment of USD 115 million in the new data center, named TY15. The first phase of TY15 will provide an initial capacity of approximately 1,200 cabinets, which will reach 3,700 cabinets when fully built out.
- October 2022: Zenlayer entered a joint venture with Megaport to strengthen and expand its presence globally. The partnership aims at providing enhanced services such as improved network connectivity, real-time provisioning, and on demand private connectivity for its clients around the globe.
- September 2022: NTT Corporation announced the investment of approximately JPY 40 billion through NTT Global Data Centers Corporation to build a new "Keihanna Data Center" in Kyoto Prefecture. The building is a four-story, seismic-isolated structure that will stably supply a total of 30 MW for IT load (starting at 6 MW and gradually moving to a server room space of 10,900 sq. m (equivalent to 4,800 racks).
Free With This Report
We provide a complimentary and exhaustive set of data points on the country and regional level metrics that present the fundamental structure of the industry. Presented in the form of 50+ free charts, the sections cover difficult to find data on various countries on smartphone users, data traffic per smartphone, mobile and broadband data speed, fiber connectivity network, and submarine cables.


Japan Data Center Market Report - Table of Contents
1. EXECUTIVE SUMMARY & KEY FINDINGS
2. REPORT OFFERS
3. INTRODUCTION
- 3.1 Study Assumptions & Market Definition
- 3.2 Scope of the Study
- 3.3 Research Methodology
4. MARKET OUTLOOK
- 4.1 It Load Capacity
- 4.2 Raised Floor Space
- 4.3 Colocation Revenue
- 4.4 Installed Racks
- 4.5 Rack Space Utilization
- 4.6 Submarine Cable
5. Key Industry Trends
- 5.1 Smartphone Users
- 5.2 Data Traffic Per Smartphone
- 5.3 Mobile Data Speed
- 5.4 Broadband Data Speed
- 5.5 Fiber Connectivity Network
-
5.6 Regulatory Framework
- 5.6.1 Japan
- 5.7 Value Chain & Distribution Channel Analysis
6. MARKET SEGMENTATION (INCLUDES MARKET SIZE IN VOLUME, FORECASTS UP TO 2030 AND ANALYSIS OF GROWTH PROSPECTS)
-
6.1 Hotspot
- 6.1.1 Osaka
- 6.1.2 Tokyo
- 6.1.3 Rest of Japan
-
6.2 Data Center Size
- 6.2.1 Large
- 6.2.2 Massive
- 6.2.3 Medium
- 6.2.4 Mega
- 6.2.5 Small
-
6.3 Tier Type
- 6.3.1 Tier 1 and 2
- 6.3.2 Tier 3
- 6.3.3 Tier 4
-
6.4 Absorption
- 6.4.1 Non-Utilized
- 6.4.2 Utilized
- 6.4.2.1 By Colocation Type
- 6.4.2.1.1 Hyperscale
- 6.4.2.1.2 Retail
- 6.4.2.1.3 Wholesale
- 6.4.2.2 By End User
- 6.4.2.2.1 BFSI
- 6.4.2.2.2 Cloud
- 6.4.2.2.3 E-Commerce
- 6.4.2.2.4 Government
- 6.4.2.2.5 Manufacturing
- 6.4.2.2.6 Media & Entertainment
- 6.4.2.2.7 Telecom
- 6.4.2.2.8 Other End User
7. COMPETITIVE LANDSCAPE
- 7.1 Market Share Analysis
- 7.2 Company Landscape
-
7.3 Company Profiles (includes Global Level Overview, Market Level Overview, Core Business Segments, Financials, Headcount, Key Information, Market Rank, Market Share, Products and Services, and Analysis of Recent Developments).
- 7.3.1 AirTrunk Operating Pty Ltd
- 7.3.2 Arteria Networks Corporation
- 7.3.3 Colt Technology Services
- 7.3.4 Digital Edge (Singapore) Holdings Pte Ltd
- 7.3.5 Digital Realty Trust Inc.
- 7.3.6 Equinix Inc.
- 7.3.7 IDC Frontier Inc. (SoftBank Group)
- 7.3.8 NEC Corporation
- 7.3.9 netXDC (SCSK Corporation)
- 7.3.10 NTT Ltd
- 7.3.11 Telehouse (KDDI Corporation)
- 7.3.12 Zenlayer Inc.
- 7.4 LIST OF COMPANIES STUDIED
8. KEY STRATEGIC QUESTIONS FOR DATA CENTER CEOS
9. APPENDIX
-
9.1 Global Overview
- 9.1.1 Overview
- 9.1.2 Porter’s Five Forces Framework
- 9.1.3 Global Value Chain Analysis
- 9.1.4 Global Market Size and DROs
- 9.2 Sources & References
- 9.3 List of Tables & Figures
- 9.4 Primary Insights
- 9.5 Data Pack
- 9.6 Glossary of Terms
You Can Purchase Parts Of This Report. Check Out Prices For Specific Sections
Get Price Break-up Now
List of Tables & Figures
- Figure 1:
- VOLUME OF IT LOAD CAPACITY, MW, JAPAN, 2018 - 2030
- Figure 2:
- VALUE OF COLOCATION REVENUE, USD MILLION, JAPAN, 2018 - 2030
- Figure 3:
- VOLUME OF INSTALLED RACKS, NUMBER, JAPAN, 2018 - 2030
- Figure 4:
- RACK SPACE UTILIZATION, %, JAPAN, 2018 - 2030
- Figure 5:
- COUNT OF SMARTPHONE USERS, IN MILLION, JAPAN, 2018 - 2030
- Figure 6:
- DATA TRAFFIC PER SMARTPHONE, GB, JAPAN, 2018 - 2030
- Figure 7:
- AVERAGE MOBILE DATA SPEED, MBPS, JAPAN, 2018 - 2030
- Figure 8:
- AVERAGE BROADBAND SPEED, MBPS, JAPAN, 2018 - 2030
- Figure 9:
- LENGTH OF FIBER CONNECTIVITY NETWORK, KILOMETER, JAPAN, 2018 - 2030
- Figure 10:
- VOLUME OF IT LOAD CAPACITY, MW, JAPAN, 2018 - 2030
- Figure 11:
- VOLUME OF HOTSPOT, MW, JAPAN, 2018 - 2030
- Figure 12:
- VOLUME SHARE OF HOTSPOT, %, JAPAN, 2018 - 2030
- Figure 13:
- VOLUME SIZE OF OSAKA, MW, JAPAN, 2018 - 2030
- Figure 14:
- VOLUME SHARE OF OSAKA, MW, HOTSPOT, %, JAPAN, 2018 - 2030
- Figure 15:
- VOLUME SIZE OF TOKYO, MW, JAPAN, 2018 - 2030
- Figure 16:
- VOLUME SHARE OF TOKYO, MW, HOTSPOT, %, JAPAN, 2018 - 2030
- Figure 17:
- VOLUME SIZE OF REST OF JAPAN, MW, JAPAN, 2018 - 2030
- Figure 18:
- VOLUME SHARE OF REST OF JAPAN, MW, HOTSPOT, %, JAPAN, 2018 - 2030
- Figure 19:
- VOLUME OF DATA CENTER SIZE, MW, JAPAN, 2018 - 2030
- Figure 20:
- VOLUME SHARE OF DATA CENTER SIZE, %, JAPAN, 2018 - 2030
- Figure 21:
- VOLUME SIZE OF LARGE, MW, JAPAN, 2018 - 2030
- Figure 22:
- VOLUME SIZE OF MASSIVE, MW, JAPAN, 2018 - 2030
- Figure 23:
- VOLUME SIZE OF MEDIUM, MW, JAPAN, 2018 - 2030
- Figure 24:
- VOLUME SIZE OF MEGA, MW, JAPAN, 2018 - 2030
- Figure 25:
- VOLUME SIZE OF SMALL, MW, JAPAN, 2018 - 2030
- Figure 26:
- VOLUME OF TIER TYPE, MW, JAPAN, 2018 - 2030
- Figure 27:
- VOLUME SHARE OF TIER TYPE, %, JAPAN, 2018 - 2030
- Figure 28:
- VOLUME SIZE OF TIER 1 AND 2, MW, JAPAN, 2018 - 2030
- Figure 29:
- VOLUME SIZE OF TIER 3, MW, JAPAN, 2018 - 2030
- Figure 30:
- VOLUME SIZE OF TIER 4, MW, JAPAN, 2018 - 2030
- Figure 31:
- VOLUME OF ABSORPTION, MW, JAPAN, 2018 - 2030
- Figure 32:
- VOLUME SHARE OF ABSORPTION, %, JAPAN, 2018 - 2030
- Figure 33:
- VOLUME SIZE OF NON-UTILIZED, MW, JAPAN, 2018 - 2030
- Figure 34:
- VOLUME OF COLOCATION TYPE, MW, JAPAN, 2018 - 2030
- Figure 35:
- VOLUME SHARE OF COLOCATION TYPE, %, JAPAN, 2018 - 2030
- Figure 36:
- VOLUME SIZE OF HYPERSCALE, MW, JAPAN, 2018 - 2030
- Figure 37:
- VOLUME SIZE OF RETAIL, MW, JAPAN, 2018 - 2030
- Figure 38:
- VOLUME SIZE OF WHOLESALE, MW, JAPAN, 2018 - 2030
- Figure 39:
- VOLUME OF END USER, MW, JAPAN, 2018 - 2030
- Figure 40:
- VOLUME SHARE OF END USER, %, JAPAN, 2018 - 2030
- Figure 41:
- VOLUME SIZE OF BFSI, MW, JAPAN, 2018 - 2030
- Figure 42:
- VOLUME SIZE OF CLOUD, MW, JAPAN, 2018 - 2030
- Figure 43:
- VOLUME SIZE OF E-COMMERCE, MW, JAPAN, 2018 - 2030
- Figure 44:
- VOLUME SIZE OF GOVERNMENT, MW, JAPAN, 2018 - 2030
- Figure 45:
- VOLUME SIZE OF MANUFACTURING, MW, JAPAN, 2018 - 2030
- Figure 46:
- VOLUME SIZE OF MEDIA & ENTERTAINMENT, MW, JAPAN, 2018 - 2030
- Figure 47:
- VOLUME SIZE OF TELECOM, MW, JAPAN, 2018 - 2030
- Figure 48:
- VOLUME SIZE OF OTHER END USER, MW, JAPAN, 2018 - 2030
- Figure 49:
- VOLUME SHARE OF MAJOR PLAYERS, %, JAPAN
Japan Data Center Industry Segmentation
Osaka, Tokyo are covered as segments by Hotspot. Large, Massive, Medium, Mega, Small are covered as segments by Data Center Size. Tier 1 and 2, Tier 3, Tier 4 are covered as segments by Tier Type. Non-Utilized, Utilized are covered as segments by Absorption.| Hotspot | Osaka | |||
| Tokyo | ||||
| Rest of Japan | ||||
| Data Center Size | Large | |||
| Massive | ||||
| Medium | ||||
| Mega | ||||
| Small | ||||
| Tier Type | Tier 1 and 2 | |||
| Tier 3 | ||||
| Tier 4 | ||||
| Absorption | Non-Utilized | |||
| Utilized | By Colocation Type | Hyperscale | ||
| Retail | ||||
| Wholesale | ||||
| By End User | BFSI | |||
| Cloud | ||||
| E-Commerce | ||||
| Government | ||||
| Manufacturing | ||||
| Media & Entertainment | ||||
| Telecom | ||||
| Other End User | ||||
Need A Different Region or Segment?
Customize Now
Market Definition
- IT LOAD CAPACITY - The IT load capacity or installed capacity, refers to the amount of energy consumed by servers and network equipments placed in a rack installed. It is measured in megawatt (MW).
- ABSORPTION RATE - It denotes the extend to which the data center capacity has been leased out. For instance, a 100 MW DC has leased out 75 MW, then absorption rate would be 75%. It is also referred as utilization rate and leased-out capacity.
- RAISED FLOOR SPACE - It is an elevated space build over the floor. This gap between the original floor and the elevated floor is used to accommodate wiring, cooling, and other data center equipment. This arrangement assist in having proper wiring and cooling infrastructure. It is measured in square feet (ft^2).
- DATA CENTER SIZE - Data Center Size is segmented based on the raised floor space allocated to the data center facilities. Mega DC - # of Racks must be more than 9000 or RFS (raised floor space) must be more than 225001 Sq. ft; Massive DC - # of Racks must be in between 9000 and 3001 or RFS must be in between 225000 Sq. ft and 75001 Sq. ft; Large DC - # of Racks must be in between 3000 and 801 or RFS must be in between 75000 Sq. ft and 20001 Sq. ft; Medium DC # of Racks must be in between 800 and 201 or RFS must be in between 20000 Sq. ft and 5001 Sq. ft; Small DC - # of Racks must be less than 200 or RFS must be less than 5000 Sq. ft.
- TIER TYPE - According to Uptime Institute the data centers are classified into four tiers based on the proficiencies of redundant equipment of the data center infrastructure. In this segment the data center are segmented as Tier 1,Tier 2, Tier 3 and Tier 4.
- COLOCATION TYPE - The segment is segregated into 3 categories namely Retail, Wholesale and Hyperscale Colocation service. The categorization is done based on the amount of IT load leased out to potential customers. Retail colocation service has leased capacity less than 250 kW; Wholesale colocation services has leased capacity between 251 kW and 4 MW and Hyperscale colocation services has leased capacity more than 4 MW.
- END CONSUMERS - The Data Center Market operates on a B2B basis. BFSI, Government, Cloud Operators, Media and Entertainment, E-Commerce, Telecom and Manufacturing are the major end-consumers in the market studied. The scope only includes colocation service operators catering to the increasing digitalization of the end-user industries.
| Keyword | Definition |
|---|---|
| Rack Unit | Generally referred as U or RU, it is the unit of measurement for the server unit housed in the racks in the data center. 1U is equal to 1.75 inches. |
| Rack Density | It defines the amount of power consumed by the equipment and server housed in a rack. It is measured in kilowatt (kW). This factor plays a critical role in data center design and, cooling and power planning. |
| IT Load Capacity | The IT load capacity or installed capacity, refers to the amount of energy consumed by servers and network equipment placed in a rack installed. It is measured in megawatt (MW). |
| Absorption Rate | It denotes how much of the data center capacity has been leased out. For instance, if a 100 MW DC has leased out 75 MW, then the absorption rate would be 75%. It is also referred to as utilization rate and leased-out capacity. |
| Raised Floor Space | It is an elevated space built over the floor. This gap between the original floor and the elevated floor is used to accommodate wiring, cooling, and other data center equipment. This arrangement assists in having proper wiring and cooling infrastructure. It is measured in square feet/meter. |
| Computer Room Air Conditioner (CRAC) | It is a device used to monitor and maintain the temperature, air circulation, and humidity inside the server room in the data center. |
| Aisle | It is the open space between the rows of racks. This open space is critical for maintaining the optimal temperature (20-25 °C) in the server room. There are primarily two aisles inside the server room, a hot aisle and a cold aisle. |
| Cold Aisle | It is the aisle wherein the front of the rack faces the aisle. Here, chilled air is directed into the aisle so that it can enter the front of the racks and maintain the temperature. |
| Hot Aisle | It is the aisle where the back of the racks faces the aisle. Here, the heat dissipated from the equipment’s in the rack is directed to the outlet vent of the CRAC. |
| Critical Load | It includes the servers and other computer equipment whose uptime is critical for data center operation. |
| Power Usage Effectiveness (PUE) | It is a metric which defines the efficiency of a data center. It is calculated by: (𝑇𝑜𝑡𝑎𝑙 𝐷𝑎𝑡𝑎 𝐶𝑒𝑛𝑡𝑒𝑟 𝐸𝑛𝑒𝑟𝑔𝑦 𝐶𝑜𝑛𝑠𝑢𝑚𝑝𝑡𝑖𝑜𝑛)/(𝑇𝑜𝑡𝑎𝑙 𝐼𝑇 𝐸𝑞𝑢𝑖𝑝𝑚𝑒𝑛𝑡 𝐸𝑛𝑒𝑟𝑔𝑦 𝐶𝑜𝑛𝑠𝑢𝑚𝑝𝑡𝑖𝑜𝑛). Further, a data center with a PUE of 1.2-1.5 is considered highly efficient, whereas, a data center with a PUE >2 is considered highly inefficient. |
| Redundancy | It is defined as a system design wherein additional component (UPS, generators, CRAC) is added so that in case of power outage, equipment failure, the IT equipment should not be affected. |
| Uninterruptible Power Supply (UPS) | It is a device that is connected in series with the utility power supply, storing energy in batteries such that the supply from UPS is continuous to IT equipment even during utility power is snapped. The UPS primarily supports the IT equipment only. |
| Generators | Just like UPS, generators are placed in the data center to ensure an uninterrupted power supply, avoiding downtime. Data center facilities have diesel generators and commonly, 48-hour diesel is stored in the facility to prevent disruption. |
| N | It denotes the tools and equipment required for a data center to function at full load. Only "N" indicates that there is no backup to the equipment in the event of any failure. |
| N+1 | Referred to as 'Need plus one', it denotes the additional equipment setup available to avoid downtime in case of failure. A data center is considered N+1 when there is one additional unit for every 4 components. For instance, if a data center has 4 UPS systems, then for to achieve N+1, an additional UPS system would be required. |
| 2N | It refers to fully redundant design wherein two independent power distribution system is deployed. Therefore, in the event of a complete failure of one distribution system, the other system will still supply power to the data center. |
| In-Row Cooling | It is the cooling design system installed between racks in a row where it draws warm air from the hot aisle and supplies cool air to the cold aisle, thereby maintaining the temperature. |
| Tier 1 | Tier classification determines the preparedness of a data center facility to sustain data center operation. A data center is classified as Tier 1 data center when it has a non-redundant (N) power component (UPS, generators), cooling components, and power distribution system (from utility power grids). The Tier 1 data center has an uptime of 99.67% and an annual downtime of <28.8 hours. |
| Tier 2 | A data center is classified as Tier 2 data center when it has a redundant power and cooling components (N+1) and a single non-redundant distribution system. Redundant components include extra generators, UPS, chillers, heat rejection equipment, and fuel tanks. The Tier 2 data center has an uptime of 99.74% and an annual downtime of <22 hours. |
| Tier 3 | A data center having redundant power and cooling components and multiple power distribution systems is referred to as a Tier 3 data center. The facility is resistant to planned (facility maintenance) and unplanned (power outage, cooling failure) disruption. The Tier 3 data center has an uptime of 99.98% and an annual downtime of <1.6 hours. |
| Tier 4 | It is the most tolerant type of data center. A Tier 4 data center has multiple, independent redundant power and cooling components and multiple power distribution paths. All IT equipment are dual powered, making them fault tolerant in case of any disruption, thereby ensuring interrupted operation. The Tier 4 data center has an uptime of 99.74% and an annual downtime of <26.3 minutes. |
| Small Data Center | Data center that has floor space area of ≤ 5,000 Sq. ft or the number of racks that can be installed is ≤ 200 is classified as a small data center. |
| Medium Data Center | Data center which has floor space area between 5,001-20,000 Sq. ft, or the number of racks that can be installed is between 201-800, is classified as a medium data center. |
| Large Data Center | Data center which has floor space area between 20,001-75,000 Sq. ft, or the number of racks that can be installed is between 801-3,000, is classified as a large data center. |
| Massive Data Center | Data center which has floor space area between 75,001-225,000 Sq. ft, or the number of racks that can be installed is between 3001-9,000, is classified as a massive data center. |
| Mega Data Center | Data center that has a floor space area of ≥ 225,001 Sq. ft or the number of racks that can be installed is ≥ 9001 is classified as a mega data center. |
| Retail Colocation | It refers to those customers who have a capacity requirement of 250 kW or less. These services are majorly opted by small and medium enterprises (SMEs). |
| Wholesale Colocation | It refers to those customers who have a capacity requirement between 250 kW to 4 MW. These services are majorly opted by medium to large enterprises. |
| Hyperscale Colocation | It refers to those customers who have a capacity requirement greater than 4 MW. The hyperscale demand primarily originates from large-scale cloud players, IT companies, BFSI, and OTT players (like Netflix, Hulu, and HBO+). |
| Mobile Data Speed | It is the mobile internet speed a user experiences via their smartphones. This speed is primarily dependent on the carrier technology being used in the smartphone. The carrier technologies available in the market are 2G, 3G, 4G, and 5G, where 2G provides the slowest speed while 5G is the fastest. |
| Fiber Connectivity Network | It is a network of optical fiber cables deployed across the country, connecting rural and urban regions with high-speed internet connection. It is measured in kilometer (km). |
| Data Traffic per Smartphone | It is a measure of average data consumption by a smartphone user in a month. It is measured in gigabyte (GB). |
| Broadband Data Speed | It is the internet speed that is supplied over the fixed cable connection. Commonly, copper cable and optic fiber cable are used in both residential and commercial use. Here, optic cable fiber provides faster internet speed than copper cable. |
| Submarine Cable | A submarine cable is a fiber optic cable laid down at two or more landing points. Through this cable, communication and internet connectivity between countries across the globe is established. These cables can transmit 100-200 terabits per second (Tbps) from one point to another. |
| Carbon Footprint | It is the measure of carbon dioxide generated during the regular operation of a data center. Since, coal, and oil & gas are the primary source of power generation, consumption of this power contributes to carbon emissions. Data center operators are incorporating renewable energy sources to curb the carbon footprint emerging in their facilities. |
Need More Details on Market Definition?
Ask a Question
Research Methodology
Mordor Intelligence follows a four-step methodology in all our reports.
- Step-1: Identify Key Variables: In order to build a robust forecasting methodology, the variables and factors identified in Step-1 are tested against available historical market numbers. Through an iterative process, the variables required for market forecast are set and the model is built on the basis of these variables.
- Step-2: Build a Market Model: Market-size estimations for the forecast years are in nominal terms. Inflation is not a part of the pricing, and the average selling price (ASP) is kept constant throughout the forecast period for each country.
- Step-3: Validate and Finalize: In this important step, all market numbers, variables and analyst calls are validated through an extensive network of primary research experts from the market studied. The respondents are selected across levels and functions to generate a holistic picture of the market studied.
- Step-4: Research Outputs: Syndicated Reports, Custom Consulting Assignments, Databases & Subscription Platforms

Get More Details On Research Methodology
Download PDF


