Japan Dairy Market Size and Share
Market Overview
| Study Period | 2020 - 2030 |
|---|---|
| Base Year For Estimation | 2024 |
| Forecast Data Period | 2025 - 2030 |
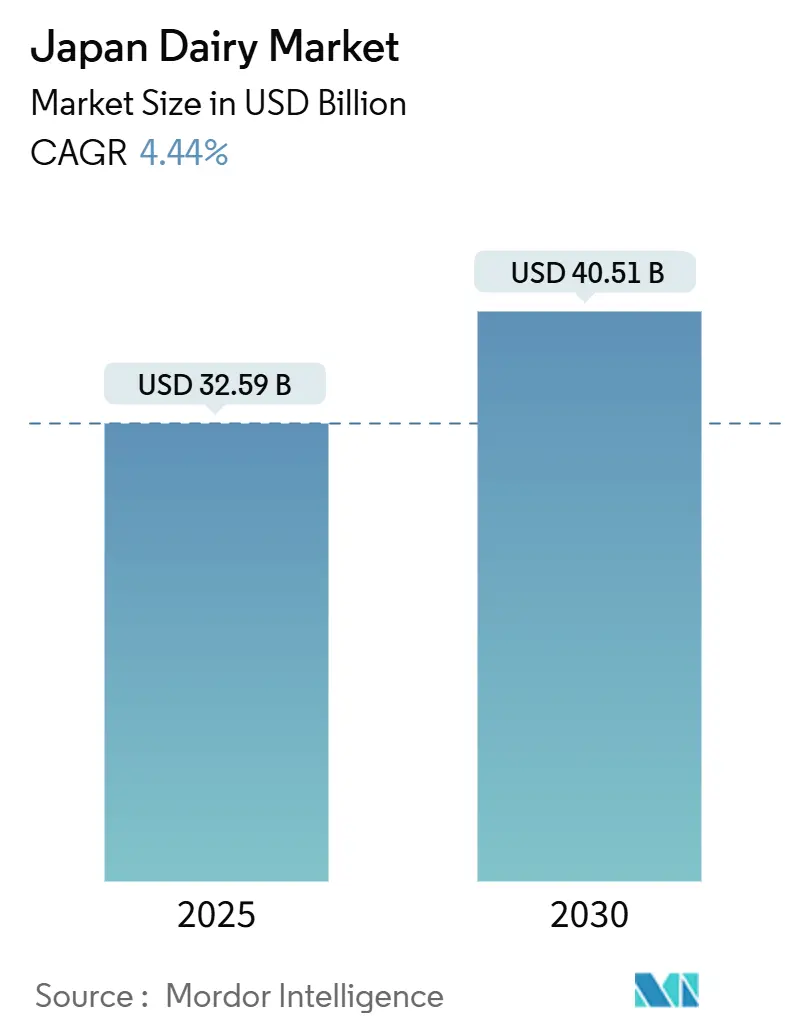
| Market Size (2025) | USD 32.59 Billion |
| Market Size (2030) | USD 40.51 Billion |
| Growth Rate (2025 - 2030) | 4.44% CAGR |
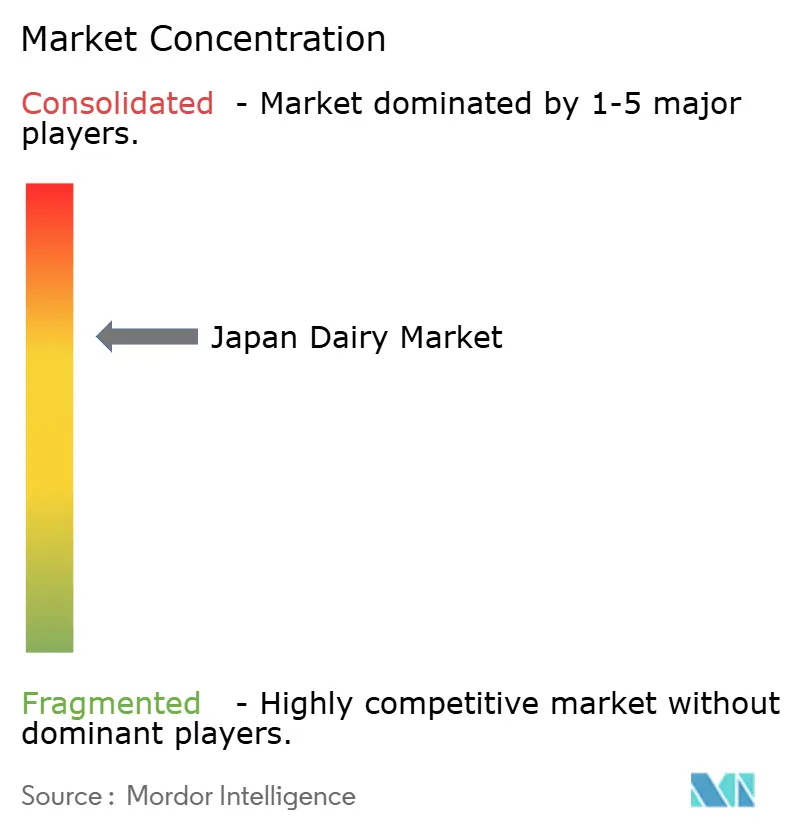
| Market Concentration | Medium |
Major Players
*Disclaimer: Major Players sorted in no particular order Image © Mordor Intelligence. Reuse requires attribution under CC BY 4.0. |
|
Japan Dairy Market Analysis by Mordor Intelligence
The Japan dairy market size stands at USD 32.59 billion in 2025 and is projected to reach USD 40.51 billion in 2030, progressing at a 4.44% CAGR over the forecast period. Structural labor shortages, increasing feed costs, premium product positioning, and advancements in functional foods are shaping demand trends. Growing health consciousness and a focus on preventive nutrition are boosting the consumption of low-fat, probiotic, fortified, and lactose-free dairy products, with yogurt and functional drinks leading this growth. Yogurt's probiotic benefits and milk's shelf-stable formats are driving greater household adoption. At the same time, cheese and dairy desserts are gaining popularity for their indulgent appeal. Retailers are focusing on chilled convenience formats to cater to urban commuters, while rural consumers are increasingly opting for ambient-stable UHT milk. In Hokkaido, farm automation is enhancing yields and partially addressing labor shortages. Concurrently, investments in precision fermentation and bifidobacteria strains are positioning Japan as a leader in functional dairy innovation, particularly under the Foods with Function Claims regime.
Key Report Takeaways
- By product type, yogurt led with 36.52% of the Japanese dairy market share in 2024, while milk is forecast to expand at a 4.95% CAGR through 2030.
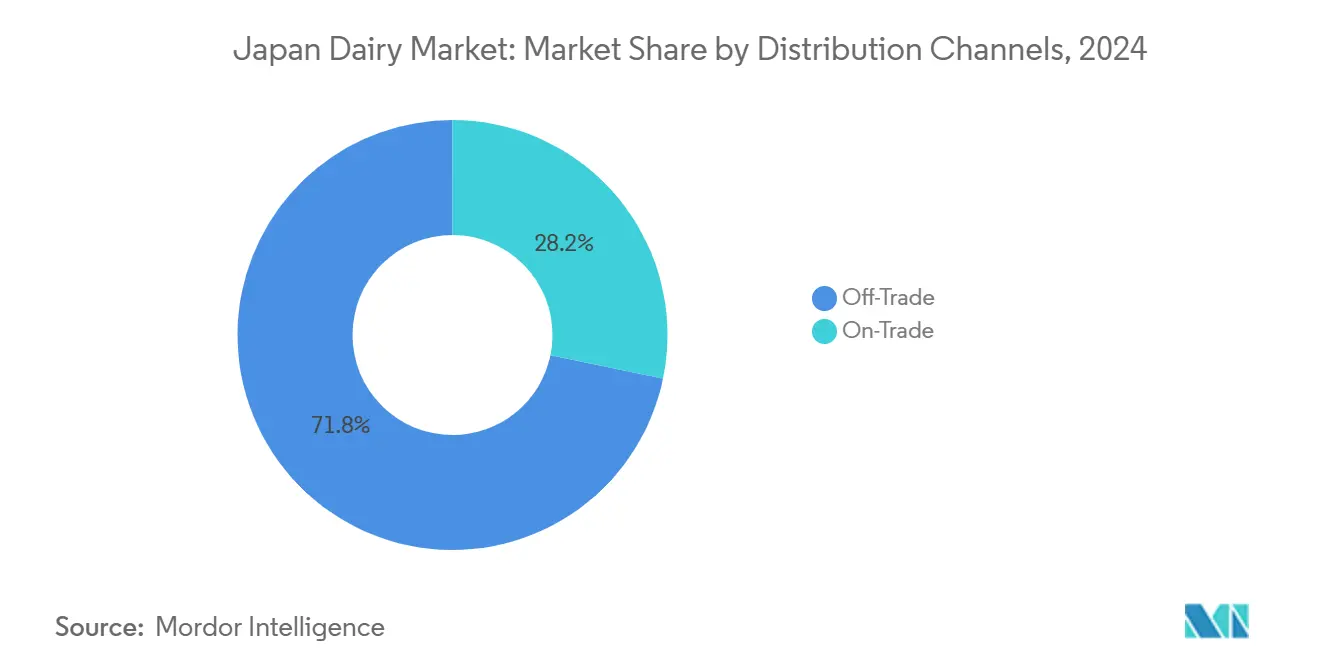
- By distribution channel, the off-trade segment held 71.75% share of the Japanese dairy market size in 2024, and the on-trade channel is advancing at a 5.38% CAGR to 2030.
Japan Dairy Market Trends and Insights
Drivers Impact Analysis
| Driver | (~) % Impact on CAGR Forecast | Geographic Relevance | Impact Timeline |
|---|---|---|---|
| Growing demand for premium cheese and yogurt | +0.9% | National, with concentration in Tokyo, Osaka, and Nagoya metropolitan areas | Medium term (2–4 years) |
| Health-conscious shift to functional dairy | +1.1% | National, with early adoption in urban centers and aging-population prefectures | Short term (≤ 2 years) |
| Rising awareness of nutritional benefits of dairy in aging population | +0.7% | National | Long term (≥ 4 years) |
| Advances in dairy processing technology improving shelf life and variety | +0.6% | National, with manufacturing hubs in Hokkaido, Gunma, and Tochigi | Medium term (2–4 years) |
| Strong domestic dairy brands with extensive product innovation | +0.5% | National | Short term (≤ 2 years) |
| Robotic milking adoption in Hokkaido | +0.3% | Hokkaido region, with spillover to Tohoku and northern prefectures | Long term (≥ 4 years) |
| Source: Mordor Intelligence | |||
Growing demand for premium cheese and yogurt
In Japan, cheese consumption has been steadily increasing, with natural cheese experiencing faster growth compared to processed cheese. The ongoing urbanization and the integration of Western culinary practices into Japanese cuisine have transformed cheese from a niche import into a widely accepted cooking ingredient and snack option. Yogurt, however, is experiencing an even more pronounced growth trajectory. Probiotic formulations, which focus on promoting immune health and digestive wellness, have become integral to breakfast routines and post-meal consumption habits. The trend of premiumization is also gaining momentum, as consumers demonstrate a willingness to pay higher prices for dairy products that are grass-fed and traceable. Multinational companies are seizing this opportunity by emphasizing origin storytelling and obtaining sustainability certifications to appeal to this growing preference. This shift is significantly reshaping retail assortments. Convenience stores are increasingly allocating chilled-case space to artisan and imported cheeses, while yogurt product lines have expanded to include a diverse range of options such as drinkable yogurts, spoonable varieties, and frozen dessert hybrids.
Health-conscious shift to functional dairy
Functional dairy products, enriched with probiotics, vitamins, or bioactive peptides, are increasingly appealing to consumers seeking preventive health solutions. Kirin's LC-Plasma lactobacillus strain enhances plasmacytoid dendritic cell activity. Japan's regulatory framework supports such advancements: The Foods with Function Claims system enables self-certification of health benefits backed by scientific evidence, expediting the process compared to the stricter Foods for Specified Health Uses pathway. This favorable environment is attracting pharmaceutical and nutraceutical companies to collaborate in dairy product development, blurring sector boundaries and driving research and development efforts. Japan's aging population emphasizes the importance of bone health, immunity, and gut wellness, fueling demand for probiotic yogurts and fortified milks as daily wellness staples. According to the Consumer Affairs Agency, 15.5% of Japanese consumers had tried health foods certified as "foods for specified health uses" (FOSHU) as of March 2024 [1]Source: Consumer Affairs Agency, "Consumer survey on food labeling", caa.go.jp. Urban professionals and younger consumers prefer convenient options, such as single-serve drinkable yogurts, which cater to their busy lifestyles while offering scientifically proven benefits like improved metabolism and digestive health.
Rising awareness of nutritional benefits of dairy in aging population
In 2024, the World Bank reported that Japan's population aged 65 and older exceeded 30% [2]Source: World Bank, "Population ages 65 and above ", data.worldbank.org. This demographic change has heightened the emphasis on bone health, muscle maintenance, and immune resilience, areas where dairy's calcium, protein, and bioactive compounds provide notable benefits. The Ministry of Health, Labour and Welfare, through municipal health centers, has issued dietary guidelines recommending a daily calcium intake of 600–800 milligrams, emphasizing milk and yogurt as key sources. Fortified milk products, enhanced with vitamin D, collagen peptides, or medium-chain triglycerides, are increasingly popular in channels serving the elderly, such as home-delivery services designed for individuals with limited mobility. Additionally, the intersection of aging and dairy nutrition is driving academic collaborations: universities are working with processors to evaluate dairy's impact on sarcopenia and osteoporosis, generating peer-reviewed research that manufacturers use in consumer education efforts.
Advances in dairy processing technology improving shelf life and variety
Ultra-high-temperature processing rapidly heats milk to 135–150°C for 2–5 seconds, extending its unopened shelf life to 150 days. This enables room-temperature distribution and significantly reduces cold-chain costs, a crucial advantage in Japan's fragmented retail market. Aseptic packaging, predominantly utilizing Tetra Pak systems, preserves 90–95% of milk's nutritional value. It also supports single-serve and on-the-go formats, aligning seamlessly with the fast-paced commuter lifestyle. Innovations such as Morinaga's bifidobacteria technology, which isolates strains resistant to gastric acid for improved probiotic efficacy, and Panasonic's smart greenhouse systems, which optimize temperature and humidity for yogurt fermentation, are transforming the industry. Hokkaido cooperatives are testing silvopasture models. These advancements are not incremental but transformative, reconfiguring value chains, enabling smaller processors to focus on quality over scale, and creating export opportunities for Japan's dairy products, particularly where ambient-stable offerings command premium prices.
Restraints Impact Analysis
| Restraint | (~) % Impact on CAGR Forecast | Geographic Relevance | Impact Timeline |
|---|---|---|---|
| Aging dairy-farmer population | -0.8% | National, with acute impact in rural prefectures outside Hokkaido | Short term (≤ 2 years) |
| Gen-Z shift toward plant-based options | -0.5% | National, with higher penetration in Tokyo, Osaka, and university cities | Medium term (2–4 years) |
| Limited availability of grazing land in Japan | -0.3% | National, with constraints most binding in Honshu and Kyushu | Long term (≥ 4 years) |
| Consumer concerns over lactose intolerance and dairy allergies | -0.4% | National | Medium term (2–4 years) |
| Source: Mordor Intelligence | |||
Aging dairy-farmer population
Japan's dairy workforce is aging rapidly, with over 70% of workers now 65 or older. This demographic trend is reducing production capacity and increasing operational risks. Many producers, burdened by rising feed, particularly in compound feed and stagnant farmgate milk prices, are operating at a loss and considering exiting the market. According to the Japan Dairy Association, raw milk production in Japan declined from 7.53 million tons in 2022 to 7.32 million tons in 2023 [3]Source: Japan Dairy Association, "Production volume of raw milk", nyukyou.jp. In June 2024, the government introduced a revised foreign labor policy, which includes a three-year development program to transition technical interns into Specified Skilled Workers. Although the program explicitly covers livestock farming, its implementation is delayed until 2027 and is expected to result in only a modest annual intake. Succession mechanisms, such as the Hokkaido Agricultural Public Corporation's five-year lease-to-own program and the Zenraku Academy's three-year training pathway, have supported the establishment of approximately 400 new farms since 1982. However, these initiatives address only a small portion of the annual retirements. The demographic challenges are driving consolidation, with herd sizes gradually increasing and corporate entities acquiring retired farms. Despite these efforts, the rate of consolidation lags behind the rate of exits, creating a structural supply deficit that imports and productivity improvements can only partially mitigate.
Gen-z shift toward plant-based options
Soy milk, supported by Kikkoman's market leadership, drives the growth of plant-based dairy alternatives, which are gaining popularity among younger consumers focused on environmental sustainability and animal welfare. In March 2024, Megmilk Snow Brand launched its "Plant Label" brand, introducing soy-based beverages. This initiative highlights the industry's recognition that protecting market share necessitates diversification into non-dairy categories. The trend is most prominent in urban areas and university towns, where Gen-Z consumers demonstrate a higher willingness to pay for sustainably sourced products and show less loyalty to traditional dairy formats. While plant-based alternatives currently represent a small portion of total dairy-equivalent volume, their growth rate is significantly higher, prompting retailers to adapt their category management and promotional strategies. To retain consumers who are reducing but not completely eliminating dairy consumption, dairy processors are developing hybrid products, such as yogurt blends made with almond or coconut milk.
Segment Analysis
By Product Type: Yogurt Leads, Milk Accelerates
In 2024, yogurt accounted for 36.52% of Japan's dairy market, reinforcing its role as a breakfast essential, a popular snack, and a health-focused product. Meanwhile, milk is expected to grow at the fastest rate among dairy products, with a forecasted CAGR of 4.95% through 2030. Probiotic advancements drive yogurt's leadership: Kirin's LC-Plasma strain, Meiji's R-1 series, and Morinaga's bifidobacteria formulations have elevated yogurt from a basic commodity to a preventive health product. Manufacturers have also obtained "Foods with Function Claims" certifications, enabling them to promote immune-support benefits on packaging. Drinkable yogurt formats appeal to on-the-go consumers, while spoonable options are preferred for sit-down breakfasts and post-meal consumption. Milk's growth is supported by ultra-high-temperature processing, which extends its shelf life to 150 days and facilitates room-temperature distribution. This innovation reduces cold-chain expenses and increases accessibility, particularly in rural areas and among single-person households. Flavored milk options, such as coffee, matcha, and strawberry, are gaining popularity with younger consumers, and UHT milk is also experiencing growth.
Cheese ranks as the third-largest segment, with natural cheese showing significant growth. This expansion in natural cheese is driven by its adoption in Western-style cooking and a shift toward premium products. Consumers are increasingly choosing Cheddar, Parmesan, and artisanal varieties for cooking and charcuterie boards. Cream, including fresh, cooking, and whipping variants, serves both foodservice and home-baking needs, with demand peaking during holiday seasons. Dairy desserts, such as ice cream, cheesecakes, and frozen treats, are growing as indulgence categories. Notable flavor innovations include Morinaga's Pino Matcha and Meiji's collaborative desserts. Sour milk drinks, a niche category, attract consumers seeking tangy, fermented flavors and probiotic benefits. This segmentation reveals a dual market structure: yogurt and milk drive volume, while cheese and desserts boost margins. As a result, processors are strategically managing their portfolios to optimize both revenue and profitability.

Note: Segment shares of all individual segments available upon report purchase
By Distribution Channel: Off-Trade Dominates, On-Trade Rebounds
In 2024, off-trade channels accounted for 71.75% of Japan's dairy market revenue, highlighting the extensive presence of convenience stores and supermarkets in food-and-beverage sales. Convenience stores, strategically located in urban areas and operating 24/7, have become key points for impulse purchases, offering single-serve yogurt, flavored milk, and cheese snacks. Supermarkets and hypermarkets, led by chains like Aeon and Ito-Yokado, attract consumers with a broader product range and promotional pricing, encouraging bulk buying and pantry stocking. Online retail, which gained momentum during COVID-19 and continues to grow through subscription models, is increasing its market share. Platforms such as Amazon Fresh and Rakuten simplify the delivery of ambient-stable UHT milk and frozen desserts, effectively addressing cold-chain logistics challenges. Specialist retailers, including organic and health-food stores, cater to premium and niche markets, while warehouse clubs and gas stations capture opportunistic purchases.
On-trade channels, comprising cafés, restaurants, hotels, and institutional buyers, are experiencing the fastest growth among distribution types, with a 5.38% CAGR projected through 2030. This growth is driven by the recovery of inbound tourism and the expansion of the foodservice sector. Cafés are boosting demand for premium milk varieties, such as grass-fed, organic, and barista-grade, that command higher prices than standard fluid milk. Hotels and fine-dining establishments are curating cheese and dessert menus featuring artisan and imported selections. Institutional buyers, including schools, hospitals, and corporate cafeterias, are focusing on functional dairy products, like probiotic yogurt and fortified milk, that align with wellness trends and dietary guidelines. Domestic producers are benefiting from this on-trade growth by supplying foodservice-grade products, such as bulk cream, shredded cheese, and portion-controlled butter, which are not typically available in off-trade channels. This evolving landscape is creating a two-tier market: off-trade channels emphasize convenience and affordability, while on-trade channels focus on quality and experience. Processors are adapting product specifications, packaging, and pricing to meet the needs of both segments.
Geography Analysis
Hokkaido dominates Japan's dairy market, producing over 50% of the nation's raw milk and hosting the majority of pastured cattle. This dominance is driven by its cooler climate, expansive land compared to other prefectures, and historical investments in dairy infrastructure, including cooperative processing facilities and cold-chain logistics. The region leads in automation, with farms adopting robotic milking systems and piloting silvopasture and intensive rotational grazing. On the consumption side, metropolitan areas like Tokyo, Osaka, and Nagoya account for significant retail sales. Urban prefectures such as Tokyo, Kanagawa, Osaka, and Aichi are driving premiumization, with consumers willing to pay more for functional yogurt, artisan cheese, and grass-fed milk. Retail assortments in these areas increasingly favor single-serve, on-the-go formats that cater to commuter lifestyles.
Rural prefectures outside Hokkaido, including Tohoku, Chugoku, and Kyushu, face challenges such as labor shortages and farm consolidation pressures. These regions are experiencing a decline in dairy farming households, with average herd sizes remaining small by international standards. However, government subsidies under the Smart Agriculture initiative are helping to offset costs for robotic milking and sensor technology. Cooperative-led succession programs are also addressing these challenges by matching retiring farmers with young entrants. In June 2024, the Ministry of Agriculture introduced a revised foreign labor policy, aiming to include livestock farming in the Specified Skilled Worker visa program by 2027. This policy seeks to stabilize labor supply in regions where domestic recruitment has stalled.
Okinawa and southern prefectures, characterized by warmer climates and limited grazing land, rely heavily on imported dairy products and exhibit lower per-capita consumption. However, tourism-driven foodservice demand is creating niche opportunities for premium ice cream and dessert formats. The geographic fragmentation of Japan's dairy market highlights a strategic challenge: production is concentrated in Hokkaido, while consumption is dispersed across the country. To address this, processors are investing in advanced cold-chain logistics, regional distribution centers, and UHT capacity to optimize reach and manage costs effectively.
Competitive Landscape
The Japanese dairy market is moderately consolidated, with Meiji Dairy Corp., Morinaga Milk Industry Co. Ltd, Danone SA, Yakult Honsha Co. Ltd, and Megmilk Snow Brand Co. Ltd. collectively commanding significant share through vertically integrated supply chains, decades of brand equity, and extensive cold-chain infrastructure that spans farm procurement, processing, and retail distribution. They focus on rapid innovation, introducing numerous SKUs annually across yogurt, milk, cheese, and dessert categories. Additionally, they utilize real-time point-of-sale data from convenience store partnerships to quickly test and scale new products. Multinational companies like Danone, Fonterra, Arla, and Savencia are targeting niche markets by emphasizing grass-fed branding, organic certifications, and functional ingredients. These firms aim at premium segments where consumers are less price-sensitive and prioritize differentiation. Reflecting the industry's growing focus on sustainability, Danone partnered with Ajinomoto in September 2024 to reduce CO2 emissions in dairy supply chains using AjiPro-L feed supplements. Fonterra Japan highlights New Zealand's grass-fed products and has secured distribution for its protein drinks in 7-Eleven stores. Meanwhile, Arla is converting its ARINCO facility into an ingredients hub and collaborating with Sodiaal to expand European cheese imports.
In Japan's dairy sector, companies are prioritizing product innovation and operational efficiency to maintain their competitive edge. Leading players are expanding their product portfolios with new launches, particularly in yogurt and functional dairy products, to appeal to health-conscious consumers. To ensure product safety and consistency, firms are enhancing their distribution networks and implementing advanced quality control measures in manufacturing. Many companies are forming strategic partnerships with local farmers and increasing research and development investments to secure raw materials and drive innovation. Additionally, while strengthening their domestic operations through facility modernization and capacity expansion, manufacturers are also exploring opportunities in international markets, especially in Asia.
Opportunities are emerging in lactose-free, A2 beta-casein, and hybrid dairy-plant formats, where demand exceeds supply. Direct-to-consumer channels, which bypass traditional retail intermediaries and offer higher margins, are also gaining momentum. Smaller players like Takanashi Dairy and Koiwai Dairy (a Kirin subsidiary) are capitalizing on regional authenticity and on-farm processing to command premium pricing. Technology-driven disruptors are leveraging precision fermentation to produce dairy proteins without cows, a development that could transform ingredient sourcing by the 2030s. Kirin's LC-Plasma licensing model, which incorporates its proprietary lactobacillus strain into third-party products, illustrates how intellectual property can be monetized across the dairy value chain. This approach generates royalty income and expands market presence without requiring significant manufacturing investments. Competition is most intense in yogurt and flavored milk segments, where product life cycles are short and shelf space is highly contested. To build consumer loyalty and counter private-label competition, processors are investing in engagement initiatives such as farm tours, tasting events, and digital communities. The market is evolving, with large-scale players focusing on volume and efficiency, while niche entrants emphasize storytelling, quality, and functional benefits. The market's size and diversity allow both strategies to coexist and succeed.
Japan Dairy Industry Leaders
-
Danone SA
-
Megmilk Snow Brand Co. Ltd.
-
Meiji Dairies Corp.
-
Morinaga Milk Industry Co. Ltd.
-
Yakult Honsha Co. Ltd.
- *Disclaimer: Major Players sorted in no particular order
Recent Industry Developments
- October 2025: Meiji has introduced yogurt products designed to help regulate blood sugar levels. The new products, 'Meiji Haemoglobin A1c Countermeasure Yogurt' and its drinkable variant, 'Meiji Haemoglobin A1c Countermeasure Yogurt Drink Type', will be available nationwide.
- March 2025: Meiji Co., Ltd. introduced "Meiji W no Skincare Yogurt," a functional yogurt developed to help consumers address UV exposure and skin dryness from within. The product is advertised as a Food with Functional Claims (FFC).
- March 2024: Kaneka Group's Betsukai Wellness Farm, recognized for its organic circular dairy farming, has introduced Pur Natur™, an organic milk made exclusively from its organic raw milk. This product features the rich flavor of milk derived from cows raised on the farm's fertile lands.
Japan Dairy Market Report Scope
| Butter | Salted Butter | |
| Unsalted Butter | ||
| Cheese | Natural Cheese | Cheddar |
| Cottage | ||
| Ricotta | ||
| Parmesan | ||
| Others | ||
| Processed Cheese | ||
| Cream | Fresh Cream | |
| Cooking Cream | ||
| Whippng Cream | ||
| Others (Clottted, Sour Cream) | ||
| Dairy Desserts | Ice Cream | |
| Cheesecakes | ||
| Frozen Desserts | ||
| Others (Puddings/desserts, trifles, fools) | ||
| Milk | Condensed milk | |
| Flavored Milk | ||
| Fresh Milk | ||
| UHT Milk (Ultra-high temperature milk) | ||
| Powdered Milk | ||
| Yogurt | Drinkable | |
| Spoonable | ||
| Sour Milk Drinks | ||
| On-trade | |
| Off-trade | Convenience Stores |
| Specialist Retailers | |
| Supermarkets and Hypermarkets | |
| On-line Retail | |
| Others (Warehouse clubs, gas stations, etc.) |
| Product Type | Butter | Salted Butter | |
| Unsalted Butter | |||
| Cheese | Natural Cheese | Cheddar | |
| Cottage | |||
| Ricotta | |||
| Parmesan | |||
| Others | |||
| Processed Cheese | |||
| Cream | Fresh Cream | ||
| Cooking Cream | |||
| Whippng Cream | |||
| Others (Clottted, Sour Cream) | |||
| Dairy Desserts | Ice Cream | ||
| Cheesecakes | |||
| Frozen Desserts | |||
| Others (Puddings/desserts, trifles, fools) | |||
| Milk | Condensed milk | ||
| Flavored Milk | |||
| Fresh Milk | |||
| UHT Milk (Ultra-high temperature milk) | |||
| Powdered Milk | |||
| Yogurt | Drinkable | ||
| Spoonable | |||
| Sour Milk Drinks | |||
| Distribution Channel | On-trade | ||
| Off-trade | Convenience Stores | ||
| Specialist Retailers | |||
| Supermarkets and Hypermarkets | |||
| On-line Retail | |||
| Others (Warehouse clubs, gas stations, etc.) | |||
Market Definition
- Butter - Butter is a yellow-to-white solid emulsion of fat globules, water, and inorganic salts produced by churning the cream from cows’ milk
- Dairy - Dairy product include milk and any of the foods made from milk, including butter, cheese, ice cream, yogurt, and condensed and dried milk.
- Frozen Desserts - Frozen dairy dessert means and includes products containing milk or cream and other ingredients which are frozen or semi-frozen prior to consumption, such as ice milk or sherbet, including frozen dairy desserts for special dietary purposes, and sorbet
- Sour Milk Drinks - Sour milk is thick, curdled milk, with a sour taste, obtained from the fermentation of milk. Sour milk drinks such as kefir, laban, buttermilk have been considered in the study
| Keyword | Definition |
|---|---|
| Cultured Butter | Cultured butter is prepared by having the raw butter go through chemical processing and has been added with certain emulsifiers and foreign ingredients. |
| Uncultured Butter | This type of butter is one which has not been processed in any way |
| Natural Cheese | The type of cheese in its most natural form. It is made from natural and simple products and ingredients, including fresh and natural salts, natural colors, enzymes, and high-quality milk. |
| Processed Cheese | Processed cheese undergoes the same processes as natural cheese; however, it requires more steps and many different forms of ingredients. Making processed cheese involves melting natural cheese, emulsifying it, and adding preservatives and other artificial ingredients or colorings. |
| Single Cream | Single cream contains around 18% fat. It’s a single layer of cream that appears over boiled milk. |
| Double Cream | Double cream contains 48% fat, more than double the amount of fat of single cream. It’s heavier and thicker than single cream |
| Whipping Cream | This has a much higher fat percentage than single cream (36%). Used to top cakes, pies, and puddings and as a thickener for sauces, soups, and fillings. |
| Frozen Desserts | Desserts that are meant to be eaten in frozen condition. E.g., sherbets, sorbets, frozen yogurts |
| UHT Milk (Ultra-high temperature milk) | Milk heated at a very high temperature. Ultra-high-temperature processing (UHT) of milk involves heating for 1–8 sec at 135–154°C. which kills the spore-forming pathogenic microorganism, resulting in a product with a shelf-life of several months. |
| Non-dairy butter/Plant-based butter | Butter made from plant-derived oil such as coconut, palm, etc. |
| Non-dairy Yogurt | Yogurt made from typically made from nuts, like almonds, cashews, coconuts, and even other foods like soybeans, plantains, oats, and peas |
| On-trade | It refers to restaurants, QSRs, and bars. |
| Off-trade | It refers to supermarkets, hypermarkets, on-line channels, etc. |
| Neufchatel cheese | One of the oldest kinds of cheese in France. It is a soft, slightly crumbly, mold-ripened, bloomy-rind cheese made in the Neufchâtel-en-Bray region of Normandy. |
| Flexitarian | It refers to a consumer preferring a semi-vegetarian diet, that is centered on plant foods with limited or occasional inclusion of meat. |
| Lactose Intolerance | Lactose intolerance is a reaction in digestive system to lactose, the sugar in milk. It causes uncomfortable symptoms in response to the consumption of dairy products. |
| Cream Cheese | Cream cheese is a soft and creamy fresh cheese with a tangy taste made from milk and cream. |
| Sorbets | Sorbet is a frozen dessert made using ice combined with fruit juice, fruit purée, or other ingredients, such as wine, liqueur, or honey. |
| Sherbet | Sherbet is a sweetened frozen dessert made with fruit and some sort of dairy product such as milk or cream. |
| Shelf stable | Foods that can be safely stored at room temperature, or "on the shelf," for at least one year and do not have to be cooked or refrigerated to eat safely. |
| DSD | Direct Store Delivery is the process in supply chain management wherein the product is delivered from manufacturing plant directly to the retailer. |
| OU Kosher | Orthodox Union Kosher is a kosher certification agency based in New York City. |
| Gelato | Gelato is a frozen creamy dessert made with milk, heavy cream and sugar. |
| Grass-fed Cows | Grass-fed cows are allowed to graze in pastures, where they eat a variety of grasses and clover. |
Research Methodology
Mordor Intelligence follows a four-step methodology in all our reports.
- Step-1: Identify Key Variables: In order to build a robust forecasting methodology, the variables and factors identified in Step 1 are tested against available historical market numbers. Through an iterative process, the variables required for market forecast are set, and the model is built on the basis of these variables.
- Step-2: Build a Market Model: Market-size estimations for the forecast years are in nominal terms. Inflation is not a part of the pricing, and the average selling price (ASP) is kept constant throughout the forecast period for each country.
- Step-3: Validate and Finalize: In this important step, all market numbers, variables, and analyst calls are validated through an extensive network of primary research experts from the market studied. The respondents are selected across levels and functions to generate a holistic picture of the market studied.
- Step-4: Research Outputs: Syndicated Reports, Custom Consulting Assignments, Databases & Subscription Platforms


