
Market Overview
| Study Period | 2020 - 2031 |
|---|---|
| Forecast Data Period | 2026 - 2031 |
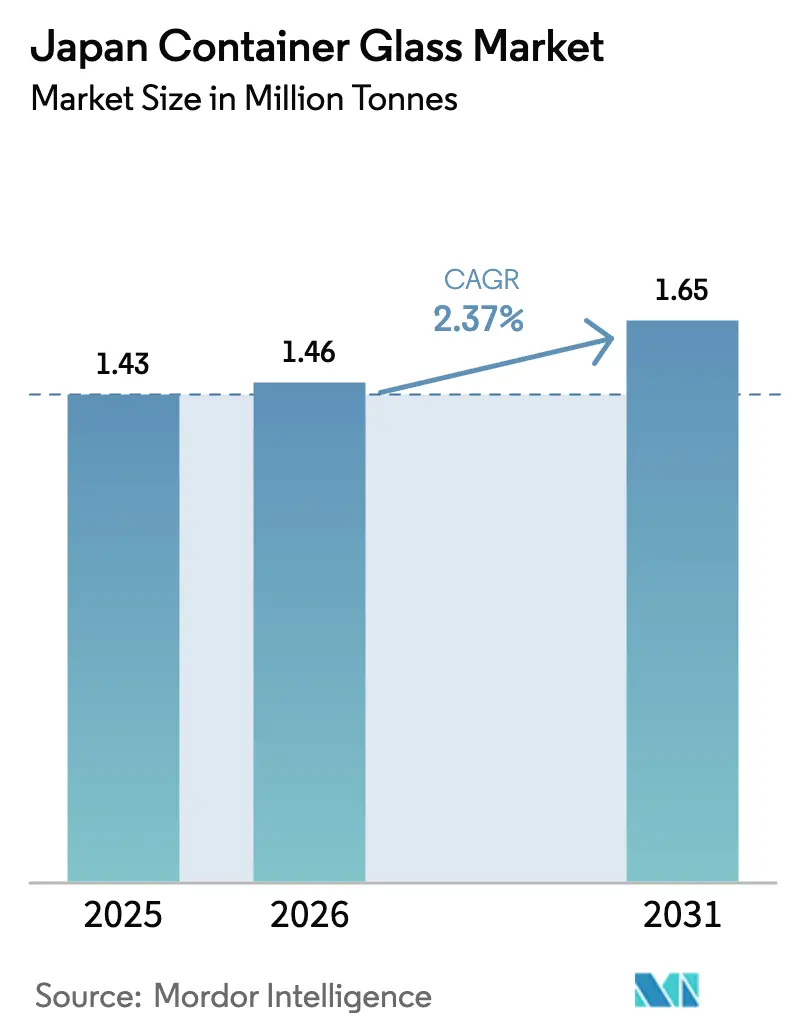
| Base Year Market Size (2025) | 1.43 Million tonnes |
| Market Volume (2026) | 1.46 Million tonnes |
| Market Volume (2031) | 1.65 Million tonnes |
| Growth Rate (2026 - 2031) | 2.37% CAGR |
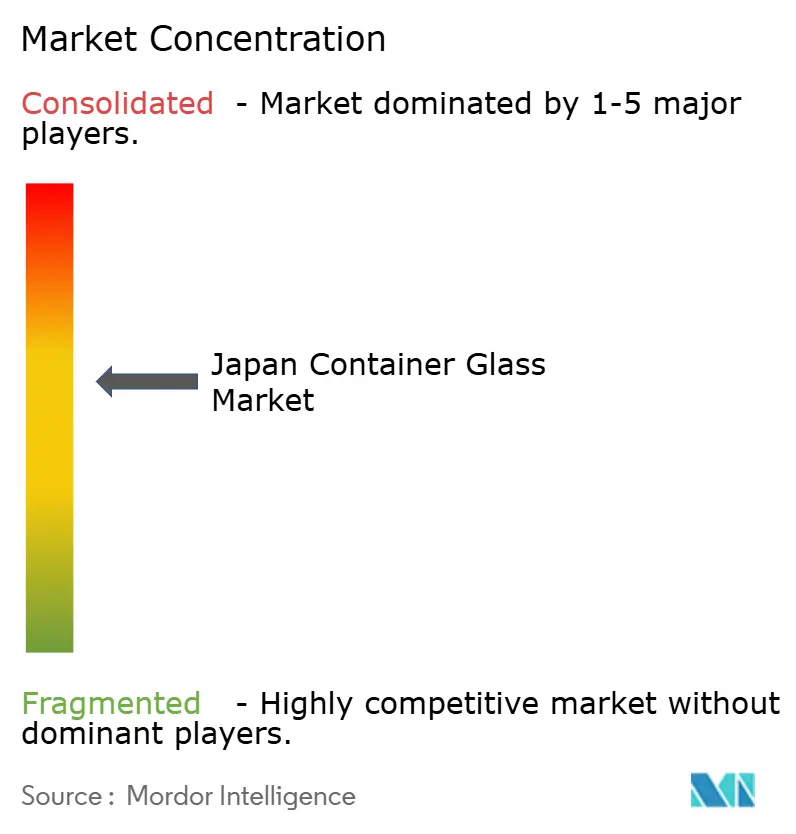
| Market Concentration | Medium |
Major Players *Disclaimer: Major Players sorted in no particular order Image © Mordor Intelligence. Reuse requires attribution under CC BY 4.0. | |
Japan Container Glass Market Analysis by Mordor Intelligence
The Japan Container Glass Market size is expected to grow from 1.43 million tonnes in 2025 to 1.46 million tonnes in 2026 and is forecast to reach 1.65 million tonnes by 2031 at 2.37% CAGR over 2026-2031. Healthy volumes continue despite intense competition from lightweight polymers because glass delivers premium shelf appeal, meets stringent pharmaceutical quality norms, and aligns with Japan’s circular-economy policies. Premium alcoholic beverages and export-oriented brewers retain glass for brand authenticity, while regulatory scrutiny of per- and polyfluoroalkyl substances (PFAS) shifts some food-contact applications back toward glass. Manufacturers counter energy cost pressures through furnace electrification, hydrogen fuel trials, and lightweight bottle designs, which collectively stabilize margins. Meanwhile, a well-established glass-to-glass recycling loop supplies high-grade cullet that cushions raw-material inflation and supports national waste-reduction targets.
Key Report Takeaways
- By end-user, beverages captured 59.02% of the Japan container glass market share in 2025.
- By color, the Japan container glass market size for the amber glass segment is projected to grow at 4.42% CAGR between 2026-2031.
Note: Market size and forecast figures in this report are generated using Mordor Intelligence’s proprietary estimation framework, updated with the latest available data and insights as of 2026.
Japan Container Glass Market Trends and Insights
Drivers Impact Analysis*
| Driver | (~) % Impact on CAGR Forecast | Geographic Relevance | Impact Timeline |
|---|---|---|---|
| Environmental Sustainability and Regulatory Support | +0.6% | National, with early gains in Tokyo, Osaka metropolitan areas | Medium term (2-4 years) |
| Premium Branding and Product Differentiation | +0.5% | National, concentrated in urban consumption centers | Long term (≥ 4 years) |
| Robust Growth in Beverage and Alcoholic Drink Segments | +0.4% | National, with export spillover effects | Short term (≤ 2 years) |
| Rising Demand in Pharmaceuticals and Personal Care | +0.3% | National, with manufacturing clusters in Kansai region | Medium term (2-4 years) |
| Technological Advancements in Glass Manufacturing - Energy Efficiency | +0.2% | National, focused at major production facilities | Long term (≥ 4 years) |
| Technological Advancements in Glass Manufacturing - Product Innovation | +0.2% | National, with R&D centers leading adoption | Long term (≥ 4 years) |
| Source: Mordor Intelligence | |||
Environmental Sustainability and Regulatory Support
Japan’s glass producers benefit from a policy mix that elevates glass as the most circular rigid-packaging substrate. The Glass Bottle Recycling Mark scheme grows cullet recovery rates, and emerging PFAS controls accentuate glass’s inert nature in food contact settings.[1]AGC Inc., “AGC Glass Europe and ROSI Announce Strategic Partnership,” agc.com Nationwide waste-reduction targets encourage retailers to specify minimum recycled-content thresholds that glass can meet without quality loss. Energy-conservation mandates also incentivize furnace-rebuild projects that integrate electrical boosting, which cuts overall fuel intensity and unlocks carbon-price credits. Public sentiment favors plastic-waste reduction, creating an enduring demand pull that cushions the Japan Container Glass market against polymer substitution in sensitive categories.
Premium Branding and Product Differentiation
Brand owners leverage the tactile and visual cues of glass to justify premium shelf prices. Craft soft-drink maker Hata Kōsen revived its all-glass Ramune bottle after a 30-year hiatus, capitalizing on nostalgia and sensory ritual to command case prices of JPY 7,776 (USD 53.7). In cosmetics, small-batch glass jars enable intricate embossing and color-spray effects that mass-market plastics cannot replicate at low volumes. Breweries maintain heavy glass formats for flagship beers abroad because exporters note a direct link between glass bottling and perceived authenticity. The design latitude benefits specialty converters that offer limited-run, high-margin orders, supporting a bifurcated competitive landscape.
Robust Growth in Beverage and Alcoholic Drink Segments
Japan’s brewers pursue double-digit export growth while retaining glass to reinforce heritage cues in overseas markets. Sake export revenue climbed to JPY 43.47 billion (USD 0.30 billion) in 2024, a 5.8% year-over-year rise, with premium labels shipped almost exclusively in glass flasks. Domestically, craft beer, ready-to-drink cocktails, and artisanal kombucha broaden glass’s beverage footprint even as mainstream soft-drink lines migrate to bio-PET. These export-driven and niche-premium gains offset demographic headwinds from Japan’s aging population, maintaining a stable demand floor for the Japan Container Glass market.
Rising Demand in Pharmaceuticals and Personal Care
Stringent drug-stability requirements keep vials, cartridges, and ampoules firmly glass-anchored. SCHOTT Pharma recorded 54% growth in its drug-delivery division, underscoring global appetite for prefillable syringes made from specialized borosilicate glass.[2]SCHOTT Pharma, “SCHOTT Pharma Delivers on 2023 Targets,” schott-pharma.com Japanese vial converters adopt protective labeling systems such as Iwata Label’s VPP2 to reduce particulate shedding and uphold clean-room compliance. In personal care, sustainability-minded consumers accept heavier glass jars in exchange for perceived purity and recyclability. Together, these applications add incremental tonnage that cushions cyclical swings in food or beverage glass demand.
Restraints Impact Analysis*
| Restraint | (~) % Impact on CAGR Forecast | Geographic Relevance | Impact Timeline |
|---|---|---|---|
| High Energy and Production Costs | -0.4% | National, concentrated at major production facilities | Short term (≤ 2 years) |
| Intense Competition from Substitute Packaging Materials | -0.3% | National, with urban markets most affected | Medium term (2-4 years) |
| Fragility and Risk of Breakage During Handling and Transport | -0.2% | National, with higher impact in remote distribution areas | Medium term (2-4 years) |
| Supply Chain Vulnerabilities and Raw Material Constraints | -0.3% | National, with import-dependent facilities most exposed | Short term (≤ 2 years) |
| Source: Mordor Intelligence | |||
High Energy and Production Costs
Fuel and electricity account for more than one-third of furnace operating expenses. Natural-gas import prices spiked after 2022, and a weak yen inflated soda-ash and additive costs, compressing margins for commodity bottle lines.[3]Statistics Bureau, “Statistical Handbook of Japan 2024,” stat.go.jp Furnace rebuilds that integrate oxy-fuel or electric-boosting technology demand capex outlays that can reach USD 400 million, prolonging payback horizons. Although some producers test hydrogen blends, supply-chain scale remains limited, and carbon-price offsets have yet to fully compensate higher fuel bills. These dynamics weigh on near-term profitability and could slow capacity additions within the Japan Container Glass market.
Intense Competition from Substitute Packaging Materials
Advances in bio-based and chemically recycled PET lower the environmental gap with glass while retaining weight and logistics advantages. Suntory’s bio-PET road-map targets 100% plant-derived resin for flagship drinks, and bottle weights now dip below 20 g for 500 mL formats. Lightweight plastics erode glass’s share in cost-sensitive, high-turnover categories such as economy tea and functional beverages. Although glass retains niches tied to prestige and product integrity, polymer innovators continuously close performance gaps, restraining volume growth trajectories in the Japan Container Glass market.
*Our forecasts treat driver/restraint impacts as directional, not additive. The impact forecasts reflect baseline growth, mix effects, and variable interactions.
Segment Analysis
By End-User: Beverages Retain Scale as Cosmetics Accelerate
The beverages domain occupied 59.02% of the Japan Container Glass market share in 2025, illustrating how entrenched drinking rituals and export ambitions underpin bulk volumes. Alcoholic brands continue to favor glass for flavor neutrality and premium heft, while ready-to-drink cocktails and craft sodas adopt custom bottles that amplify visual storytelling. Non-alcoholic mainstream lines have partly migrated to PET, yet smaller artisanal players counterbalance this slide by choosing glass to convey heritage and authenticity. Pharmaceutical demand remains steady because injectable drugs and vita-liquids require inert, impermeable primary containers. Cosmetics and personal care advance at a 3.18% CAGR, propelled by consumer willingness to pay for refillable glass jars that enhance bathroom aesthetics and reduce plastic waste. Food applications are split between premium condiments, where transparency reinforces quality cues, and commodity sauces that lean on plastic to save on transport costs. Perfumery, although niche, adds high-margin tonnage because brand owners demand complex shapes and color effects that only glass can sustain.
Continued beverage dominance ensures base-load furnace utilization, yet margin growth shifts toward specialty segments. Cosmetics formulators increasingly specify color-spray coatings, electroplated finishes, and low-profile neck finishes that smaller converters can deliver with agile tooling. Pharmaceutical suppliers uphold top-tier clean-room standards and hero products such as Type I borosilicate vials, which carry price premiums over standard soda-lime bottles. Export-oriented brewers and sake producers blend traditional bottle silhouettes with lightweight structures, showing that even volume-centric categories aim for material reduction. The Japan Container Glass market therefore evolves from a single-segment powerhouse toward a diversified demand portfolio that balances volume stability with premium revenue streams.
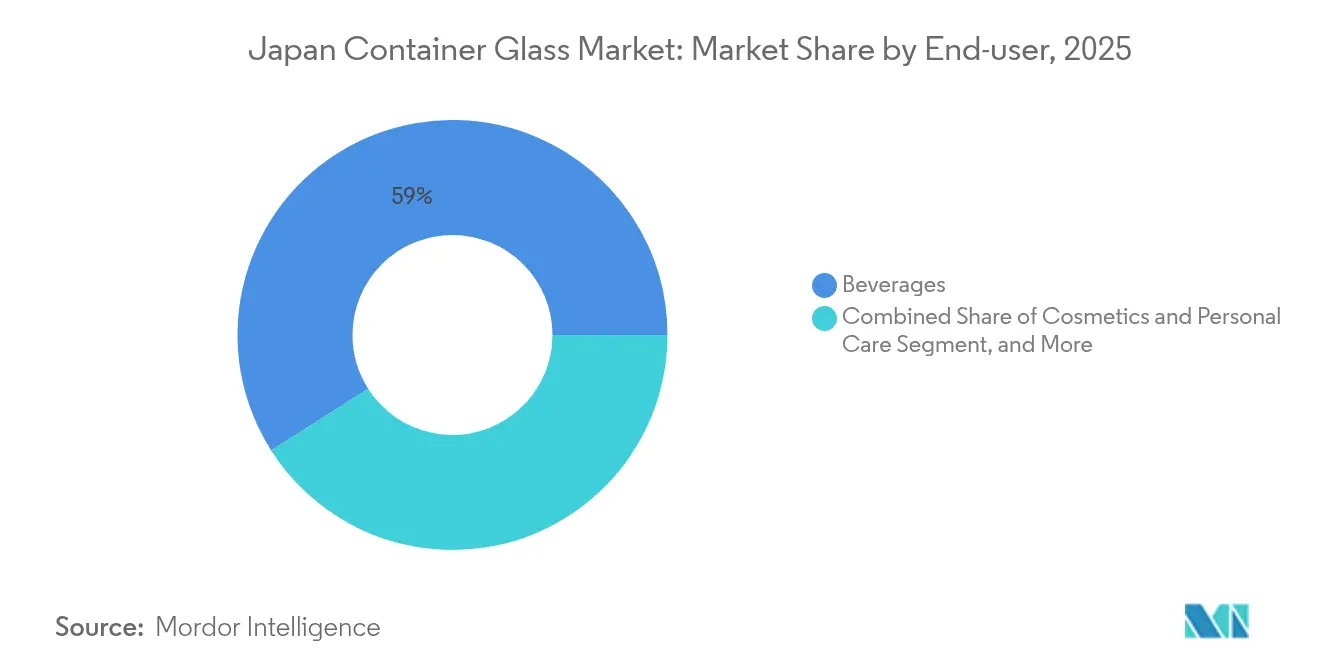


By Color: Flint Commands Visibility While Amber Gains Pharmaceutical Momentum
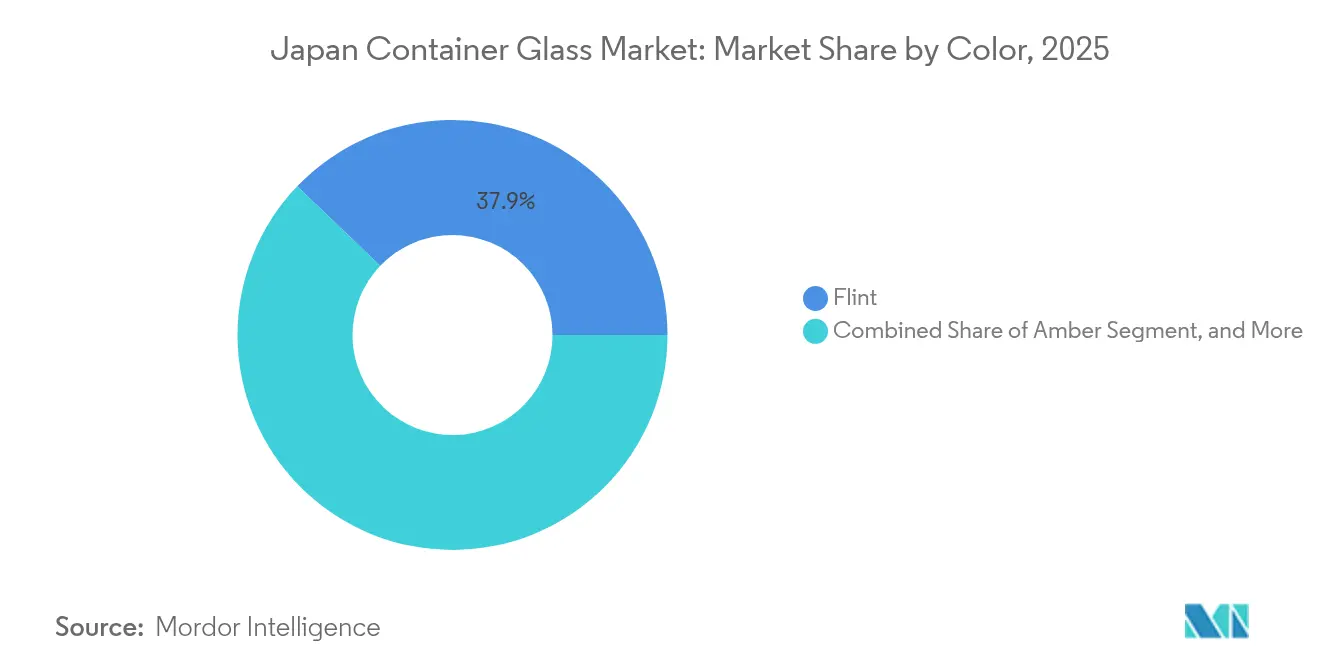
Flint containers captured 37.85% of the Japan Container Glass market in 2025, their transparency showcasing liquid clarity in sake, shochu, craft sodas, and premium soy sauces. Brand managers leverage full-body shrink sleeves and direct-to-glass digital printing to add graphics without obscuring contents. Consumers equate visible product with freshness, sustaining Flint’s position despite light-exposure concerns. Amber bottles, meanwhile, post the highest 4.42% CAGR through 2031 as drug makers and craft breweries seek ultraviolet protection. Japan’s pharmacopoeia mandates amber vials for certain antibiotics and injectable vitamins, driving steady off-take. Craft beer exporters prefer amber to signal authenticity in Western markets, reinforcing aesthetic tradition while safeguarding hop-related compounds.
Green glass remains limited to wine and select liqueurs, where color harmonizes with brand heritage. Other hues cobalt, ruby, and frost finishes, serve high-end cosmetics and perfumery. Color choice plays into product storytelling: a smoky gray tint may suggest smoky whisky, while deep blue bottles evoke marine freshness in niche mineral waters. Production flexibility matters; multi-color forehearths allow rapid switchover without furnace idling, giving nimble producers a competitive edge. Overall, color dynamics illustrate how the Japan Container Glass market shifts from purely functional considerations toward marketing-driven aesthetics that motivate brand owners to absorb color-related cost uplifts.
Geography Analysis
The Kansai industrial corridor around Osaka and Hyogo hosts the lion’s share of melting capacity, capitalizing on proximity to recycled-glass processors, bottle decoration houses, and beverage fillers. Plants in this cluster enjoy integrated logistics, but elevated regional power tariffs prompt ongoing energy-efficiency upgrades. Tokyo and surrounding prefectures account for the largest consumption node, fueled by dense population, tourism inflows, and headquarters of cosmetics and pharmaceutical majors. Kanto-based fillers rely on high-speed rail and coastal shipping to draw bottles from Kansai, balancing inbound cullet flows from metropolitan recycling streams with outbound finished goods.
Kyushu and northern Honshu provide secondary melting sites that specialize in smaller bottle formats for regional craft breweries and shochu distilleries. These peripheral plants alleviate freight costs for fragile shipments and support local economies, yet their medium-scale furnaces face sharper cost exposure when energy prices spike. Coastal layouts near Kobe and Nagoya facilitate export containerization, enabling sake, beer, and soy sauce shippers to load palletized glass directly onto vessels bound for China, the United States, and Southeast Asia. Glass exports reached USD 649.28 million in 2024, underscoring the strategic importance of port-adjacent capacity.
Japan’s island geography complicates domestic distribution, prompting producers to favor regional depots and lightweight bottles to cut backhaul fuel burn. Urban recycling schemes supply a steady cullet stream, yet rural prefectures show lower collection yields, forcing long-haul cullet transport that dents sustainability metrics. Nonetheless, geographic concentration of technical know-how within traditional glass regions confers expertise advantages, even if it heightens local exposure to seismic events and labor shortages. The net outcome is a regionally balanced but capacity-dense network that supports the expansive needs of the Japan Container Glass market.
Regulatory Landscape
Japan container glass operates under the Containers and Packaging Recycling Law, which places recycling obligations on specified business entities involved in manufacturing, importing, and using packaged goods. The Japan Containers and Packaging Recycling Association (JCPRA), designated by five ministries, administers the scheme and requires obligated companies to declare and fulfill recycling responsibilities based on government survey-linked quantities.
Operationally, the Ministry of the Environment provides sorting standards that require separated discharge of glass into three streams, colorless, brown, and other colors. This directly affects cullet quality and glass-to-glass recycling feasibility, supporting access to high-grade cullet for domestic melting while reinforcing compliance-driven demand for traceable recycling routes across beverage, food, and pharmaceutical pack types.
Value Chain Analysis
The value chain begins with raw materials (silica sand, soda ash, limestone) and cullet, followed by melting and forming at container-glass furnaces, and then downstream decoration (coatings, embossing, labeling), closures, and shipment to fillers serving beverages, food, cosmetics, and pharmaceuticals. Japan's recycling loop is structurally built into the chain, with consumers discharging sorted glass, municipalities collecting and preparing the material, and obligated businesses funding recycling through the JCPRA system. This setup improves the consistency of cullet inflows for remelt.
On the manufacturing and technology layer, producers and partners are working on furnace and process upgrades that influence cost and emissions performance, including hydrogen-related combustion technologies and alternative-fuel research. Nihon Yamamura Glass has disclosed collaboration activity spanning industrial and academic partners, alongside ISO 14001-aligned environmental management, reflecting how compliance, energy strategy, and material circularity are increasingly managed as integrated supply-chain capabilities rather than standalone plant initiatives.
Competitive Landscape
Market concentration skews moderate: two integrated groups, Toyo Seikan Group Holdings and Nihon Yamamura Glass, anchor commodity supply, while a tier of specialists occupies cosmetics, pharma, and perfumery niches. Large players benefit from captive cap and label operations, enabling turnkey solutions that lock in beverage customers and mitigate margin erosion. Their scale supports multimillion-dollar furnace relines and hydrogen-trial pilots, positioning them favorably ahead of envisaged carbon-pricing schemes. Smaller converters such as Koa Glass, Ishizuka Glass, and Nipro’s vial division target high-complexity orders where agility outweighs scale, capturing premium margins through rapid design iterations and low minimum order quantities.
Strategic focus tilts toward sustainability. Yamamura Glass’s Reborn Cap project collects post-consumer closures, feeding them into recycled resin applications that complement glass’s circular narrative. Toyo Glass develops ultra-lightweight highball bottles, shaving up to 20% mass without compromising impact resistance, thereby reducing logistics emissions. Acquisition activity in adjacent substrates underscores wider packaging-sector consolidation: Sumitomo Bakelite’s purchase of AGC’s polycarbonate line signals broader material-agnostic portfolio building that could influence long-term competitive dynamics. Meanwhile, global mega-mergers such as the USD 15.7 billion Amcor-Berry deal raise the bar on purchasing power and R&D budgets, pressuring mid-sized Japanese players to differentiate or consolidate.
Customer intimacy and technical service remain decisive. Breweries demand on-site bottle-quality audits and rapid defect analysis, services that incumbent glassmakers have embedded within multi-decade relationships. Cosmetics brands seek custom molds with intricate embossing delivered within weeks; converters with 3D-printing prototyping equipment meet these expectations and lock in higher tooling fees. Pharmaceutical buyers insist on flawless inner-surface chemistry; suppliers respond with low-alkali borosilicate recipes and post-forming annealing controls. These specialized capabilities collectively sustain a competitive equilibrium where scale players guarantee volume security while niche firms supply high-value custom solutions, shaping the performance trajectory of the Japan Container Glass market.
Japan Container Glass Industry Leaders
Nihon Yamamura Glass Co. Ltd
Japan Seiko Glass Co., Ltd.
KOA Glass Co., LTD
Nihon Taisanbin Glass Bottle MFG, Co., Ltd.
Toyo Glass Co., Ltd. (Toyo Seikan Group Holdings, Inc.)
- *Disclaimer: Major Players sorted in no particular order

Market Opportunities and Future Outlook
Decarbonization-ready container glass supply is a practical whitespace as brand owners and fillers seek lower-carbon specifications while retaining glass performance for premium beverages and pharma-adjacent applications. In April 2025, Nihon Yamamura Glass demonstrated hydrogen-fueled glass bottle production. In September 2025, it initiated research with Osaka University to study substituting city gas with ammonia fuel in soda-lime glass furnaces, which creates a clearer pathway for differentiated, lower-carbon bottle offerings that can be marketed into premium and export-facing SKUs.
Another opportunity is improving recycled-content consistency through better color-sorted cullet and tighter recycling-chain coordination. The Containers and Packaging Recycling Law framework, administered through JCPRA and supported by Ministry of the Environment sorting standards (colorless, brown, other colors), provides a mechanism for glassmakers and brand owners to co-design specifications for high-quality remelt feedstock. This supports expansion of glass-to-glass loops in categories sensitive to material purity and inertness, while also helping offset energy and imported raw-material cost volatility through higher cullet utilization.
Recent Industry Developments
- June 2026: Nihon Yamamura Glass Co., Ltd. confirmed MOF-based CO2 separation and plasma-based CO2-to-CO conversion in a simulated glass melting furnace environment in collaboration with Atomis Co., Ltd. and Osaka Metropolitan University. Advances in CO2 utilization could influence operating costs and regulatory alignment for container glass production.
- April 2026: TOYO GLASS (Toyo Seikan Group Holdings, Inc.) commenced full-scale operation of a large-scale oxygen combustion glass melting furnace in Japan, designed to reduce greenhouse gas emissions by 20%. Strengthens sustainability credentials and potential cost/margin impact under carbon-pricing regimes.
- February 2026: Koa Glass Co., Ltd. exhibited at Paris Packaging Week (PCD), showcasing perfume bottles and glass lipsticks. Demonstrates high-value product capabilities and status in luxury packaging segments.


Research Methodology Framework and Report Scope
Market Definition and Coverage
This market covers container glass manufactured and sold in Japan for packaging applications, measured mainly in shipped or consumed volume (tonnes) across the key end uses that rely on glass containers.
Scope exclusions: We exclude non-container glass items such as flat glass, fiberglass, tableware, and technical glass products that are not used as packaging containers.
Segmentation Overview
- By End-user
- Beverages
- Alcoholic
- Beer
- Wine
- Spirits
- Other Alcoholic Beverages (Cider and Other Fermented Drinks)
- Non-Alcoholic
- Juices
- Carbonated Drinks (CSDs)
- Dairy Product Based Drinks
- Other Non-Alcoholic Beverages
- Alcoholic
- Food (Jam, Jelly, Marmalades, Honey, Sausages and Condiments, Oil, Pickles)
- Cosmetics and Personal Care
- Pharmaceuticals (excluding Vials and Ampoules)
- Perfumery
- Beverages
- By Color
- Green
- Amber
- Flint
- Other Colors
Data Sources, Market Sizing, and Validation
Desk Research
Desk research was used to map the demand and supply context for container glass in Japan before any modeling was finalized. We reviewed public statistics and technical references such as Japan customs trade data, METI industrial statistics, the Japan Glass Bottle Association publications, MOE Japan releases on circular economy and recycling, and relevant peer-reviewed packaging and materials journals.
These sources anchor basic inputs like beverage output direction, pharmaceutical packaging needs, recycling rates, and energy and raw material constraints that influence furnace operations. We also reviewed company annual reports, investor presentations, and press releases to capture capacity changes, furnace rebuild cycles, and product mix shifts, which are later checked in the model. Where needed, paid subscriptions for company financials and intelligence, patent databases, and shipment-level import-export data were used to cross-verify timelines and fill gaps that are not consistently reported in public datasets. The desk sources listed are illustrative, and many other public documents and data releases were also referenced for collection, cross checks, and clarification.
Primary Interviews and Surveys
Primary work focused on validating what is actually driving volume in Japan, and where substitutions or lightweighting are changing container counts per tonne. We spoke with a mix of container glass manufacturers, cullet and recycling stakeholders, packaging converters, and downstream users in beverages, food, and pharmaceuticals, and then checked their inputs against desk indicators to settle assumptions.
To reduce blind spots, interview coverage was balanced across commercial, operations, and procurement roles, since pricing, furnace utilization, and specification changes are often described differently across these groups.
Distribution of primary research fieldwork respondents
| Company type | Respondent position | Region |
|---|---|---|
| Top tier: 38% | CXOs: 12% | |
| Mid tier: 48% | Functional/Unit leaders: 28% | |
| Smaller Players: 14% | Managers: 60% |
Market-Sizing & Forecasting
Sizing starts from a top-down build where packaging demand pools are reconstructed from Japan end use production signals and container intensity assumptions, then converted into tonnes using typical container weight ranges and mix factors. Because reported series can differ by end use and timing, we check the output using selective bottom-up approximations, including supplier capacity direction, furnace rebuild additions, and sampled conversion of volume to tonnes using observed lightweighting trends.
Key inputs used in the model include container glass shipment and consumption volume direction (tonnes), returnable versus one-way share where relevant, cullet availability and cullet use rates, furnace utilization and rebuild cycles, and end use output indicators for alcoholic beverages, non alcoholic beverages, processed foods, and pharmaceutical packaging. When a data point is missing for a sub period, we apply conservative carry-forward logic and then test it through interviews and adjacent indicators, so the final total does not rely on a single source.
For forecasting, scenario analysis is used around two or three practical drivers that matter most in Japan, such as energy cost pressure on furnace operations, lightweighting pace, and recycling loop stability. The final path is chosen after it aligns with what interviewees expect for capacity stability, end market demand, and container specifications, which keeps the forecast explainable and repeatable.
Data Validation & Update Cycle
Validation is done through multiple cross checks before sign off, so the final totals match the most reasonable view of Japan demand and supply. We compare model outputs with independent signals like end use production trends, trade direction for related packaging inputs, and capacity events, then investigate variances when a shift looks too large for the underlying drivers.
Anomalies trigger a second review of assumptions, followed by targeted re contacts with industry participants when the gap cannot be explained from public signals alone. Reports are refreshed annually, and interim updates are made when material events occur, such as major furnace closures, restarts, or regulatory changes affecting packaging choices. Before delivery, a fresh analyst pass is completed so clients receive the latest updated view.
Mordor Intelligence's Japan Container Glass Market Size Versus Other Published Estimates
Published market sizes for Japan container glass can vary because the market can be expressed in value or volume, and because sources often choose different boundaries for what counts as a container. Even when the same geography is used, the year window, conversion factors, and treatment of recycled content can still move the final number.
By tracking key end use output indicators and refreshing the tonnes conversion logic each year, Mordor Intelligence keeps the estimate tied to container demand in Japan rather than broad glass packaging revenue that can include adjacent items.
Benchmark comparison
| Source | Market Size | Gaps in Research Methodology |
|---|---|---|
| Mordor Intelligence | USD 1.43 M (2025) | |
| Industry Data Portal A | USD 2.51 B (2025) | Uses a revenue based view that can bundle wider glass packaging categories and applies average price assumptions that are not linked back to Japan container tonnage. |
| Global Publisher B | USD 1.37 M (2025) | Uses shipment volume but relies on higher growth and different conversion choices around lightweighting and end use mix, which can inflate or deflate tonnes over time. |
The comparison shows that the biggest differences come from unit choice and boundary choices, not just math. When the scope is kept to container glass volume and the conversion checks are made explicit, the resulting market size is easier to trace back to real packaging demand signals and to repeat in future updates.


Key Questions Answered in the Report
What is the current size of the Japan Container Glass market?
The Japan Container Glass market size is 1.46 million tonnes in 2026 and is projected to reach 1.65 million tonnes by 2031.
Which end-user segment leads demand?
Beverages lead the market with 59.02% share in 2025, driven by premium alcoholic and export-oriented brands.
Which color segment is growing fastest?
Amber bottles post the highest 4.42% CAGR through 2031 thanks to pharmaceutical and craft-beverage adoption.
How are energy costs influencing producers?
Elevated gas and electricity prices push manufacturers toward furnace electrification and hydrogen-fuel trials to contain operating expenses.
Why do cosmetics brands prefer glass packaging today?
Glass conveys premium quality, supports refillable formats, and aligns with consumer sustainability expectations, enabling brands to charge higher prices.
What is the market concentration level in this sector?
The market scores 6 on a 10-point concentration scale because the top five players control slightly more than 60% of domestic container-glass volume.
Page last updated on:






