
Market Overview
| Study Period | 2020 - 2031 |
|---|---|
| Forecast Data Period | 2026 - 2031 |
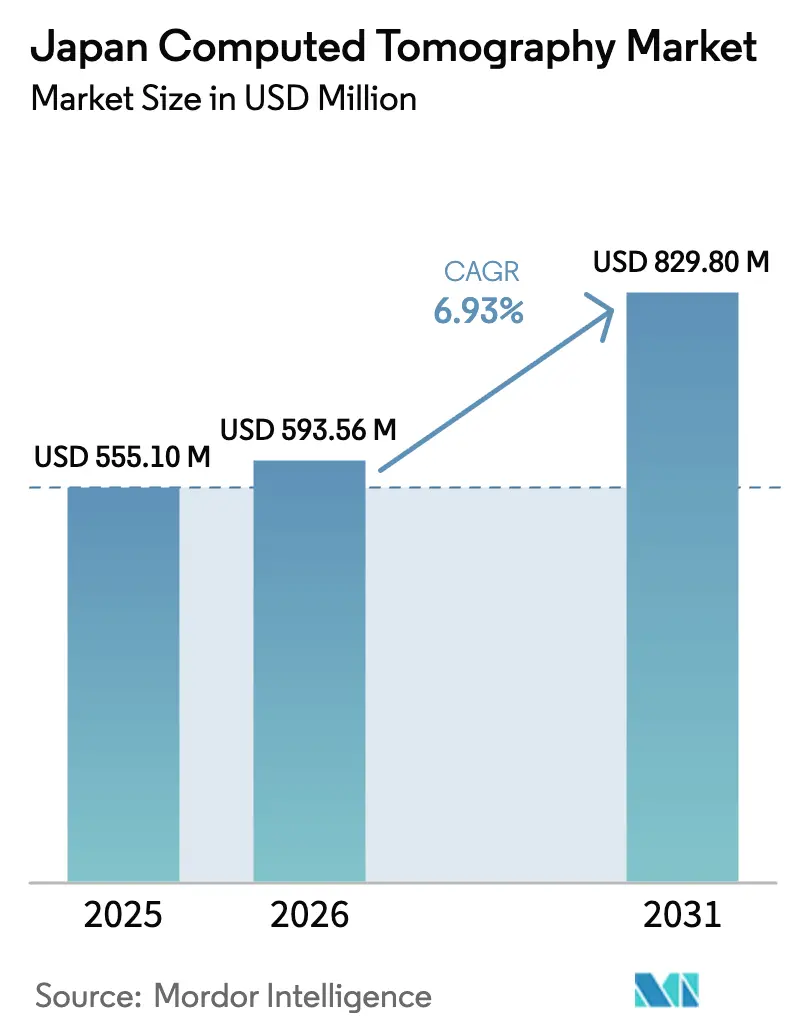
| Base Year Market Size (2025) | USD 555.1 Million |
| Market Size (2026) | USD 593.56 Million |
| Market Size (2031) | USD 829.8 Million |
| Growth Rate (2026 - 2031) | 6.93 % |
| Market Concentration | Medium |
Major Players
*Disclaimer: Major Players sorted in no particular order Image © Mordor Intelligence. Reuse requires attribution under CC BY 4.0. |
|
Japan Computed Tomography Market Analysis by Mordor Intelligence
The Japan computed tomography market size in 2026 is estimated at USD 593.56 million, growing from 2025 value of USD 555.1 million with 2031 projections showing USD 829.8 million, growing at 6.93% CAGR over 2026-2031. The expansion is fueled by the country’s super-aged demographic profile, steady oncology screening volumes, and the rollout of photon-counting systems that permit dose-efficient spectral imaging. Vendors capitalize on reimbursement incentives for AI-enabled low-dose protocols and on disaster-preparedness budgets that underwrite mobile fleets. The convergence of these factors shelters pricing power even as scan-fee revisions trend downward. Competitive dynamics remain moderate because four multinational manufacturers control most installed bases, yet white-space opportunities persist in portable architectures and AI retrofit kits that augment legacy scanners without full-system replacement.
Key Report Takeaways
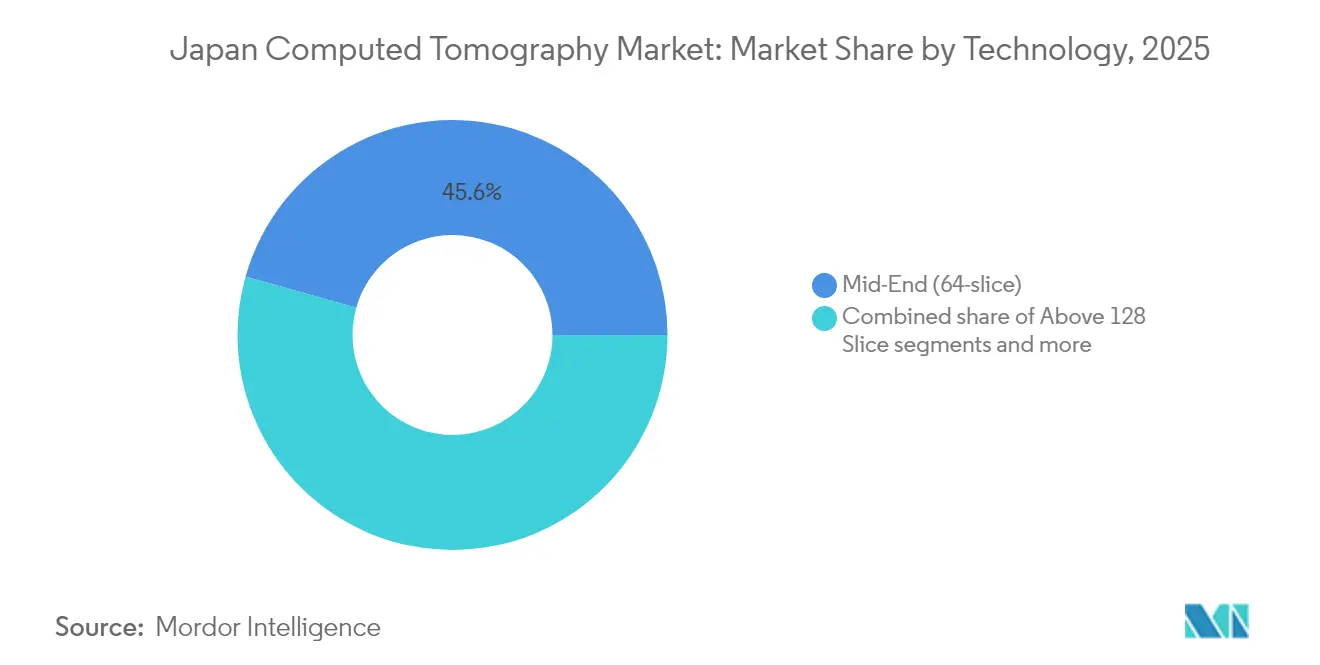
- By technology, Mid-End 64-slice systems accounted for 45.62% of the Japan computed tomography market share in 2025, while Above 128-slice platforms are projected to post a 6.12% CAGR through 2031.
- By product type, Stationary scanners commanded 91.05% revenue in 2025; Portable scanners are forecast to expand at a 6.72% CAGR to 2031.
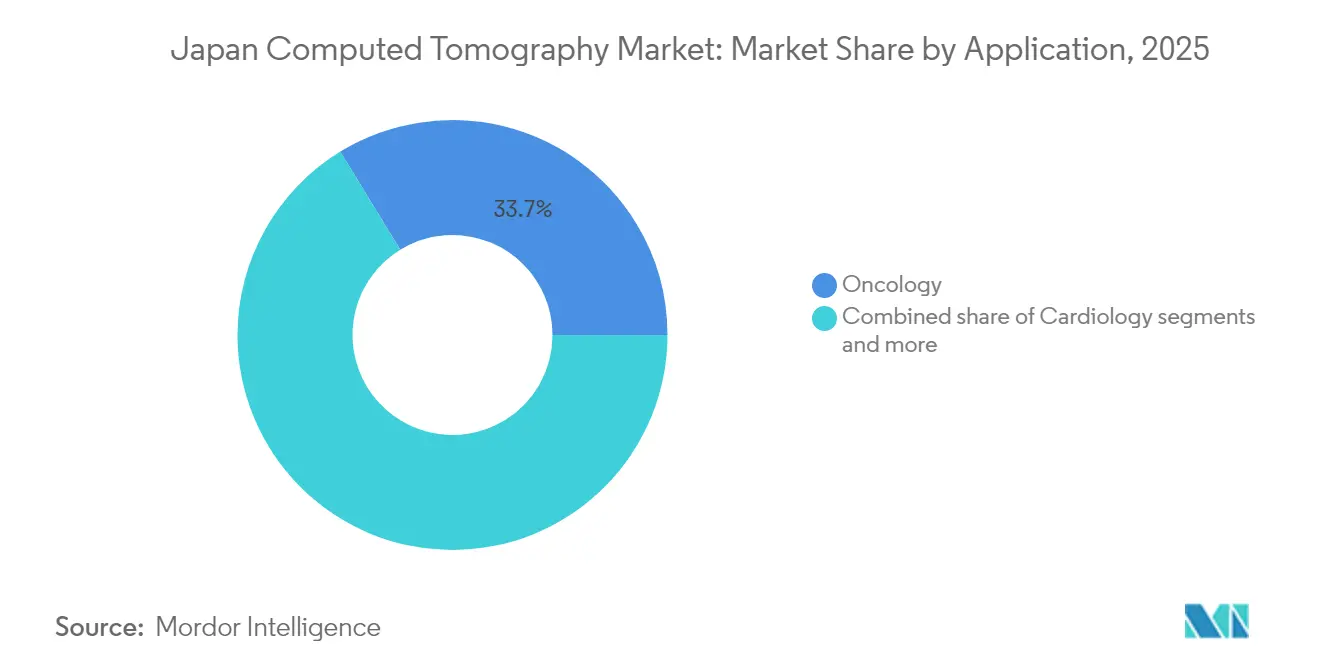
- By application, Oncology held 33.74% of the Japan computed tomography market size in 2025, and Cardiology is tracking the fastest CAGR at 6.53% through 2031.
- By end-user, Hospitals led with a 57.62% share in 2025, whereas Private Hospitals are slated to deliver a 6.15% CAGR through 2031
Note: Market size and forecast figures in this report are generated using Mordor Intelligence’s proprietary estimation framework, updated with the latest available data and insights as of 2026.
Japan Computed Tomography Market Trends and Insights
Drivers Impact Analysis*
| Driver | (~) % Impact on CAGR Forecast | Geographic Relevance | Impact Timeline |
|---|---|---|---|
| Rapid adoption of photon-counting CT in academic centers | +1.2% | Japan core, spillover to APAC | Medium term (2-4 years) |
| Ageing population-driven oncologic imaging demand | +2.1% | National, concentrated in metropolitan areas | Long term (≥ 4 years) |
| Disaster-preparedness funding for mobile CT fleets | +0.8% | Japan national, rural prefectures priority | Short term (≤ 2 years) |
| Reimbursement incentives for AI-enabled low-dose protocols | +1.5% | National, early adoption in university hospitals | Medium term (2-4 years) |
| Precision-oncology integration of CT radiomics | +0.9% | Japan core, academic medical centers | Long term (≥ 4 years) |
| OEM–AI start-up retro-fit collaborations lowering upgrade cost | +0.7% | Global, Japan early adopter market | Short term (≤ 2 years) |
| Source: Mordor Intelligence | |||
Rapid adoption of photon-counting CT in academic centers
Academic hospitals validate photon-counting CT by showcasing sub-0.2 mm isotropic resolution and intrinsic spectral outputs that elevate lung-nodule characterization and coronary-plaque analysis. Early adopters such as Osaka University leverage the Siemens NAEOTOM Alpha platform to publish peer-reviewed evidence supporting radiation-dose cuts of 30-40% while sustaining diagnostic confidence. Local R&D partnerships accelerate domestic prototypes using cadmium-zinc-telluride detectors that address national supply-chain resilience priorities. As clinical protocols mature, procurement committees in tertiary hospitals replicate these benchmarks, expanding addressable volumes across the Japan computed tomography market.
Ageing population-driven oncologic imaging demand
Cancer incidence peaks in the seventh and eighth decades, mirroring Japan’s demographic curve. National CT-based lung-cancer screening iterations are entrenched and collectively deliver several hundred-thousand annual examinations that anchor one-third of total scan volume. AI-reconstruction algorithms lower dose per scan, mitigating cumulative exposure anxieties among older patients. Health-economic models demonstrate system-wide savings when early detection defers late-stage chemotherapy costs, ensuring durable policy backing.
Disaster-preparedness funding for mobile CT fleets
Government relief appropriations mandate deployable imaging capacity following seismic events. The latest truck-mounted CT units integrate battery-buffered power and automated leveling, enabling on-site neuro assessments within 20 minutes of arrival. These specifications align with rural-prefecture resilience plans, underpinning the 6.94% CAGR registered by portable scanners.
Reimbursement incentives for AI-enabled low-dose protocols
Once PMDA clears an AI reconstruction algorithm, universal coverage guidelines tag a differentiated scan code that reimburses 3–5% above standard fees, offsetting upgrade costs for institutions adopting certified software. University hospitals spearhead rollout, creating reference centers that disseminate best-practice dose-optimization pathways nationwide.
Restraints Impact Analysis*
| Restraint | (~) % Impact on CAGR Forecast | Geographic Relevance | Impact Timeline |
|---|---|---|---|
| High capital outlay amid declining scan fees | -1.8% | National, affecting smaller hospitals disproportionately | Medium term (2-4 years) |
| Shortage of radiologic technologists in rural prefectures | -1.3% | Rural Japan, spillover to suburban areas | Long term (≥ 4 years) |
| Stricter national diagnostic reference levels on dose | -0.6% | National, uniform implementation | Short term (≤ 2 years) |
| Slow PMDA approvals for next-gen detector technologies | -0.9% | Japan specific, affecting global vendors | Medium term (2-4 years) |
| Source: Mordor Intelligence | |||
High capital outlay amid declining scan fees
List prices range from USD 300,000 for 16-slice models to beyond USD 5 million for photon-counting flagships, straining budgets when Social Insurance Medical Council updates have trimmed CT scan tariffs by 2% annually since 2024. Smaller community hospitals therefore favor leasing or pay-per-scan agreements, moderating total equipment revenue growth.
Shortage of radiologic technologists in rural prefectures
Vacancy rates for technologists stand at 18.1%, with the shortfall most acute outside metropolitan areas RSNA.ORG. Unfilled shifts limit scanner utilization below the economic breakeven of 12–15 studies per day, tempering procurement appetites despite clinical need.
*Our forecasts treat driver/restraint impacts as directional, not additive. The impact forecasts reflect baseline growth, mix effects, and variable interactions.
Segment Analysis
By Technology: Mid-Slice Platforms Anchor Clinical Volume
Mid-End 64-slice scanners retained 45.62% of 2025 revenue because they satisfy bread-and-butter oncology and trauma protocols at manageable ownership costs. The Japan computed tomography market size for this tier is projected to expand at 5.05% through 2031 as iterative reconstruction keeps them dose-competitive. High-slice (>128) installations, while only 18% of unit shipments in 2024, capture the prestige segment and are forecast to add USD 97 million by 2031, reflecting a 6.12% CAGR tied to photon-counting launches. Vendor roadmaps indicate detector-module backward-compatibility that lets facilities upgrade piecemeal, elongating replacement cycles yet boosting software revenue streams.
Clinical consensus increasingly favors spectral capabilities, nudging even mid-slice buyers to consider dual-energy add-ons. Canon’s 1024-matrix reconstruction upgrade delivered 0.4 mm airway visualization on existing 320-row Aquilion installations, blurring performance gaps with high-slice peers. Consequently, manufacturers package AI-based metal-artifact reduction and calcium-scoring automation as subscription layers, reinforcing multi-year annuity models across the Japan computed tomography market.

By Product Type: Stationary Dominance, Portable Momentum
Stationary scanners accounted for 91.05% of units in 2025, underscoring entrenched hospital work-flows and lead-lining requirements. Their throughput advantage bolsters ROI in facilities exceeding 40 patients per day, explaining continued procurement despite space constraints. Portable scanners, though a modest 8.95% slice, are advancing at a 6.72% CAGR on the back of disaster-resilience legislation that subsidizes two mobile units per prefecture. Field hospitals also deploy compact 32-row variants for neuro triage, dovetailing with population-aging policies that emphasize home-and-community care.
Technological cross-pollination lifts both segments. Photon-counting detector miniaturization allows vendors to ship battery-powered units without compromising spectral resolution, broadening clinical eligibility beyond head CT into thoracic and vascular indications. The shift accelerates revenue diversification across the Japan computed tomography market.
By Application: Oncology Leads, Cardiology Accelerates
Oncology generated 33.74% of 2025 revenue after lung-cancer screening volumes rebounded to pre-pandemic levels. Program expansion in Kanagawa and Hokkaido prefectures will amplify scan counts by an estimated 11% over 2025-2027. Cardiology remains the fastest-gaining application, logging a 6.53% CAGR as expanded coronary CT angiography guidelines recommend non-invasive imaging before catheterization in intermediate-risk cohorts. The Japan computed tomography market size for cardiac exams is forecast to reach USD 166.1 million in 2031, up from USD 113.8 million in 2025.
Neurology scans hold steady due to stroke-code adherence, while vascular and musculoskeletal niches see incremental lift from dose-efficient spectral scans that cut contrast volumes by 25%. AI triage software that flags pulmonary embolism and intracranial bleeds keeps radiologist workloads manageable, sustaining demand even amid staffing shortages.
By End-User: Hospital Backbone, Private-Sector Upshift
Hospitals controlled 57.62% of 2025 spending, reflecting their gatekeeper role in universal coverage. Public institutions focus on mid-slice replacements, whereas private hospitals pursue differentiation via photon-counting systems and AI co-pilots, supporting a 6.15% CAGR. Diagnostic imaging centers are expanding in suburbs where aging populations prefer outpatient convenience, translating to tailored service contracts that bundle scanner, PACS, and cloud analytics.
Academic institutes, though <5% of unit volume, punch above their weight in innovation adoption, serving as reference sites that catalyze nationwide rollouts. Veterinary and dental clinics remain niche but profitable add-ons, often buying compact cone-beam units assembled locally.
Geography Analysis
Metropolitan prefectures, Tokyo, Osaka, and Aichi, house 52% of scanners, driven by population density, tertiary centers, and stronger capital budgets. Urban facilities cycle equipment every 6-7 years, sustaining high-slice demand. In contrast, rural prefectures own aging fleets approaching a 10-year median age, prompting government grants for mobile units and AI retrofits rather than outright replacements.
Seismic risk shapes procurement in the Pacific coastal belt, where hospitals embed CT suites with earthquake-resistant mounts and maintain trailer-based backups parked off-site. Post-disaster deployment drills executed in 2024 demonstrated full diagnostic uptime within 48 hours of simulated infrastructure failure, validating policy investments.
Universal coverage guarantees identical scan-fee schedules nationwide, yet income disparities influence out-of-pocket extras such as expedited reporting. Tele-radiology networks connect Hokkaido’s rural clinics to Tokyo reading hubs, compressing turnaround from 48 hours to 6 hours and justifying new scanner acquisitions where local staffing is thin
Regulatory Landscape
Computed tomography (CT) systems in Japan are regulated under the Pharmaceuticals and Medical Devices (PMD) Act, with oversight shared between the Ministry of Health, Labour and Welfare (MHLW) and the Pharmaceuticals and Medical Devices Agency (PMDA). CT scanners are treated as Class II controlled medical devices and must meet Japanese technical standards aligned with IEC and relevant JIS frameworks, which affects both new system approvals and change notifications for detector upgrades, software revisions, and dose-management features.
From April 1, 2026, the PMDA requires eCTD v4.0 for new medical device applications, which increases the value of structured data submission when sponsors update iterative AI reconstruction and spectral imaging capabilities after launch.
Value Chain Analysis
The Japan CT value chain starts with component and subsystem suppliers such as X-ray tubes, detectors, generators, and gantries, then moves through OEM manufacturing and software integration, and finally into distribution, installation, and lifecycle services such as preventive maintenance, tube replacement, and software upgrades. OEMs increasingly monetize post-install value through software options and service contracts that bundle dose optimization, spectral post-processing, and fleet management, which matters for hospitals managing high capital outlay alongside tighter scan economics.
On the demand side, purchasing decisions reflect institutional buying structures and reimbursement-linked utilization. The National Hospital Organization (NHO) uses centralized joint public tendering for imaging equipment, concentrating purchasing power and standardizing specifications for multi-slice CT across facilities. Payment mechanics under Japan’s National Health Insurance (NHI), including DPC-based hospital financing and device-associated reimbursement rules, shape purchase versus leasing or pay-per-scan models, and influence upgrade pull-through for differentiated reimbursement such as certified AI-enabled low-dose protocols.
Competitive Landscape
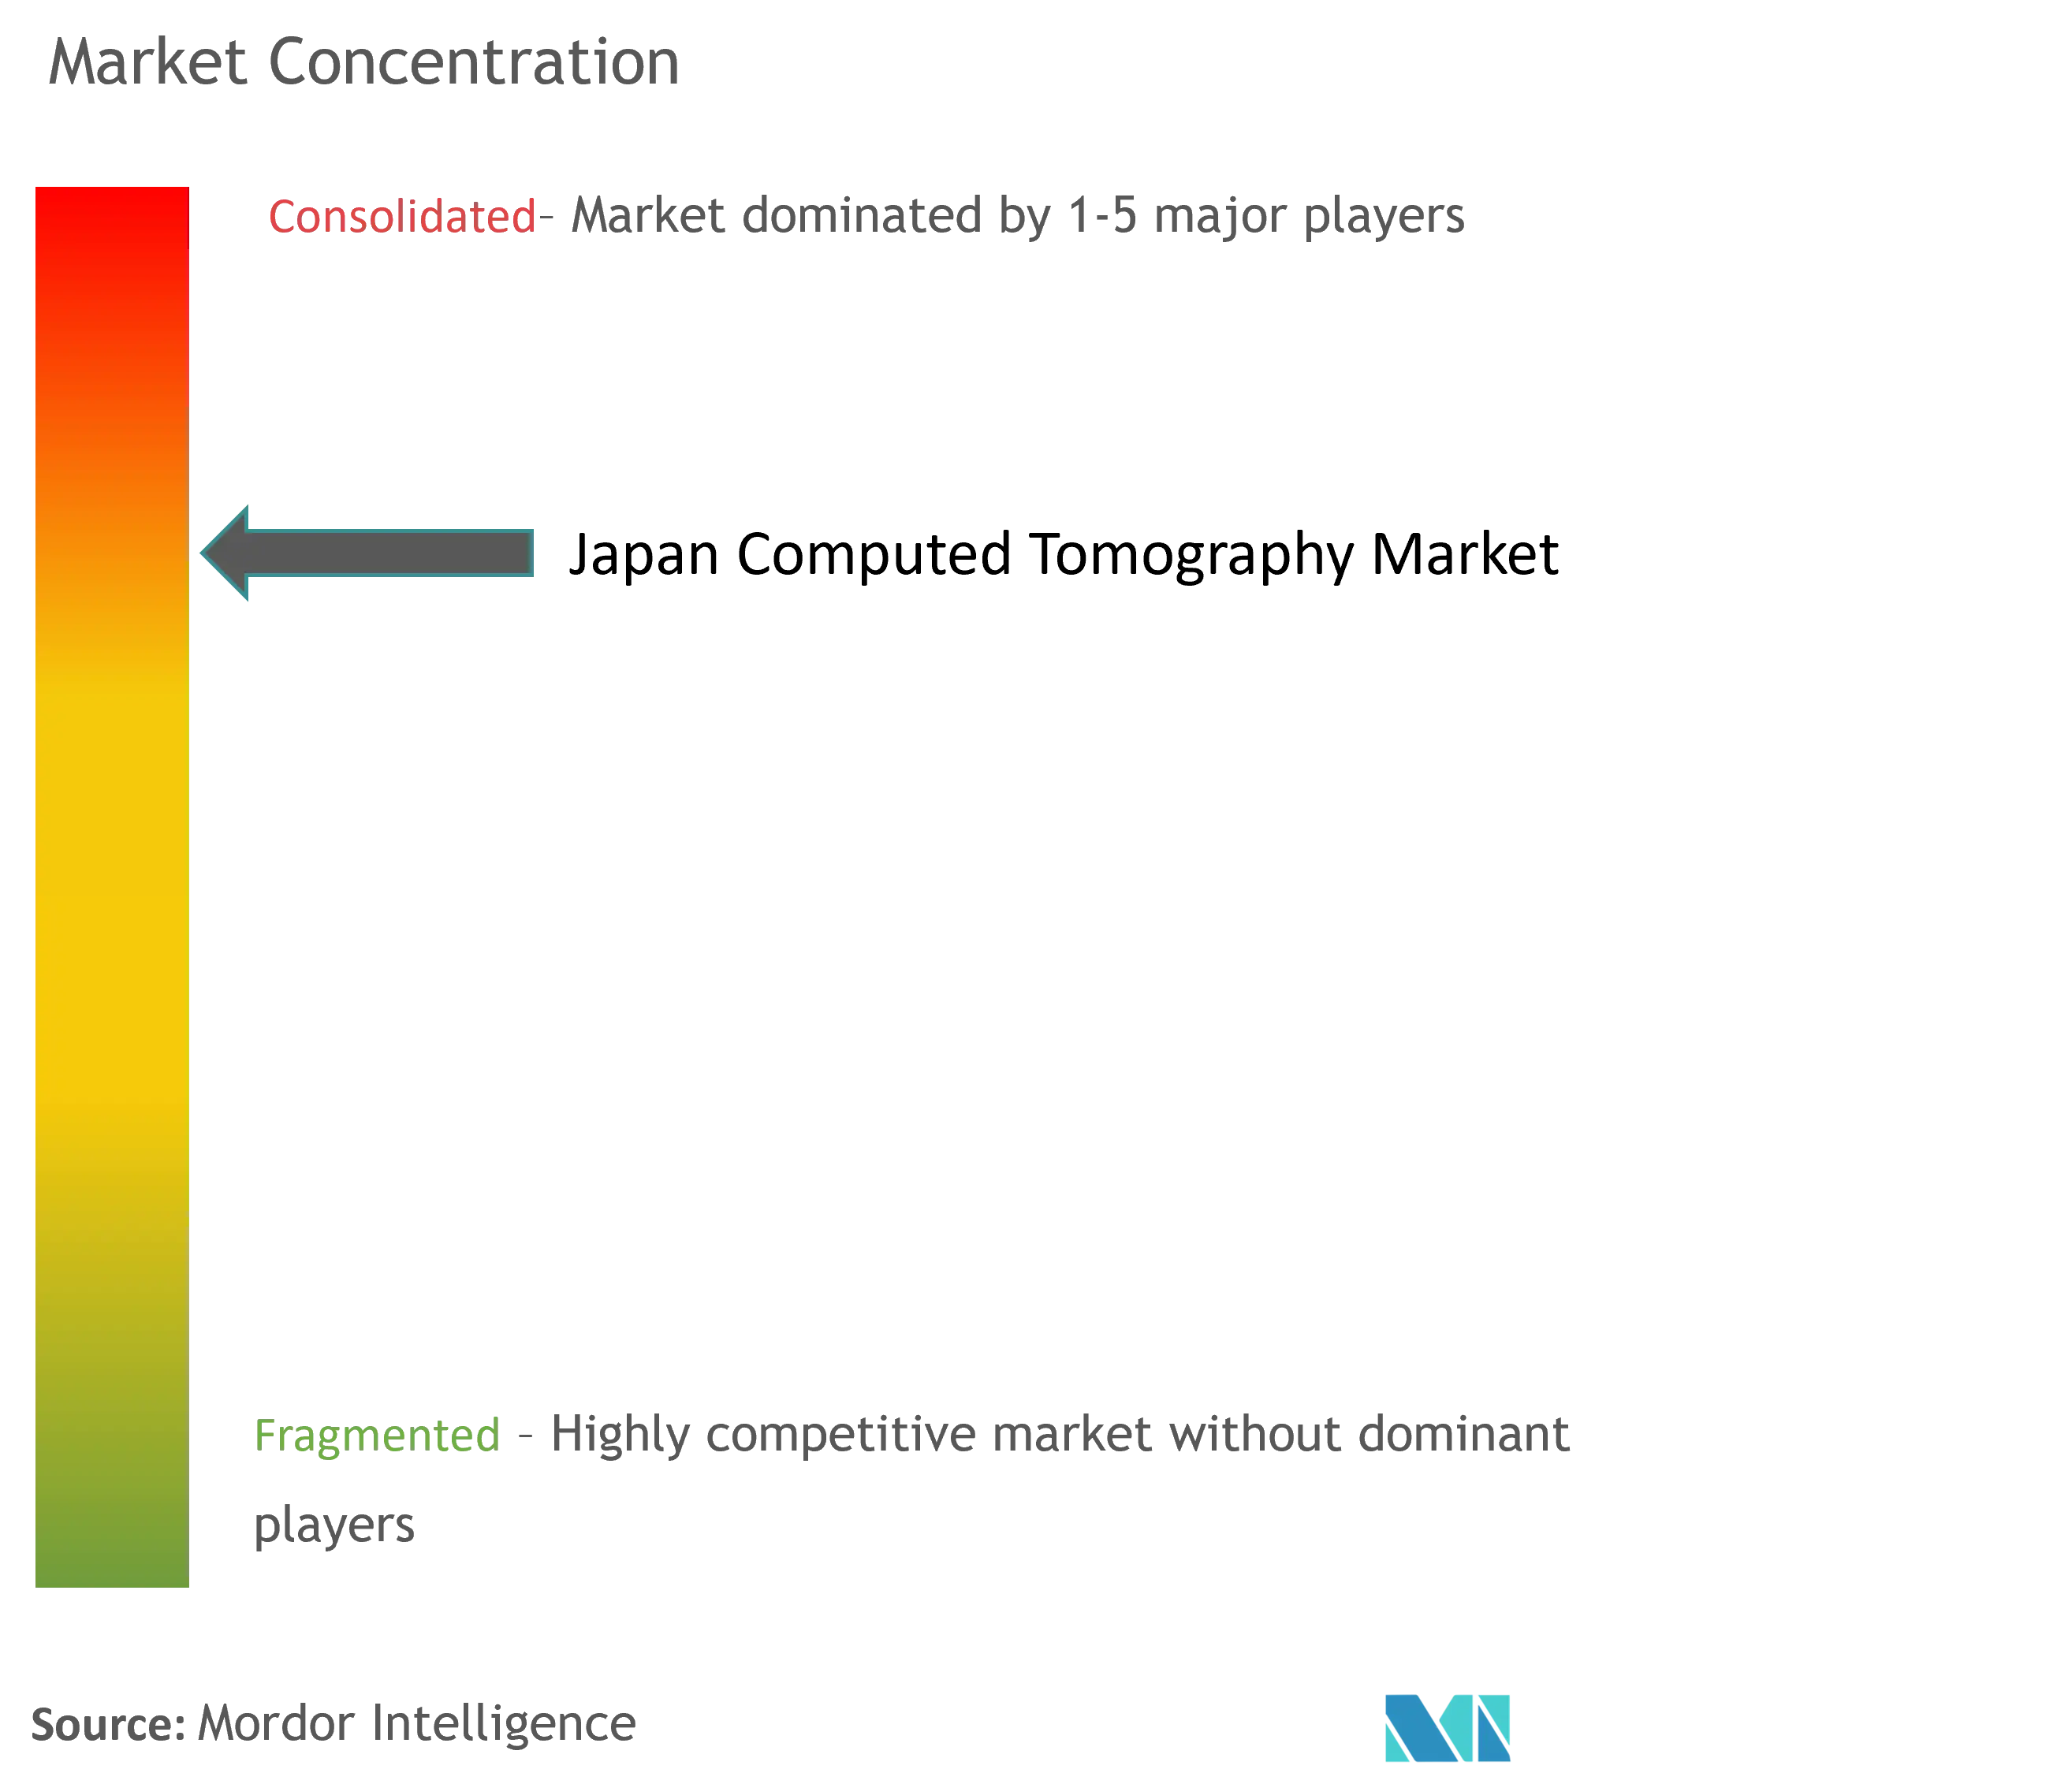
Four multinationals—Siemens Healthineers, GE HealthCare, Canon Medical Systems, and Philips—command significant 2024 revenue, indicating moderate concentration. Siemens leads in photon-counting patents, GE leverages radiopharmaceutical integration after buying Nihon Medi-Physics for USD 183 million, Canon benefits from domestic supply-chain goodwill, and Philips differentiates with iterative AI recon software.
Strategic cooperation is intensifying. Siemens and Sectra integrated spectral post-processing into mainstream PACS, eliminating workstation silos and speeding physician adoption. Canon and Olympus co-develop ultrasound-CT fusion imaging, signaling convergence plays that broaden modality ecosystems.
Start-ups focus on AI triage and radiation-dose tracking, often signing non-exclusive distribution deals with incumbents. The resulting value-chain interlock fosters service bundling—hardware, software, and isotope supply—creating sticky relationships that raise switching costs across the Japan computed tomography market.
Japan Computed Tomography Industry Leaders
-
GE Healthcare
-
Koninklijke Philips N.V.
-
Canon Medical Systems
-
Siemens Healthineers
-
Fujifilm Holdings Corporation
- *Disclaimer: Major Players sorted in no particular order
Market Opportunities and Future Outlook
Regulatory and corporate actions are creating openings for faster market access and more integrated offerings. In May 2026, the MHLW expanded the conditional approval pathway for medical devices addressing unmet medical needs, which supports earlier access for next-generation detector and AI-driven reconstruction capabilities that are intended to raise diagnostic confidence.
Canon Medical completed its integration with Canon Inc. in January 2026 and was designated as Canon Medical Business 3.0, tightening its cost structure and R&D efficiency for bundled hardware, analytics, and service platforms. Fujifilm Holdings' acquisition of T.G. Medical broadens neurovascular and treatment-focused device portfolios, and the report frames expansion in Southeast Asia, India, and the Middle East as a way to offset domestic constraints.
Recent Industry Developments
- April 2026: Canon Medical Systems (Canon Inc.) launched Ultimion, Japan’s first domestically produced photon-counting CT system. The direct market launch in Japan highlights Canon's domestic manufacturing capability and advances clinical validation partnerships with NCC facilities. This expands Canon's footprint in PCCT within Japan.
- April 2026: GE Healthcare Japan launched Photonova Spectra, photon-counting CT system with deep silicon detector. The direct market entry in Japan for PCCT adds competitive pressure in the segment and supports supply-chain integration and AI-enabled dose optimization in hospitals.
- December 2025: Siemens Healthineers Japan achieved the first installation of NAEOTOM Alpha.Prime single-source PCCT at Yodogawa Christian Hospital. The deployment points to early adoption momentum and increases competitive pressure on Canon and GE while validating market readiness for PCCT protocols.
Research Methodology Framework and Report Scope
Market Definition and Coverage
For this report, the Japan computed tomography (CT) market is defined as the revenue generated from CT systems sold and installed in Japan across healthcare settings, including new installations and replacement demand that comes from ongoing technology upgrades.
Scope exclusions: We exclude imaging service revenue, refurbished or gray-market equipment, and most non-CT imaging modalities even when they are purchased under a bundled hospital procurement plan.
Segmentation Overview
-
By Technology (Slice Count)
- Low-slice (<64)
- Mid-slice (64)
- High-slice (128–256)
-
By Product Type
- Stationary CT Scanners
- Portable / Mobile CT Scanners
-
By Application
-
Oncology
- Lung Cancer Screening
- Head & Neck Oncology
- Colorectal Oncology
- Other Oncology
-
Cardiology
- Coronary CT Angiography
- Calcium Scoring
- Structural Heart Disease
-
Neurology
- Stroke Assessment
- Brain Trauma
-
Vascular
- Peripheral Vascular Disease
- Pulmonary Angiography
-
Musculoskeletal
- Orthopedic Trauma
- Sports Injuries
- Dental & Maxillofacial
- Trauma & Emergency
- Other Applications
-
Oncology
-
By End-User
-
Hospitals
- Public Hospitals
- Private Hospitals
- Diagnostic Imaging Centers
- Dental Clinics
- Veterinary Clinics & Hospitals
- Academic & Research Institutes
-
Hospitals
Data Sources, Market Sizing, and Validation
Desk Research
Desk research was used to build the initial view on CT demand drivers and the care-setting context before any modeling assumptions were finalized. We reviewed public sources such as Japan Ministry of Health, Labour and Welfare releases, OECD health statistics, World Bank demographic indicators, and peer-reviewed radiology journals that discuss CT utilization and dose trends in clinical practice.
To keep the view aligned with real buying behavior, we also checked company annual reports and investor presentations, press coverage from medical publications, and public tenders and procurement notices where they were available. In addition, paid subscriptions for company financials and intelligence, patent databases, and global contracts and tenders were used selectively to confirm product cycles and contract timing. These desk sources are illustrative rather than exhaustive, and other public references were used to fill data gaps, validate assumptions, and clarify slice mix and adoption context during research.
Primary Interviews and Surveys
Primary work focused on testing real-world purchasing and replacement cycles, the typical configuration choices across buyers, and the practical split between hospitals and diagnostic centers. We spoke with a mix of equipment buyers, radiology department stakeholders, and service-side experts across Japan, so assumptions on average selling prices, slice mix, and adoption timing were stress-tested before finalizing outputs.
Distribution of primary research fieldwork respondents
| Company type | Respondent position |
|---|---|
| Top tier: 35% | CXOs: 17% |
| Mid tier: 43% | Functional/Unit leaders: 23% |
| Smaller Players: 22% | Managers: 60% |
Market-Sizing & Forecasting
Sizing starts with a top-down rebuild of Japan CT system demand by linking the installed base and replacement cadence to expected yearly unit shipments. We then convert those shipments to value using price bands that reflect slice class and typical configurations.
To keep the estimate anchored, we corroborate totals through targeted bottom-up checks, including sampled price points from procurement discussions, channel checks on replacement timing, and sanity checks against supplier revenue exposure to Japan.
Key inputs for this market include the hospital and diagnostic center upgrade cycle, the shift in mix across low-slice, mid-slice, and high-slice systems, and how average selling price changes as advanced features become more common. We also use utilization-related signals, such as aging-population pressure on imaging volumes, screening intensity in oncology and cardiovascular workups, and the pace at which low-dose and spectral capabilities move from premium sites into routine installations. Where slice-class data is not available consistently, we fill gaps using conservative ranges agreed with interview feedback, then re-check that the implied unit volumes remain plausible.
Forecasting is done through scenario analysis supported by expert consensus on replacement timing, procurement budget expectations, and adoption speed for newer system types. We then translate scenarios into a single base case after checking that the implied price and mix path matches what buyers say they plan to pay in the next upgrade cycle.
Data Validation & Update Cycle
Validation is handled through repeated cross-checks across model outputs, interview feedback, and independent signals such as procurement patterns and published health system indicators. If a result appears inconsistent, we revisit the assumptions behind unit demand, slice mix, and price bands, and we re-contact relevant experts when the variance remains material.
Before sign-off, the work is reviewed in multiple steps so the calculation logic, conversions, and year-on-year movements are coherent and traceable. Reports are refreshed annually, and interim updates are included when meaningful events occur that can affect pricing, technology adoption, or hospital purchasing plans. Right before delivery, a final refresh pass is done so clients get the most current view available at that time.
Mordor Intelligence's Japan Computed Tomography Ct Market Size Compared Against Other Published Estimates
Published market numbers for Japan CT can differ because each publisher uses a different product scope, and then applies its own price logic and replacement assumptions. We also see differences tied to currency timing, base year selection, and the assumed pace at which older systems are phased out versus upgraded.
Some external estimates bundle CT with broader diagnostic imaging equipment, and some also include service and maintenance revenue. In the Mordor Intelligence model, value is limited to CT system revenue in Japan, and the estimate is built around slice-level mix and realistic ASP bands that are validated through buyer and clinician inputs.
Benchmark comparison
| Source | Market Size | Gaps in Research Methodology |
|---|---|---|
| Mordor Intelligence | USD 555.10 M (2025) | |
| Global Consultancy A | USD 0.72 B (2025) | Often reported as part of a wider diagnostic imaging equipment total, which can pull in adjacent modalities and blended pricing, and it may apply a higher premium mix for advanced CT configurations than typical purchasing patterns support. |
| Industry Association B | USD 0.49 B (2025) | Commonly derived from narrower shipment snapshots that can undercount replacements routed through large group purchasing cycles, and it may lag recent ASP changes because updates are less frequent and exchange-rate assumptions are not always aligned to the base year. |
Reading the table together, the spread is mainly explained by whether adjacent imaging categories are included and by how price and slice mix are treated in the base year. Our approach stays repeatable since the steps are tied to installed base dynamics, replacement timing, and transparent price bands that can be re-checked as new procurement signals emerge.
Key Questions Answered in the Report
How big is the Japan Computed Tomography Market?
The Japan Computed Tomography Market size is expected to reach USD 593.56 million in 2026 and grow at a CAGR of 6.93% to reach USD 829.8 million by 2031.
What is the current Japan Computed Tomography Market size?
In 2026, the Japan Computed Tomography Market size is expected to reach USD 593.56 million.
Who are the key players in Japan Computed Tomography Market?
GE Healthcare, Koninklijke Philips N.V., Canon Medical Systems, Siemens Healthineers and Fujifilm Holdings Corporation are the major companies operating in the Japan Computed Tomography Market.
What years does this Japan Computed Tomography Market cover, and what was the market size in 2025?
In 2025, the Japan Computed Tomography Market size was estimated at USD 555.1 million. The report covers the Japan Computed Tomography Market historical market size for years: 2019, 2020, 2021, 2022, 2023, 2024 and 2025. The report also forecasts the Japan Computed Tomography Market size for years: 2026, 2027, 2028, 2029, 2030 and 2031.