
Market Overview
| Study Period | 2020 - 2031 |
|---|---|
| Forecast Data Period | 2026 - 2031 |
| Base Year Market Size (2025) | USD 107.06 Billion |
| Market Size (2026) | USD 109.97 Billion |
| Market Size (2031) | USD 125.76 Billion |
| Growth Rate (2026 - 2031) | 2.72 % |
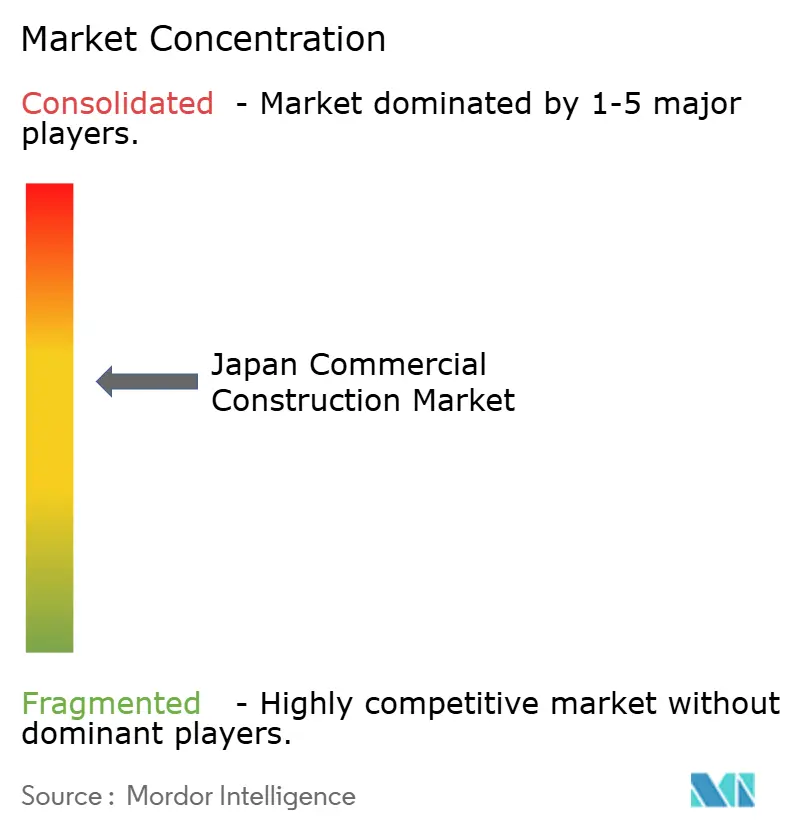
| Market Concentration | Medium |
Major Players *Disclaimer: Major Players sorted in no particular order Image © Mordor Intelligence. Reuse requires attribution under CC BY 4.0. | |
Japan Commercial Construction Market Analysis by Mordor Intelligence
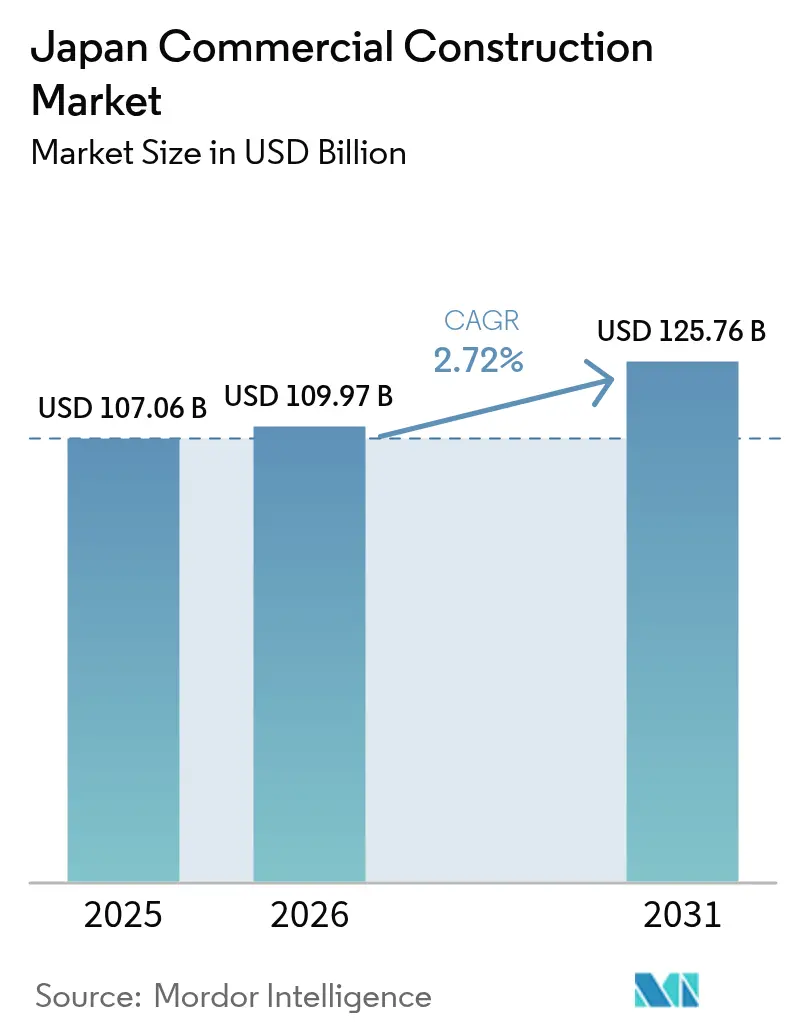
The Japan commercial construction market size was valued at USD 107.06 billion in 2025 and estimated to grow from USD 109.97 billion in 2026 to reach USD 125.76 billion by 2031, at a CAGR of 2.72% during the forecast period (2026-2031). This measured trajectory indicates a shift from post-pandemic rebound to steady structural growth anchored in demographic change, urban renewal, and digital-economy investment. Corporations now place higher value on seismic resilience, energy efficiency, and integrated technology than on gross floor-area expansion, giving renovation projects a new economic rationale. Urban redevelopment programs—most visibly the 15-year Shibuya transformation—add multi-phase work that sustains demand far beyond a single business cycle. Private capital still funds most projects, yet the rising government share shows that public-sector infrastructure is returning as a long-term growth engine. Labor scarcity, material inflation, and tight land supply remain cost headwinds; however, digitized construction methods, modular components, and off-site fabrication are starting to offset part of the pressure.
Key Report Takeaways
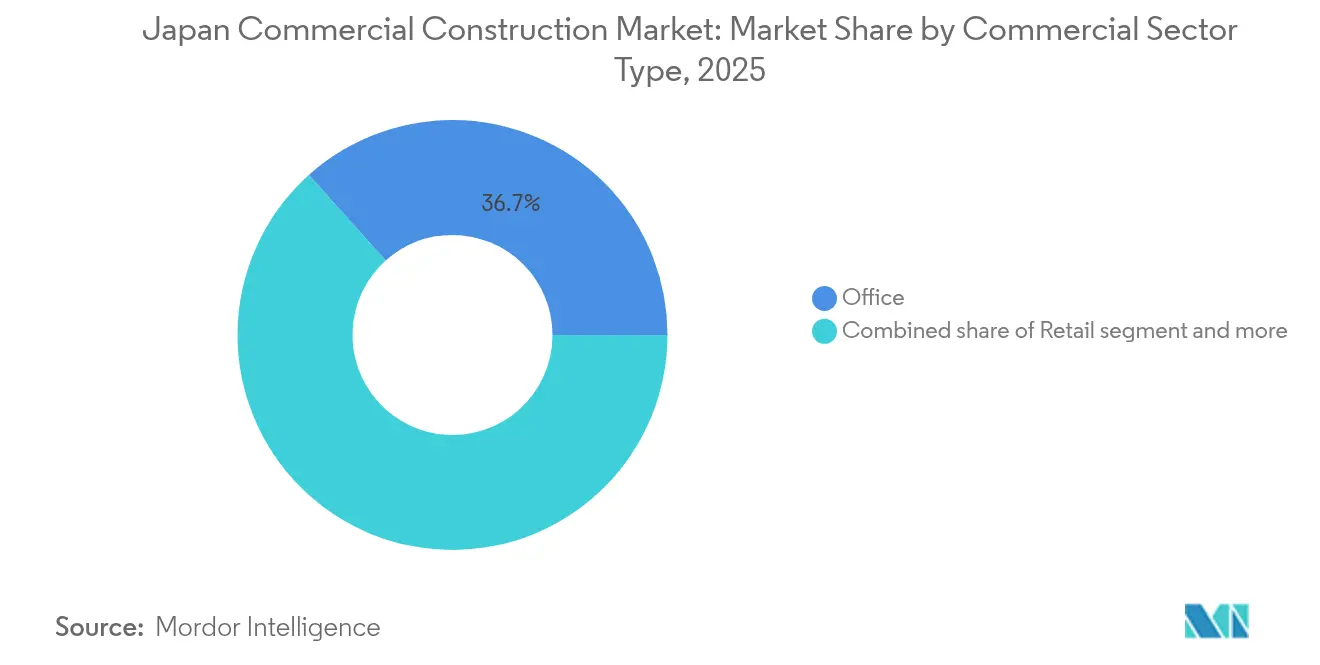
- By commercial sector type, Office led with 36.65% of the Japan commercial construction market revenue share in 2025. The Japan commercial construction market for Industrial & Logistics is on track for the fastest 3.08% CAGR between 2026-2031.
- By construction type, New Construction held 71.85% of the Japan commercial construction market share in 2025. The Japan commercial construction market for Renovation is projected to grow at a 3.2% CAGR between 2026-2031.
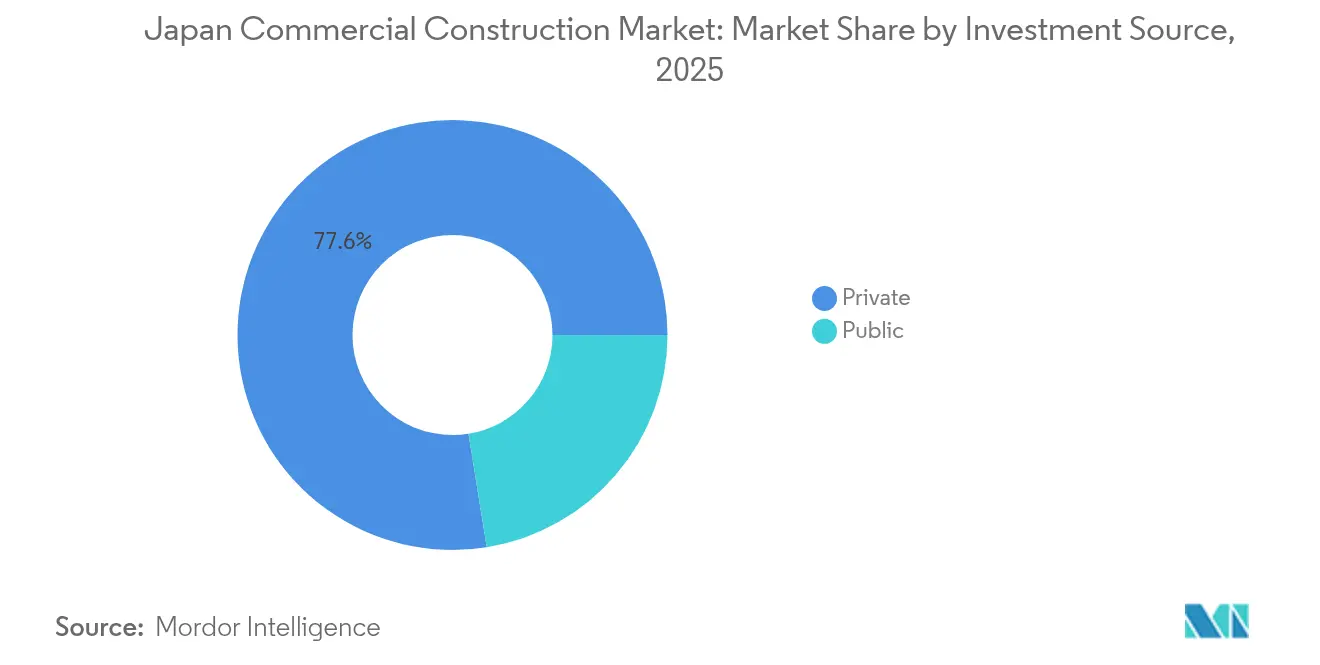
- By investment source, the Private segment controlled 77.55% of the Japan commercial construction market share in 2025. The Japan commercial construction market for public investment shows the highest 3.36% CAGR between 2026-2031.
- By region, Tokyo accounted for 39.25% of the Japan commercial construction market share in 2025. The Japan commercial construction market for Osaka is positioned for a 3.75% CAGR between 2026-2031.
Note: Market size and forecast figures in this report are generated using Mordor Intelligence’s proprietary estimation framework, updated with the latest available data and insights as of 2026.
Japan Commercial Construction Market Trends and Insights
Drivers Impact Analysis*
| Driver | (~) % Impact on CAGR Forecast | Geographic Relevance | Impact Timeline |
|---|---|---|---|
| Urban redevelopment initiatives | +0.8% | Tokyo, Osaka, Nagoya | Long term (≥ 4 years) |
| Rising demand for seismic-resilient buildings | +0.6% | Nationwide high-risk zones | Medium term (2-4 years) |
| Corporate focus on energy efficiency | +0.5% | Nationwide, early in metro cores | Medium term (2-4 years) |
| Tourism recovery and hospitality investments | +0.4% | Tokyo, Osaka, Kyoto, key hubs | Short term (≤ 2 years) |
| Digital-economy expansion | +0.7% | Major metros with regional spillover | Long term (≥ 4 years) |
| Public-private investment in transit hubs | +0.3% | Metros & Expo 2025 corridors | Medium term (2-4 years) |
| Source: Mordor Intelligence | |||
Urban Redevelopment Initiatives Drive Metropolitan Transformation
Mass-scale redevelopment now defines the Japan commercial construction market. Shibuya’s 15-year program layers pedestrian decks above rail lines and embeds multi-use towers, elevating land productivity and pedestrian safety. Mitsui Fudosan’s 190,000 m² Tsukiji project adds net-zero carbon targets to urban renewal, setting stricter baselines for future approvals. Regional centers copy this template: Sumitomo Corporation’s Emi Terrace Tokorozawa integrates retail, offices, and housing around upgraded rail access. Developers, therefore, need end-to-end capabilities—land readjustment, brownfield remediation, phasing logistics, and community coordination—to stay competitive. Because many sites lie above or adjacent to active rail corridors, contractors also require advanced vibration-control engineering.
Seismic Resilience Requirements Accelerate Building Reconstruction
Japan’s evolving Building Standard Act now compels older facilities to meet higher lateral-load targets, fueling a sustained reconstruction pipeline[1]Takashi Saito, “Amendments to the Building Standard Act 2025,” MLIT, mlit.go.jp. Innovations such as earthquake-resistant coatings for masonry walls cut retrofit costs enough to displace full demolition in many mid-rise assets. Performance-based designs employing steel-plate shear walls and engineered cementitious composites can raise lateral capacity by over 50% while minimizing tenant downtime. Corporate insurers link premium discounts to these engineering upgrades, so risk managers often green-light bundled seismic-plus-energy retrofits that improve business-continuity scores. The combined technical and financial benefits explain why renovation CAGR outpaces new-build growth despite the overall market dominance of greenfield projects.
Corporate Energy-Efficiency Focus Drives Green Building Demand
Path-to-2050 carbon neutrality targets make energy performance a statutory obligation rather than a branding tool. From 2025, all non-residential buildings above 300 m² must pass Building Energy Efficiency Act benchmarks; Tokyo adds compulsory solar on certain rooftops in the same year. Solutions such as SCSK’s ZEBiT platform automate operational data collection for 450 targeted building upgrades, proving ROI through verifiable CO₂ cuts[2]Yuko Matsui, “Mandatory Solar Installation Rules for Large Buildings,” TMG, metro.tokyo.lg.jp. Financing structures are evolving: Development Bank of Japan’s “Zenobe” quantifies emissions savings for loan underwriting, letting owners swap higher capex for lower cost of capital. As certification shifts from voluntary to required, demand for designers, MEP consultants, and contractors with proven green-retrofit records intensifies.
Tourism Recovery Catalyzes Hospitality Construction Investment
Inbound arrivals returned to 2019 levels by early 2023, and hotel transaction volume hit JPY 500 billion (USD 3.44 billion), 46% from overseas investors. The government aims for 60 million foreign visitors by 2030, implying a fresh supply across hotel classes and supporting assets such as staff dormitories and co-living spaces. ADRs climbed 35% to JPY 18,403 (USD 126.94), justifying luxury-segment projects that carry higher unit construction costs yet promise faster payback. Labor gaps in hospitality operations push developers to include on-site accommodation for imported staff, further enlarging project scope. Secondary cities see new-build potential where existing supply lags demand; short-term-rental growth among digital nomads accelerates serviced-apartment formats previously niche.
Restraints Impact Analysis*
| Restraint | (~) % Impact on CAGR Forecast | Geographic Relevance | Impact Timeline |
|---|---|---|---|
| Labor shortages in skilled trades | -0.9% | Nationwide, acute in metros | Long term (≥ 4 years) |
| Limited availability of large urban plots | -0.4% | Tokyo, Osaka CBDs | Long term (≥ 4 years) |
| High material and logistics costs | -0.5% | Nationwide | Medium term (2-4 years) |
| Slow permitting and regulatory procedures | -0.3% | Nationwide | Short term (≤ 2 years) |
| Source: Mordor Intelligence | |||
Labor Shortages Force Industry Automation Acceleration
The construction workforce has fallen from 6.85 million in 1997 to 4.79 million in 2022, and 36% of workers are at least 55 years old, risking a further 20% contraction by 2040. Kajima’s A4CSEL autonomous bulldozer fleet at Naruse Dam proves that unmanned equipment can operate round-the-clock and cut crew counts by half[3]Koji Sakai, “A4CSEL Autonomous Equipment Field Results,” Kajima Newsroom, kajima.co.jp. Overtime limits enforced since 2024, already delayed Expo 2025 sites, prompting union-negotiated exemptions. Capital outlays of JPY 15 million (USD 0.10 million) for a driverless forklift now look acceptable compared with unfilled head-count penalties. Ministry-backed “i-Construction” subsidies de-risk adoption, while Komatsu’s smart-grader line enables semi-skilled operators to meet tolerance specs formerly handled by experienced foremen.
Limited Urban Plot Availability Constrains Development Scale
Scarce contiguous land in central Tokyo and Osaka pushes developers toward complicated land-readjustment or air-rights swaps, extending lead times beyond regular project finance windows. The 37-story Shinjuku Station super-tower stalled indefinitely after contractors withdrew amid surging steel prices and limited manpower. Japan’s urban-planning law still mandates consensus among local stakeholders, making parcel assembly a multi-year negotiation. Small developers lack the resources to manage these processes, so megaprojects fall into the hands of vertically integrated conglomerates. Premium land pricing also drives FAR maximization, resulting in taller, more complex structures that require higher engineering rigor and thus longer design phases.
*Our forecasts treat driver/restraint impacts as directional, not additive. The impact forecasts reflect baseline growth, mix effects, and variable interactions.
Segment Analysis
By Commercial Sector Type: Industrial & Logistics Outpaces Office Dominance
Industrial & Logistics is forecast to register a 3.08% CAGR between 2026-2031, propelled by automated supply-chain facilities and hyperscale data centers. Capital intensity is rising, as shown by Oracle’s decade-long USD 8 billion plan and a 69% spike in specialized build costs. Meanwhile, the office segment retains the largest absolute contribution, absorbing 36.65% of 2025 spending but advancing modestly as corporate tenants shrink footprints in favor of flexible, tech-ready floorplates. CapitaLand’s USD 700 million Osaka data center illustrates the pivot toward digital infrastructure projects bundling power resilience, advanced cooling, and carrier-neutral fiber. Retail projects blend omnichannel fulfilment areas with experiential zones, responding to post-pandemic consumer behavior. Mixed-use developments such as Shibuya Scramble Square show how integrated programming captures synergies and de-risks revenue streams across cycles.
Despite being capital-heavy, Industrial & Logistics assets reach break-even sooner because they anchor mission-critical platforms, often secured by multi-year pre-leasing to hyperscale tenants. Demand for last-mile hubs around Tokyo Bay and Osaka Bay is strong enough that speculative builds achieve near-full occupancy at handover. Office builders pivot by embedding reconfigurable floor grids, plug-and-play IT trunks, and wellness amenities to retain tenants. Consequently, the Japan commercial construction market keeps a dual growth path: stable but evolving office redevelopment and faster industrial-tech expansions.


By Construction Type: Renovation Gains Momentum Within New-Build Majority
New Construction represented 71.85% of the Japan commercial construction market size in 2025, reflecting ongoing metro redevelopment and green-field logistics parks. Yet, Renovation is generating a faster 3.2% CAGR because updated seismic and energy codes make upgrades mandatory for tens of thousands of legacy buildings. Ministry initiatives extending wooden-structure service life from 24 to 50 years unlock subsidies that shift owner economics toward retrofit. Performance-based retrofitting techniques—steel-plate jacketing, carbon-fiber wrapping, and high-damping rubber isolators—allow phased work with lower tenant disruption. Bundling seismic, energy, and ICT upgrades often delivers 12-15% IRRs, comparable to new-build returns but with lower permitting risk.
Even so, greenfield projects keep dominating absolute value because large master-planned precincts include transit hubs, data-center campuses, and Expo-driven attractions requiring purpose-built shells. Contractors thus maintain dual capability lines: one specializing in constrained-site retrofits, another in high-rise new builds with modular engineering.
By Investment Source: Private Capital Leads as Public Share Quickens
Private entities controlled 77.55% of 2025 spending, underpinning the entrepreneurial dynamism that characterizes the Japan commercial construction industry. Pension funds, REITs, and foreign sovereign investors queue for stabilized core assets, while domestic trading houses co-develop brownfield sites. Meanwhile, the public segment’s 3.36% CAGR signals policy-driven spending on disaster-resilient transport, automated conveyor corridors, and Expo-linked civic venues. A headline illustration is the MLIT-backed 500-kilometer conveyor belt between Tokyo and Osaka, priced at roughly JPY 80 billion (USD 0.55 billion) per 10 kilometers and intended to slash freight truck emissions.
Public-private partnerships dominate megaproject financing, distributing risk and marrying regulatory influence with private-sector speed. Shinkansen station overbuilds bundle government land grants with developer-funded superstructures, unlocking air-rights value otherwise sitting idle. Private investors are still shy away from early-stage renewable energy infrastructure because the Feed-in-Premium system introduces merchant-price exposure, nudging more projects toward state participation.
Geography Analysis
Tokyo, the nation’s administrative and financial heart, generated 39.25% of 2025 commercial-construction output despite land constraints that push developers toward vertically mixed-use superstructures. Projects like Shibuya Scramble Square Phase II add 95,000 m² across offices, retail, culture, and transit, exemplifying how air-rights engineering maximizes scarce plots. Developers increasingly integrate pedestrian decks, rooftop greenery, and multimodal transport nodes to comply with city plans promoting walkability, emissions reduction, and disaster evacuation capacity. Construction wages in Tokyo outpace national averages by 18%, reflecting the labor squeeze intensified by parallel residential and infrastructure pipelines.
Osaka, historically Japan’s mercantile capital, now records the fastest regional CAGR at 3.75%. Expo 2025 alone is projected to attract 28.2 million visitors, underpinning permanent rail, road, and hospitality upgrades. Oracle’s USD 8 billion data-center rollout confirms Osaka as a credible alternative to Tokyo for latency-sensitive workloads. Cost competitiveness, an existing skilled labor base, and proactive prefectural incentives combine to pull corporate relocations east-to-west, diversifying national economic geography.
Nagoya and the rest of Japan capture niche growth. Completion of the Shin Tomei Expressway shortened freight routes and sparked a 97% jump in commercial land deals in Shizuoka, showing how transport infrastructure seeds construction demand. Regional tourism rebound lifts hotel and retail projects in Kyoto, Fukuoka, and Sapporo as the government targets 60 million inbound visitors by 2030. Remote prefectures face demographic decline, limiting mainstream office or retail supply, yet renewable-energy and logistics platforms generate episodic spikes in activity. National grid enhancements and the pending Hokkaido Shinkansen extension hint at future construction clusters, provided permitting hurdles ease and labor-mobility programs expand.
Regulatory Landscape
Japan commercial construction is governed by the Ministry of Land, Infrastructure, Transport and Tourism (MLIT), with oversight centered on the Building Standard Act, the Building Energy Efficiency Act, and the Construction Business Act (CBA). From 2025, energy-performance compliance tightened for non-residential buildings, including buildings above 300 m2 under the Building Energy Efficiency Act benchmarks, which is raising demand for compliant designs, MEP upgrades, and verification-ready commissioning across both new-build and renovation.
Contracting and delivery practices also tightened through the June 2024 amendment to the Construction Business Act, with full implementation effective December 12, 2025. The amended rules include Article 19-3(2) provisions that restrict agreements below the cost ordinarily required to perform the work. MLIT issued revised compliance guidelines in January 2026 to clarify interpretations and operationalize the amended rules, pushing contractors and developers toward more transparent cost breakdowns, procurement documentation, and contract structures that better absorb price volatility and labor constraints.
Value Chain Analysis
Japan’s commercial construction value chain typically runs from land assembly and project sponsorship (developers, REITs, trading houses, and corporate owner-occupiers) through planning and design (architectural, structural, and MEP engineering), permitting and compliance, general contracting (often led by the large domestic majors), multi-tier subcontracting, materials and equipment supply (steel, ready-mixed concrete, façade systems, HVAC, power, and controls), and finally commissioning and facility operations. Delivery increasingly emphasizes front-loaded constructability and cost management, especially for dense urban redevelopment and renovation, where phasing, tenant continuity, and seismic and energy compliance shape design and procurement decisions.
Execution bottlenecks are concentrated in labor and site capacity rather than upstream material availability. Industry reporting cited in 2025-2026 described record backlogs (over JPY 15 trillion as of mid-2025) and indicated that about 70% of large and midsize contractors could not accept new large-scale work for fiscal 2026 due to labor shortages, which constrains schedule certainty and bid appetite. In response, the chain is shifting further toward prefabrication and Construction DX practices (BIM-enabled coordination, measurement and verification tooling, and automation), while financing and working-capital support tools promoted by MLIT, including lending frameworks that use construction work debt as collateral, help primes stabilize cash flow across long, phased redevelopment programs.
Competitive Landscape
Market concentration remains moderate. The “Big Five”—Kajima, Obayashi, Shimizu, Taisei, and Takenaka—together control over half of high-rise and infrastructure contracts, but Infroneer Holdings’ May 2025 purchase of Sumitomo Mitsui Construction lifts the acquirer into the top tier and signals a new consolidation wave. Technology is the new battleground. Obayashi’s joint venture with a Silicon Valley robotics firm to deploy autonomous cranes illustrates the pivot from pure civil engineering to integrated tech solutions. Contractors differentiate by offering seismic-retrofit expertise, green-building certification services, and life-cycle facility management, giving owners a single point of accountability.
Regional players retain competitive edges in permit navigation and community engagement. Local contractors in Kansai secure Expo-adjacent contracts because of shorter mobilization times and established subcontractor networks. Foreign contractors face cultural and regulatory barriers, yet niche know-how in mass-timber high-rise or data-center cooling opens selective entry points, often through joint ventures with domestic majors. Supply-chain digitalization, BIM-enabled collaboration, and prefabrication expand quickly as labor shortages escalate.
As margins tighten under materials inflation, firms streamline procurement, adopt lean site logistics, and, in renovation, employ occupied-building protocols that minimize tenant disruption fees. Legal structures evolve, lump-sum contracts give way to cost-plus-fee with open-book transparency when material pricing volatility challenges fixed-price viability. Overall, competitive intensity rises as firms race to secure scarce people, plots, and power capacity amid consistent demand drivers.
Japan Commercial Construction Industry Leaders
Kajima Corporation
Obayashi Corporation
Shimizu Corporation
Taisei Corporation
Takenaka Corporation
- *Disclaimer: Major Players sorted in no particular order

Market Opportunities and Future Outlook
Opportunities concentrate in (1) metro redevelopment packages that combine offices, retail, hotels, and transit-adjacent public space, and (2) code-driven renovation that bundles seismic strengthening with energy upgrades. Recent project naming and completions show an active pipeline: Mitsui Fudosan advanced multiple Tokyo-area redevelopment initiatives in March to April 2026, including the opening of BASEGATE YOKOHAMA KANNAI and district branding for Tokyo Midtown Nihonbashi and HIBIYA CROSSPARK, while Sumitomo Corporation marked completion of Yodoyabashi Gate Tower in Osaka in January 2026. These multi-phase, mixed-use programs broaden addressable scope beyond shells into higher-value MEP, façade performance, fit-out, and long-horizon lifecycle services.
A second opportunity centers on delivery modernization aimed at labor productivity and compliance-ready reporting. MLIT’s i-Construction 2.0 and the 2026 Construction DX roadmap prioritize BIM/CIM integration and a common construction data environment starting in 2026, supporting demand for contractors, consultants, and software-enabled subcontractors that can standardize data handover from design through commissioning. With contracting rules tightened under the amended Construction Business Act, and with owners demanding measurable seismic and energy outcomes, providers that can combine early contractor involvement, transparent cost control, and digital site management are better positioned to win work across both new-build megaprojects and occupied-building retrofits.
Recent Industry Developments
- June 2026: Obayashi Corporation announced it would acquire Multiplex, a building construction company operating in Australia, the UK, and Canada, making it a wholly owned subsidiary (acquisition scheduled for September 30, 2026). The acquisition expands Obayashi’s building-construction platform in developed markets and improves access to large commercial project delivery capabilities and client relationships outside Japan.
- May 2026: Shimizu Corporation announced it had been awarded an emergency rehabilitation project for the flood-damaged Sindhuli Road in Nepal by the country’s Ministry of Physical Infrastructure and Transport, with a contract value of about JPY 2.1 billion and completion targeted for December 2027. While overseas, the award adds to the major contractors’ external order books and supports capability building in rapid-response engineering and complex logistics execution.
- May 2025: Infroneer Holdings completed its tender offer for Sumitomo Mitsui Construction, creating a larger combined contractor group and signaling further consolidation dynamics in Japan’s construction sector. Scale benefits can improve procurement leverage and resourcing flexibility, which is material under ongoing labor tightness and large-project scheduling pressure.


Research Methodology Framework and Report Scope
Market Definition and Coverage
For this methodology, the market counts the value of commercial building work completed in Japan, covering new builds and major renovations for business-used facilities such as offices, retail spaces, hotels, logistics buildings, and data centers.
Scope exclusions: Infrastructure works (roads, rail, ports, utilities), single-family housing, and routine maintenance are excluded.
Segmentation Overview
- By Commercial Sector Type
- Office
- Retail
- Industrial and Logistics
- Others
- By Construction Type
- New Construction
- Renovation
- By Investment Source
- Public
- Private
- By Region
- Tokyo
- Osaka
- Nagoya
- Rest of Japan
Data Sources, Market Sizing, and Validation
Desk Research
Desk work starts with publicly available construction output signals and economic series that help us set a realistic demand pool for commercial buildings in Japan. We typically use sources such as Japan's Statistics Bureau releases, MLIT publications on construction activity, Bank of Japan macro series, and OECD datasets to cross-check investment cycles.
To keep assumptions grounded, we also read company annual reports and investor presentations from listed contractors, plus trusted trade press and association updates on labor, materials, and project pipelines. Where we need to confirm revenue splits and project exposure, paid subscriptions for company financials and news intelligence are referenced, and import-export shipment data can be used as a practical sense check for key building inputs. The sources mentioned here are illustrative only and not exhaustive, and many other public references are used for data collection, validation, and clarification.
Primary Interviews and Surveys
Primary conversations are used to pressure-test what we read in public sources, especially around how commercial demand is shifting across offices, retail, hospitality, logistics, and data center builds. We speak with contractors, specialty subcontractors, developers, and project-facing roles to confirm build rates, typical contract pricing behavior, and the timing from award to completion in Japan.
Distribution of primary research fieldwork respondents
| Company type | Respondent position |
|---|---|
| Top tier: 37% | CXOs: 12% |
| Mid tier: 48% | Functional/Unit leaders: 40% |
| Smaller Players: 15% | Managers: 48% |
Market-Sizing & Forecasting
The sizing logic starts from a top-down reconstruction of commercial building output in Japan, where overall non-residential construction activity is filtered into business-used building types and then aligned to spend components that sit inside a contractor-delivered project value. Once that structure is in place, we corroborate totals using selective bottom-up checks, such as sampled project awards and completion values, and a sanity check using large contractor revenue exposure to commercial work, which helps us adjust for gaps in public reporting.
Key inputs for this market include commercial floor space additions and starts, construction cost inflation (materials and labor), the active pipeline for logistics and data center capacity additions, office and retail space utilization signals, and the share of renovation versus new build, which shifts the spending mix. Because Japan's commercial market can move with policy, financing conditions, and redevelopment cycles, scenario analysis is used for the forecast. The range is then narrowed using the consensus view from interviewees on bid activity, backlog visibility, and expected price escalation. If a bottom-up check has missing categories, the gap is filled using clearly stated proxies (such as average value per project type) and re-tested against the top-down total.
Data Validation & Update Cycle
Outputs are checked through triangulation across independent signals, so the market total does not rely on a single series or one interview viewpoint. We review outliers by looking for unusual jumps in construction value, cost indices, and pipeline indicators, and then we re-contact sources if a variance cannot be explained by timing or definition.
Before sign-off, the model and assumptions go through multi-step analyst review, followed by a final pass to ensure numbers are consistent across years, currencies, and growth rates. Reports are refreshed annually, and interim updates are triggered when a material event changes commercial project flow, such as a sharp cost shift, a major redevelopment program, or a sudden financing swing.
Mordor Intelligence's Japan Commercial Construction Market Size Compared Against Other Published Estimates
It is common to see different market-size numbers for Japan commercial construction, even when the topic name is similar. The main drivers are how each publisher separates commercial buildings from other non-residential work, and how renovation value and cost inflation are handled for the base year.
Commercial value is counted by Mordor Intelligence only for new-build and major renovation of business-used facilities in Japan, with routine maintenance and infrastructure excluded. That scope choice changes the total even before forecasting assumptions are applied.
Benchmark comparison
| Source | Market Size | Gaps in Research Methodology |
|---|---|---|
| Mordor Intelligence | USD 107.06 B (2025) | |
| Industry Association A | USD 132.40 B (2025) | Uses a wider non-residential construction definition that can include some adjacent civil and site-related works, and it typically reports nominal totals without a clear separation of major renovation versus routine upkeep. |
| Global Consultancy B | USD 98.70 B (2025) | Applies a narrower project set focused on private commercial new-build only, and it tends to use conservative price-growth assumptions that can understate renovation-heavy spending patterns in Japan. |
Scope choices explain most of the spread, and the remainder comes from how pricing and renovation shares are carried through the base year. By tying the total to observable building activity signals and then validating the spend mix through interviews, we keep the estimate traceable to repeatable steps that can be rechecked as the market updates.


Key Questions Answered in the Report
What is the current size of the Japan commercial construction market?
The market is valued at USD 109.97 billion in 2026 and is on track to reach USD 125.76 billion by 2031, expanding at a 2.72% CAGR.
Which commercial sector is growing the fastest in Japan?
Industrial & Logistics construction posts the highest 3.08% CAGR through 2031 as data-center and automated-warehouse demand accelerates.
How large is the renovation opportunity compared with new-build projects?
Renovation holds a 28.15% revenue share in 2025, yet its 3.2% CAGR outstrips new-build growth because mandatory seismic and energy upgrades make retrofits economically attractive.
Why is Osaka expected to outpace Tokyo in growth?
Expo 2025 infrastructure and data-center investment lift Osaka’s forecast CAGR to 3.75%, versus Tokyo’s larger but slower-growing base.
How are labor shortages being addressed by Japanese contractors?
Firms deploy autonomous machinery, BIM-enabled prefabrication and government-backed “i-Construction” subsidies to offset a workforce expected to shrink another 20% by 2040.
What role does government funding play in future commercial projects?
Although private capital still finances 77.55% of activity, public outlays are rising at a 3.36% CAGR for transit hubs, Expo venues and disaster-resilient infrastructure that underpin broader commercial development.
Page last updated on:


 Your data is secure and never sold or shared.


