
Market Overview
| Study Period | 2021 - 2031 |
|---|---|
| Forecast Data Period | 2026 - 2031 |
| Base Year Market Size (2025) | USD 3.82 Billion |
| Market Size (2026) | USD 3.99 Billion |
| Market Size (2031) | USD 4.91 Billion |
| Growth Rate (2026 - 2031) | 4.25 % |
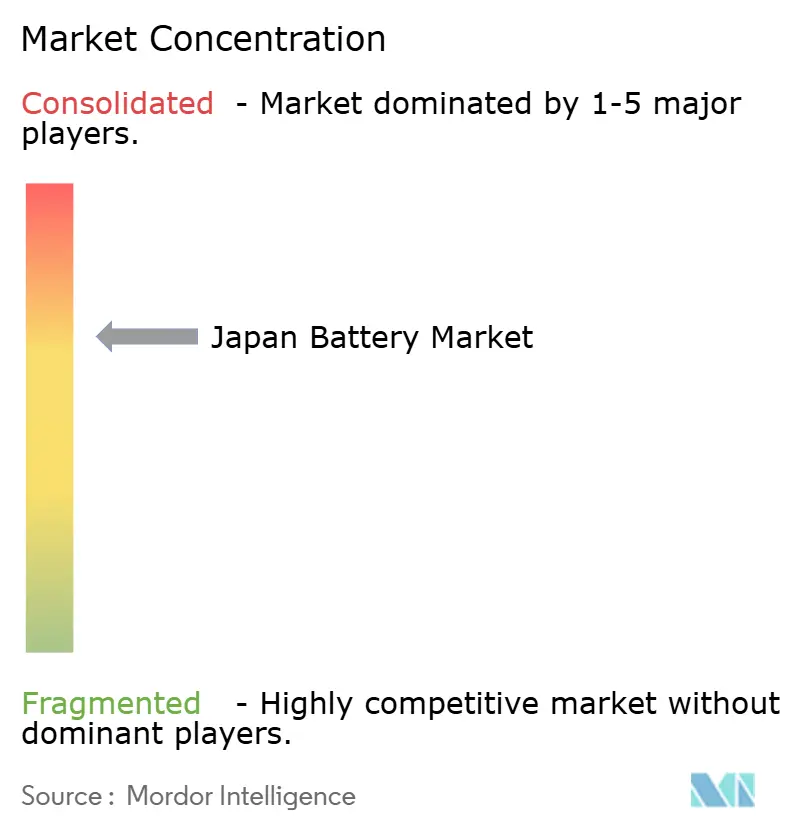
| Market Concentration | Medium |
Major Players *Disclaimer: Major Players sorted in no particular order Image © Mordor Intelligence. Reuse requires attribution under CC BY 4.0. | |
Japan Battery Market Analysis by Mordor Intelligence
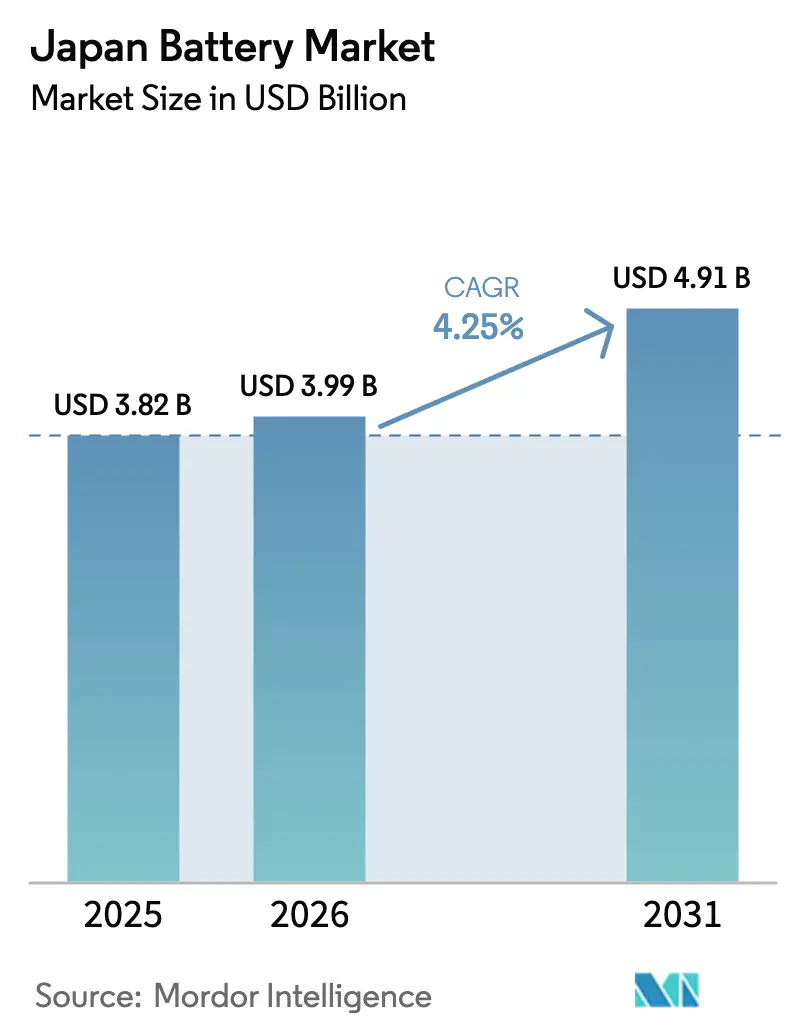
The Japan Battery Market size is expected to increase from USD 3.82 billion in 2025 to USD 3.99 billion in 2026 and reach USD 4.91 billion by 2031, growing at a CAGR of 4.25% over 2026-2031.
The measured expansion mirrors manufacturers shifting from commodity lithium-ion output toward premium solid-state formats and stationary storage solutions, supported by the Ministry of Economy, Trade and Industry’s multiyear subsidy program. Panasonic’s cost-compression roadmap for 4680 cylindrical cells, Toyota-backed joint ventures that anchor domestic plug-in hybrid demand, and GS Yuasa’s solid-state pilot line form the technological spine behind short-term revenue growth. Export-oriented electric-vehicle strategies by Toyota, Nissan, and Honda keep factory utilization high while the U.S. Inflation Reduction Act rules steer cathode sourcing away from China. Ongoing investments by JOGMEC in Chilean lithium and Australian nickel deposits signal a concerted effort to reduce raw-material risk, although graphite and nickel sulfate dependencies linger.
Key Report Takeaways
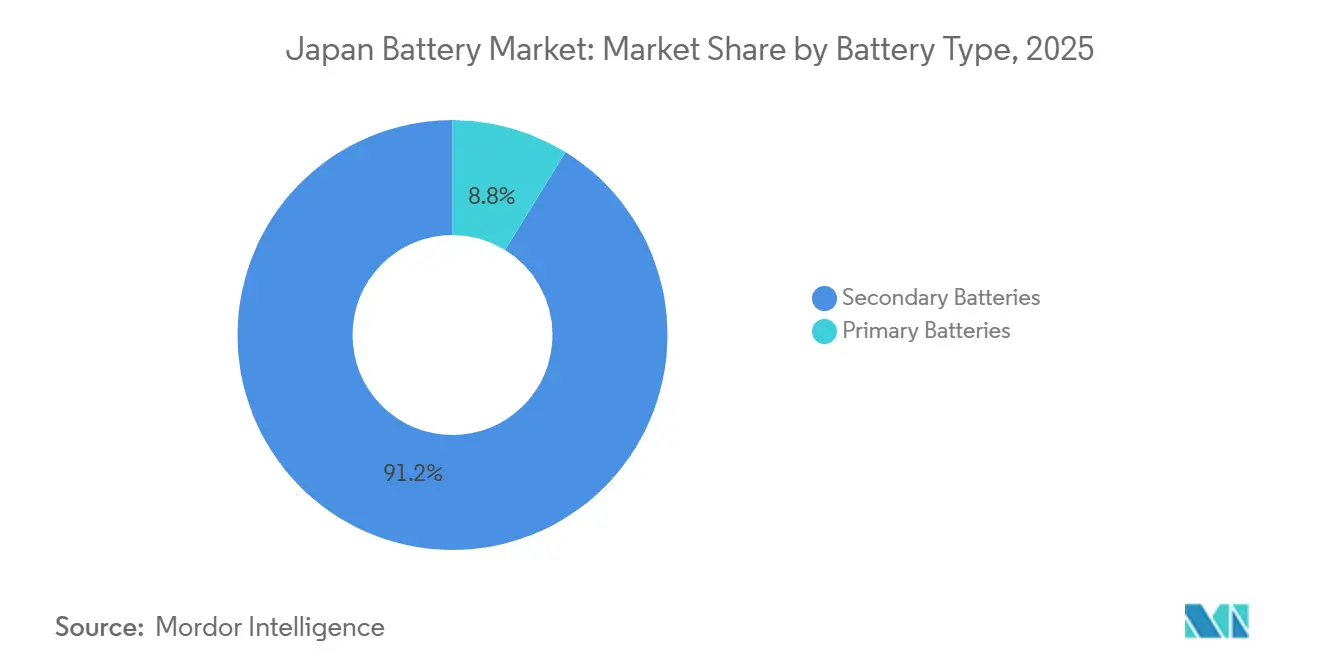
- By battery type, secondary batteries led with 91.2% Japan battery market share in 2025, while the segment is set to expand at a 4.6% CAGR through 2031.
- By technology, lithium-ion retained 51.5% share of the Japan battery market size in 2025, whereas solid-state chemistries are poised for the fastest growth at a 19.8% CAGR to 2031.
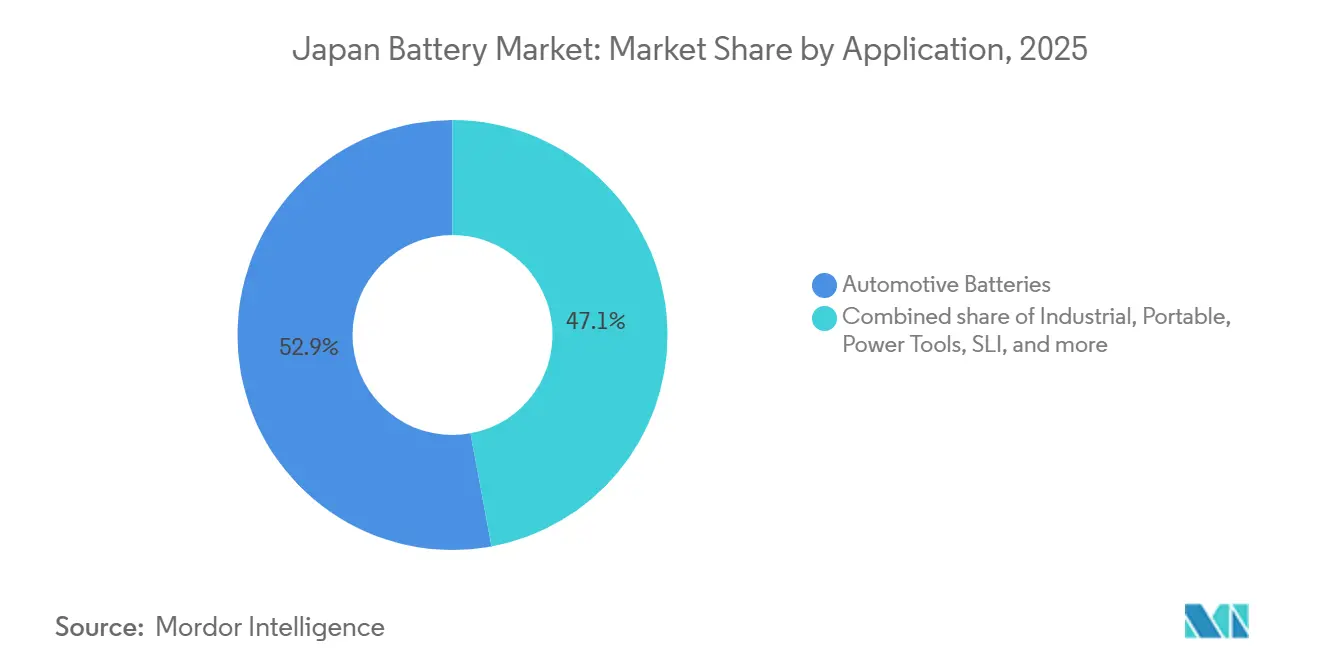
- By application, the automotive segment accounted for 52.9% of the Japan battery market size in 2025 and is forecast to advance at a 5.5% CAGR between 2026 and 2031.
Note: Market size and forecast figures in this report are generated using Mordor Intelligence’s proprietary estimation framework, updated with the latest available data and insights as of January 2026.
Japan Battery Market Trends and Insights
Drivers Impact Analysis*
| Driver | (~) % Impact on CAGR Forecast | Geographic Relevance | Impact Timeline |
|---|---|---|---|
| Declining domestic lithium-ion cell production costs | +0.8% | National, concentrated in Osaka, Hyogo, and Shiga prefectures | Medium term (2-4 years) |
| Government subsidies for energy storage system adoption | +0.6% | National, with accelerated uptake in Tokyo, Osaka, and Hokkaido | Short term (≤ 2 years) |
| Growing electric vehicle exports from Japan-based OEMs | +1.0% | National, export corridors via Yokohama and Nagoya ports | Medium term (2-4 years) |
| Recycling mandates boosting circular supply chains | +0.4% | National, pilot programs in Kansai and Kanto regions | Long term (≥ 4 years) |
| Semiconductor fabrication facilities' power-backup demand | +0.3% | Regional, Kyushu and Tohoku semiconductor clusters | Medium term (2-4 years) |
| Solar power purchase agreement roll-outs in rural prefectures | +0.2% | Regional, Tohoku, Hokuriku, and Shikoku prefectures | Long term (≥ 4 years) |
| Source: Mordor Intelligence | |||


Declining Domestic Lithium-Ion Cell Production Costs
Panasonic activated a 32-gigawatt-hour Kansas line in July 2025 that applies dry-electrode coating and nickel-rich cathodes to cut cost per kilowatt-hour by half during the early 2030s.[1]Maki Shiraki, “Panasonic Targets Cost Cuts for Tesla Batteries in Profitability Push,” Bloomberg, bloomberg.com Prime Planet Energy Solutions relies on those process gains while commissioning a Himeji prismatic-cell line in 2026, positioning the venture to displace South Korean imports in plug-in hybrids. GS Yuasa is scaling a Kyoto facility to 1 gigawatt-hour and parallel-piloting solid-state output, demonstrating that unit economics remain the gating factor for market share.[2]Tim Kelly, “Japan to Provide $2.4 Billion in Subsidies for 12 Battery-Related Projects,” Reuters, reuters.com Domestic manufacturers thus wager that automation and yield gains will outrun raw-material cost pressure and close the price gap with Chinese lithium iron phosphate cells priced near USD 60 per kilowatt-hour. Success would keep the Japan battery market on its current growth trajectory and preserve high-value manufacturing jobs.
Government Subsidies for Energy Storage System Adoption
Tokyo earmarked USD 2.4 billion across 12 battery projects in September 2024, underscoring that energy storage is treated as national infrastructure rather than discretionary hardware. The Long-term Decarbonization Auction awarded JPY 9 billion in 10-year capacity payments during 2024, removing revenue uncertainty for aggregators deploying behind-the-meter batteries. A Tokyo subsidy of up to JPY 150,000 per residential unit lifted the city’s 2024 installation count above 50,000 systems, triple the national average. These stacked incentives anchor demand for stationary batteries and enable suppliers such as NGK Insulators to secure multiyear offtake contracts with Tokyo Electric Power Company. Mandatory interoperability and cybersecurity standards issued by METI guide product roadmaps, ensuring that subsidy recipients invest in upgradeable, grid-ready platforms.
Growing Electric Vehicle Exports from Japan-Based OEMs
Toyota declared plans in October 2025 to triple battery-electric exports to North America and Southeast Asia by 2028, leveraging domestic cell supply to avoid tariff headwinds. Nissan scaled Ariya shipments via Yokohama port, sustaining utilization at Envision AESC’s Ibaraki plant and neutralizing capacity cuts elsewhere. Honda’s Tochigi demonstration line launched in January 2025 to validate solid-state batteries intended for export models from 2027. These outbound flows ensure that the Japan battery market remains coupled to foreign demand dynamics and justify continued domestic cell investment. Sourcing compliance shapes strategy; Toyota Tsusho’s 25% stake in LG Chem’s Gumi cathode plant guarantees Inflation Reduction Act alignment while diversifying away from China.
Recycling Mandates Boosting Circular Supply Chains
Japan’s Act for Promotion of Effective Utilization of Resources sets a 30% recycling target, yet lithium-ion recovery stood at only 6% in 2024 due to limited collection points. The Japan Portable Rechargeable Battery Recycling Centre piloted hydrometallurgical processes that capture 95% of cobalt and nickel, a vital step toward reducing import dependence. Toyota signed a 2024 agreement with Sumitomo Metal Mining to close the cathode loop, anticipating EU regulations that compel recycled-content thresholds on batteries sold in Europe. When successful, such programs will unlock domestic secondary supply streams and lift the Japan battery market toward circularity while lowering exposure to geopolitical supply shocks.
Restraints Impact Analysis*
| Restraint | (~) % Impact on CAGR Forecast | Geographic Relevance | Impact Timeline |
|---|---|---|---|
| Raw-material import dependency on China | -0.7% | National, affecting all cell production hubs | Short term (≤ 2 years) |
| Safety recalls affecting consumer trust | -0.5% | National, with concentrated impact in consumer electronics segment | Short term (≤ 2 years) |
| Prefectural grid-fee disparities | -0.2% | Regional, rural prefectures with higher connection charges | Medium term (2-4 years) |
| Aging workforce in cell manufacturing | -0.3% | National, acute in Kansai and Chubu industrial zones | Long term (≥ 4 years) |
| Source: Mordor Intelligence | |||
Raw-Material Import Dependency on China
China supplied about 90% of Japan’s natural graphite imports in 2024, and October 2023 export controls caused a 35% price spike that persisted through early 2024. Nickel sulfate exposure has risen as cobalt content falls, yet 60% of refined nickel still arrives from Chinese smelters. JOGMEC’s 2024 equity stakes in Chilean lithium and Australian nickel projects hedge supply risk but offer little relief to near-term pricing. Until diversified offtake agreements mature, raw-material shocks could curb profitability and slow capacity expansions inside the Japan battery market.
Safety Recalls Affecting Consumer Trust
Panasonic recalled 2.9 million laptop batteries in October 2024 due to overheating faults, followed a month later by Toshiba’s withdrawal of 76,000 Dynabook units. In response, METI ordered extra thermal-runaway tests for portable packs over 100 watt-hours, adding up to 12 weeks to certification timelines and raising compliance costs by around 4%. The incidents diluted the historical safety premium associated with Japanese brands and steered some buyers toward lower-priced Chinese alternatives. Solid-state batteries promise inherent safety benefits, yet they must still pass the same tests, meaning reputation recovery will take time.
*Our forecasts treat driver/restraint impacts as directional, not additive. The impact forecasts reflect baseline growth, mix effects, and variable interactions.
Segment Analysis
By Battery Type: Rechargeable Cells Dominate Amid Primary Segment Decline
Secondary batteries captured 91.2% of the Japan battery market share in 2025, and the segment is set to grow at 4.6% through 2031 as high-cycle lithium titanate and fast-charge lithium-ion solutions align with industrial and automotive duty cycles.[3]Toshiba, “SCiB Battery Technology,” global.toshiba Primary cells remain useful where five-year replacement intervals or extreme temperature tolerance matter, but revenue contribution keeps sliding. Regulatory frameworks favor rechargeables because extended producer responsibility applies to those chemistries. Maxell’s transfer of its micro primary line to Murata in June 2025 signals a broader exit from low-margin niches. The Japan battery market size tied to primary formats will therefore keep contracting.
Primary batteries do retain footholds in sub-zero utility metering and offshore sensing, where lithium thionyl chloride outperforms lithium-ion electrolyte stability. Even so, no Japanese player announced new capacity beyond maintenance capital in 2025, suggesting replacement demand alone sustains output. Rechargeable suppliers enjoy design-in advantages across automotive, energy storage, and power-tool applications, locking customers into multi-year contracts that underpin volume visibility.


By Technology: Lithium-Ion Leads, Solid-State Disrupts, Legacy Chemistries Persist
Lithium-ion technologies held 51.5% of the Japan battery market size in 2025, supported by Panasonic’s 4680 programs and Prime Planet Energy Solutions’ prismatic packs. Solid-state chemistries, however, are expanding at 19.8% a year toward 2031, targeting densities near 400 watt-hours per kilogram that could trigger a share shift once economies of scale kick in. Murata’s joint development pact with QuantumScape illustrates how tier-two suppliers are chasing safer, higher-margin oxide designs.[4]QuantumScape, “QuantumScape and Murata Manufacturing Enter Joint Development Agreement,” quantumscape.com
Lead-acid and nickel-metal hydride hold niche positions in starting-lighting-ignition and earlier hybrid models. NGK Insulators’ sodium-sulfur systems answer six-hour grid-balancing needs, while Sumitomo Electric’s flow batteries appeal where ultra-long cycle life outweighs size penalties. The technology bifurcation means lithium-ion continues to dominate on cost, solid-state on safety and density, and legacy chemistries on application specificity.
By Application: Automotive Leads, Industrial Storage Accelerates, Portable Electronics Mature
Automotive packs accounted for 52.9% of the Japan battery market size in 2025 and are estimated to grow at 5.5% through 2031 as Toyota triples battery-electric exports and Nissan scales Ariya volumes.[5]Peter Landers, “Toyota Leads Global Race for Solid-State Battery Patents,” Nikkei Asia, nikkei.com Industrial stationary storage benefits from METI auctions that guarantee revenue streams, pushing commercial deployments into positive cash flow territory. Portable electronics growth aligns with replacement cycles around 3% annually, so suppliers regard the category as stable rather than expansive.
High selling prices of automotive packs support specialized production lines like Prime Planet’s Himeji plant, which opens in 2026. In contrast, telecom tower backup and data-center storage drive diversification into sodium-sulfur and flow batteries that tolerate long discharge windows. Power-tool platforms from Makita and Hikoki standardize on 18-volt and 36-volt lithium-ion cartridges that bind consumers into brand ecosystems.
Geography Analysis
The Kansai corridor, spanning Osaka, Hyogo, and Shiga, anchors lithium-ion and solid-state capacity. Panasonic’s Osaka headquarters governs global battery strategy, GS Yuasa pilots solid-state in Shiga, and Prime Planet’s Himeji line sits in Hyogo. Export logistics funnel through Yokohama and Nagoya ports, sustaining throughput for Toyota and Nissan vehicle shipments. Kyushu’s semiconductor cluster creates a secondary hub by demanding reliable backup power.
Prefectural policy divergence shapes stationary storage uptake. Tokyo’s subsidy produced more than 50,000 home-battery systems in 2024, triple the national average. Hokkaido, facing colder climates and higher tariffs, adopted NGK sodium-sulfur units for renewable firming. Rural regions in Tohoku and Shikoku pilot paired solar and battery power purchase agreements, though scale remains modest.
Export competitiveness determines future siting decisions. Higher Japanese port fees and labor costs challenge producers as South Korean and Chinese rivals add capacity. Nissan’s canceled Sunderland plant highlights the risk of duplicative facilities when foreign exchange or spot-price swings erode margins. Whether upcoming solid-state lines disperse to lower-cost prefectures will depend on automation lowering labor sensitivity.
Regulatory Landscape
Japan’s battery regulatory environment combines industrial policy, safety standards, and circular-economy obligations. In June 2026, the Ministry of Economy, Trade and Industry (METI) revised its direction into the Battery and Power Supply Industry Strategy, positioning batteries as part of power-source systems and setting a domestic manufacturing-base target of 150 GWh per year in the 2030 to mid-2030s timeframe. Supply-chain resilience measures are also anchored in Japan’s Economic Security Promotion Act framework, which supports state-certified supply guarantee plans for upstream minerals and battery manufacturing projects.
On product compliance, Japan continues to tighten safety and conformance pathways through national standards and certification practices. JIS C 8715-2:2024 updated safety requirements for industrial secondary lithium cells and battery systems, reinforcing expectations for industrial and stationary deployments. For projects accessing public support, third-party conformity and safety certification aligned to NITE guidelines is increasingly used as a gatekeeper for grid-scale BESS subsidies and decarbonization-related auctions, tying market access to demonstrated safety, interoperability, and cybersecurity readiness.
Competitive Landscape
Panasonic, Prime Planet Energy Solutions, and GS Yuasa supply most domestic automotive packs, giving the market moderate concentration. Panasonic pursues dry-electrode coating and high-nickel cathodes to halve costs by the early 2030s. Simultaneously, pilot-scale solid-state lines hedge against lithium-ion commoditization. Toyota Tsusho’s stake in LG Chem’s cathode plant locks compliant supply chains for U.S. markets. NGK Insulators leads utility storage with sodium-sulfur, while Toshiba leverages lithium titanate oxide for industrial motive applications where 20,000-cycle durability offsets a 30% price premium.
Murata Manufacturing’s October 2025 agreement with QuantumScape propels the electronics component leader into automotive-grade solid-state cells. Patent activity reinforces competitive positioning; Toyota filed more than 1,300 solid-state battery patents between 2014 and 2024, signaling intent to defend premium margins. Compliance obligations under the EU Battery Regulation and domestic recycling laws spur joint ventures with smelters to retain cathode materials inside Japan’s borders.
Japan Battery Industry Leaders
Panasonic Corporation
GS Yuasa International Ltd
NGK Insulators Ltd.,
Toshiba Corporation
Maxell, Ltd.
- *Disclaimer: Major Players sorted in no particular order

Market Opportunities and Future Outlook
Policy is shifting from a cell-centric approach toward batteries as grid and power-source infrastructure, creating whitespace for suppliers that can package cells with power electronics, cybersecurity-compliant controls, and long-duration operating profiles. METI’s June 2026 Battery and Power Supply Industry Strategy includes a 150 GWh per year domestic manufacturing-base target for the 2030 to mid-2030s timeframe, and it explicitly treats batteries as components of power-source systems. That framing supports demand for grid-ready stationary solutions alongside automotive cells.
Project activity points to a pipeline of utility and industrial storage deployments, particularly where renewable integration and local grid constraints raise the value of fast-response storage. ITOCHU began construction of a 67 MW/230.1 MWh grid-scale BESS in Fukuoka Prefecture (announced June 2026), with FY2027 operations targeted. RENOVA-related project financing was secured for a 90 MW/270 MWh storage battery project in Shizuoka Prefecture (March 2026). On the supply side, PowerX announced expansion steps in March 2026, including a large-scale production line addition at its Tamano (Okayama) Power Base and a separate 2 GWh BESS manufacturing facility plan in Tomakomai (Hokkaido), indicating a growing domestic buildout focused on stationary storage manufacturing and system integration.
Recent Industry Developments
- July 2026: Sumitomo Electric Industries announced the start of construction for a fourth-phase Vanadium Redox Flow Battery installation in Kashiwazaki. The expansion adds domestic reference capacity for long-duration stationary storage, supporting renewable integration use cases where cycle life and safety characteristics matter more than compactness.
- May 2026: SoftBank Corp. announced the launch of a domestic battery business spanning battery cells and storage systems aimed at AI data centers and grid infrastructure. The move widens the competitive set beyond traditional battery makers and ties fast-growing data center power needs to local manufacturing and system supply chains.
- November 2025: Panasonic Energy signed a multi-year agreement to supply cylindrical 2170 lithium-ion batteries to Zoox, with deliveries starting in early 2026. The contract reinforces export-linked demand for Japanese cylindrical formats and supports utilization and investment continuity in high-volume cell lines.


Research Methodology Framework and Report Scope
Market Definition and Coverage
For this study, the Japan battery market is defined as the domestic revenue generated from batteries supplied for use in Japan across major end uses, regardless of where the cells were manufactured, and counted at the point of sale into the Japanese market.
Scope exclusions: We exclude battery recycling services, second-life repurposing services, and standalone charging infrastructure hardware because these are not battery sales.
Segmentation Overview
- By Battery Type
- Primary Batteries
- Secondary Batteries
- By Technology
- Lead-acid
- Li-ion
- Nickel-metal hydride
- Nickel-cadmium
- Sodium-sulfur
- Solid-state
- Flow Battery
- Emerging chemistries
- By Application
- Automotive (HEV, PHEV, and EV)
- Industrial (Motive, Stationary (Telecom, UPS, ESS), etc.)
- Portable (Consumer Electronics, etc.)
- Power Tools
- SLI
- Other Applications
Data Sources, Market Sizing, and Validation
Desk Research
Desk research was used to set the market boundary, build the first demand and supply view, and sanity check the direction of our assumptions. We relied on public sources such as Japan ministry energy and industry releases, customs and trade statistics, the International Energy Agency for storage and EV context, and the OECD for macro indicators that influence manufacturing and consumption trends.
To keep the model grounded in real operating signals, we also reviewed manufacturer annual reports, investor presentations, earnings call transcripts, and credible press coverage of capacity additions and policy changes. Where needed, we used paid subscriptions for company financials and intelligence, patent databases to understand technology momentum (such as solid-state and sodium-ion mentions), and a shipment-level import and export database for directional checks on battery and component flows. The desk sources mentioned here are illustrative, and many other public documents and datasets were also used to collect, validate, and clarify the final analysis.
Primary Interviews and Surveys
Primary work focused on confirming what is actually being purchased in Japan and how pricing and mix are moving across the main end uses. We spoke with battery manufacturers, component suppliers, distributors, and large buyer groups in automotive, industrial backup, and consumer electronics so that assumptions on volumes, average selling prices, and replacement cycles could be tightened. For consistency, responses were cross-checked across Japan-wide demand centers and supply chain viewpoints, and gaps from desk research were revisited with follow-up questions before finalizing the model.
Distribution of primary research fieldwork respondents
| Company type | Respondent position |
|---|---|
| Top tier: 26% | CXOs: 15% |
| Mid tier: 53% | Functional/Unit leaders: 34% |
| Smaller Players: 21% | Managers: 51% |
Market-Sizing & Forecasting
Sizing starts with a top-down build where Japan demand is reconstructed using application-level demand pools and technology mix, and then translated into revenue using typical price bands seen in the country. In practice, we used indicators such as EV and hybrid production and sales trends, stationary energy storage deployments, consumer electronics shipment patterns, battery manufacturing capacity and utilization commentary, and observable lithium-ion versus lead-acid mix shifts to keep totals realistic.
Those totals were then corroborated with selective bottom-up approximations, such as rolling up a sample of supplier revenues tied to Japan exposure, and checking implied volumes against channel feedback on shipments and replacement demand (especially for SLI and industrial backup). Where company reporting or trade signals were incomplete, gaps were handled by applying conservative penetration and replacement-rate assumptions that were validated through interviews, and adjusted when contradictions appeared.
Forecasting was done using scenario analysis, where the base case follows the most consistent set of expectations from experts on EV adoption pace, grid storage tender activity, and expected price movement from chemistry mix changes. Each scenario was stress-tested by re-running the model with different paths for average selling prices, local supply tightness, and policy timing so that the five-year outlook stays explainable and repeatable.
Data Validation & Update Cycle
Validation is done in layers so that the final number is not dependent on one dataset or one assumption. Model outputs are compared with independent signals such as capacity announcements versus implied output, trade flow direction versus domestic supply commentary, and application-level demand markers, and then any large variance is reviewed before sign-off.
We also run anomaly checks on year-over-year jumps, technology share shifts, and implied pricing to confirm they align with what buyers and suppliers describe. If a major event changes demand or pricing (for example, a policy revision, a large plant ramp-up delay, or a sudden materials price move), the relevant assumptions are rechecked with fresh calls. Reports are refreshed annually, and an interim update is triggered when a material change would alter the market trajectory, followed by a final pre-delivery review so clients receive the latest updated view.
Mordor Intelligence's Japan Battery Market Size Compared Against Other Published Estimates
Published market values for batteries in Japan can look far apart because the scope is not always the same, and the pricing logic can be handled differently across studies. Differences also come from whether a study is counting only rechargeable chemistries, whether it includes pack-level value, and how quickly the model is refreshed when EV and storage programs change direction.
Key gap drivers usually show up in what is counted as a battery sale and when it is counted, followed by how average selling prices are projected as chemistry mix shifts over time. Some estimates lean on aggressive growth cases for EV and grid storage rollouts, while others apply conservative adoption curves and keep pricing flatter, which changes the revenue line even if unit volumes are similar. Currency timing and whether imports are treated as end-market consumption or as supply-side movement can also change the final market value.
Benchmark comparison
| Source | Market Size | Gaps in Research Methodology |
|---|---|---|
| Mordor Intelligence | USD 3.82 B (2025) | |
| Industry Publisher A | USD 9.00 B (2024) | This figure appears to focus on lithium-ion only and uses a broad cross-sector definition, which can inflate the total versus an all-battery view that also includes lower-value chemistries and is anchored to a single Japan end-market revenue boundary. |
| Specialist Research House B | USD 6.30 B (2026) | This estimate is positioned around advanced batteries and may include higher-value emerging chemistries and pack-level expansion assumptions, which typically lifts revenue relative to a model that keeps legacy primary and secondary categories in scope with more stable price progression. |
The table shows a wide spread, and under Mordor Intelligence's scope the total is built as Japan end-market battery revenue across primary and secondary types, rather than only lithium-ion or only advanced categories. Once the scope is aligned, the remaining differences mainly come from how fast EV and storage demand is assumed to ramp and how ASP changes are carried through the forecast. By keeping the steps traceable to demand pools, mix, and pricing checks that were revalidated in interviews, the result stays practical to audit and update when conditions change.


Key Questions Answered in the Report
What is the current value of the Japan battery market?
The Japan battery market size reached USD 3.99 billion in 2026.
How fast is the market expected to grow toward 2031?
Revenue is projected to rise to USD 4.91 billion by 2031, representing a 4.25% CAGR.
Which battery technology is expanding quickest?
Solid-state chemistries are advancing at a 19.8% CAGR as manufacturers seek higher energy density and safety.
Why are secondary batteries dominant in Japan?
Rechargeable formats deliver total-cost-of-ownership benefits once applications exceed 50 cycles, driving a 91.2% market share in 2025.
What risks could slow market expansion?
Heavy reliance on Chinese raw-material imports and consumer trust issues following safety recalls pose the greatest headwinds.
Which segment delivers the highest revenue contribution?
Automotive batteries accounted for 52.9% of 2025 revenue due to large pack sizes and rising export volumes.
Page last updated on:


 Your data is secure and never sold or shared.


