
Jakarta Data Center Market Size and Share
Market Overview
| Study Period | 2020 - 2032 |
|---|---|
| Forecast Data Period | 2026 - 2032 |
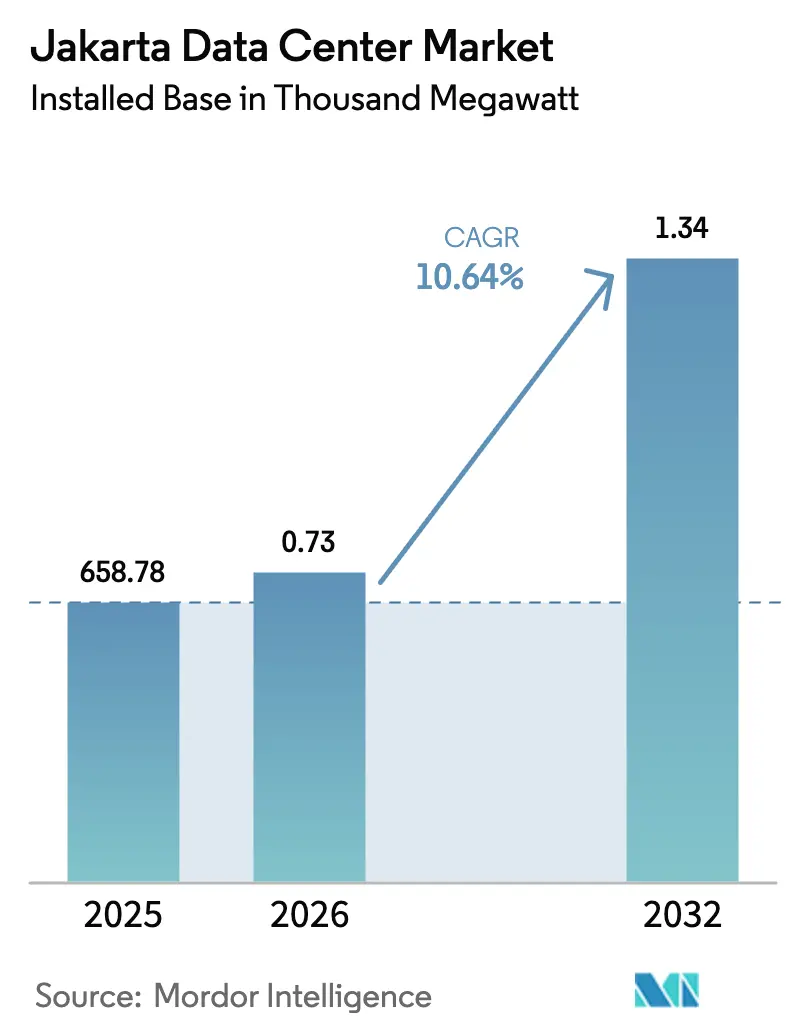
| Base Year Market Size (2025) | 658.78 Thousand megawatt |
| Market Volume (2026) | 0.73 Thousand megawatt |
| Market Volume (2032) | 1.34 Thousand megawatt |
| Growth Rate (2026 - 2032) | 10.64 % |
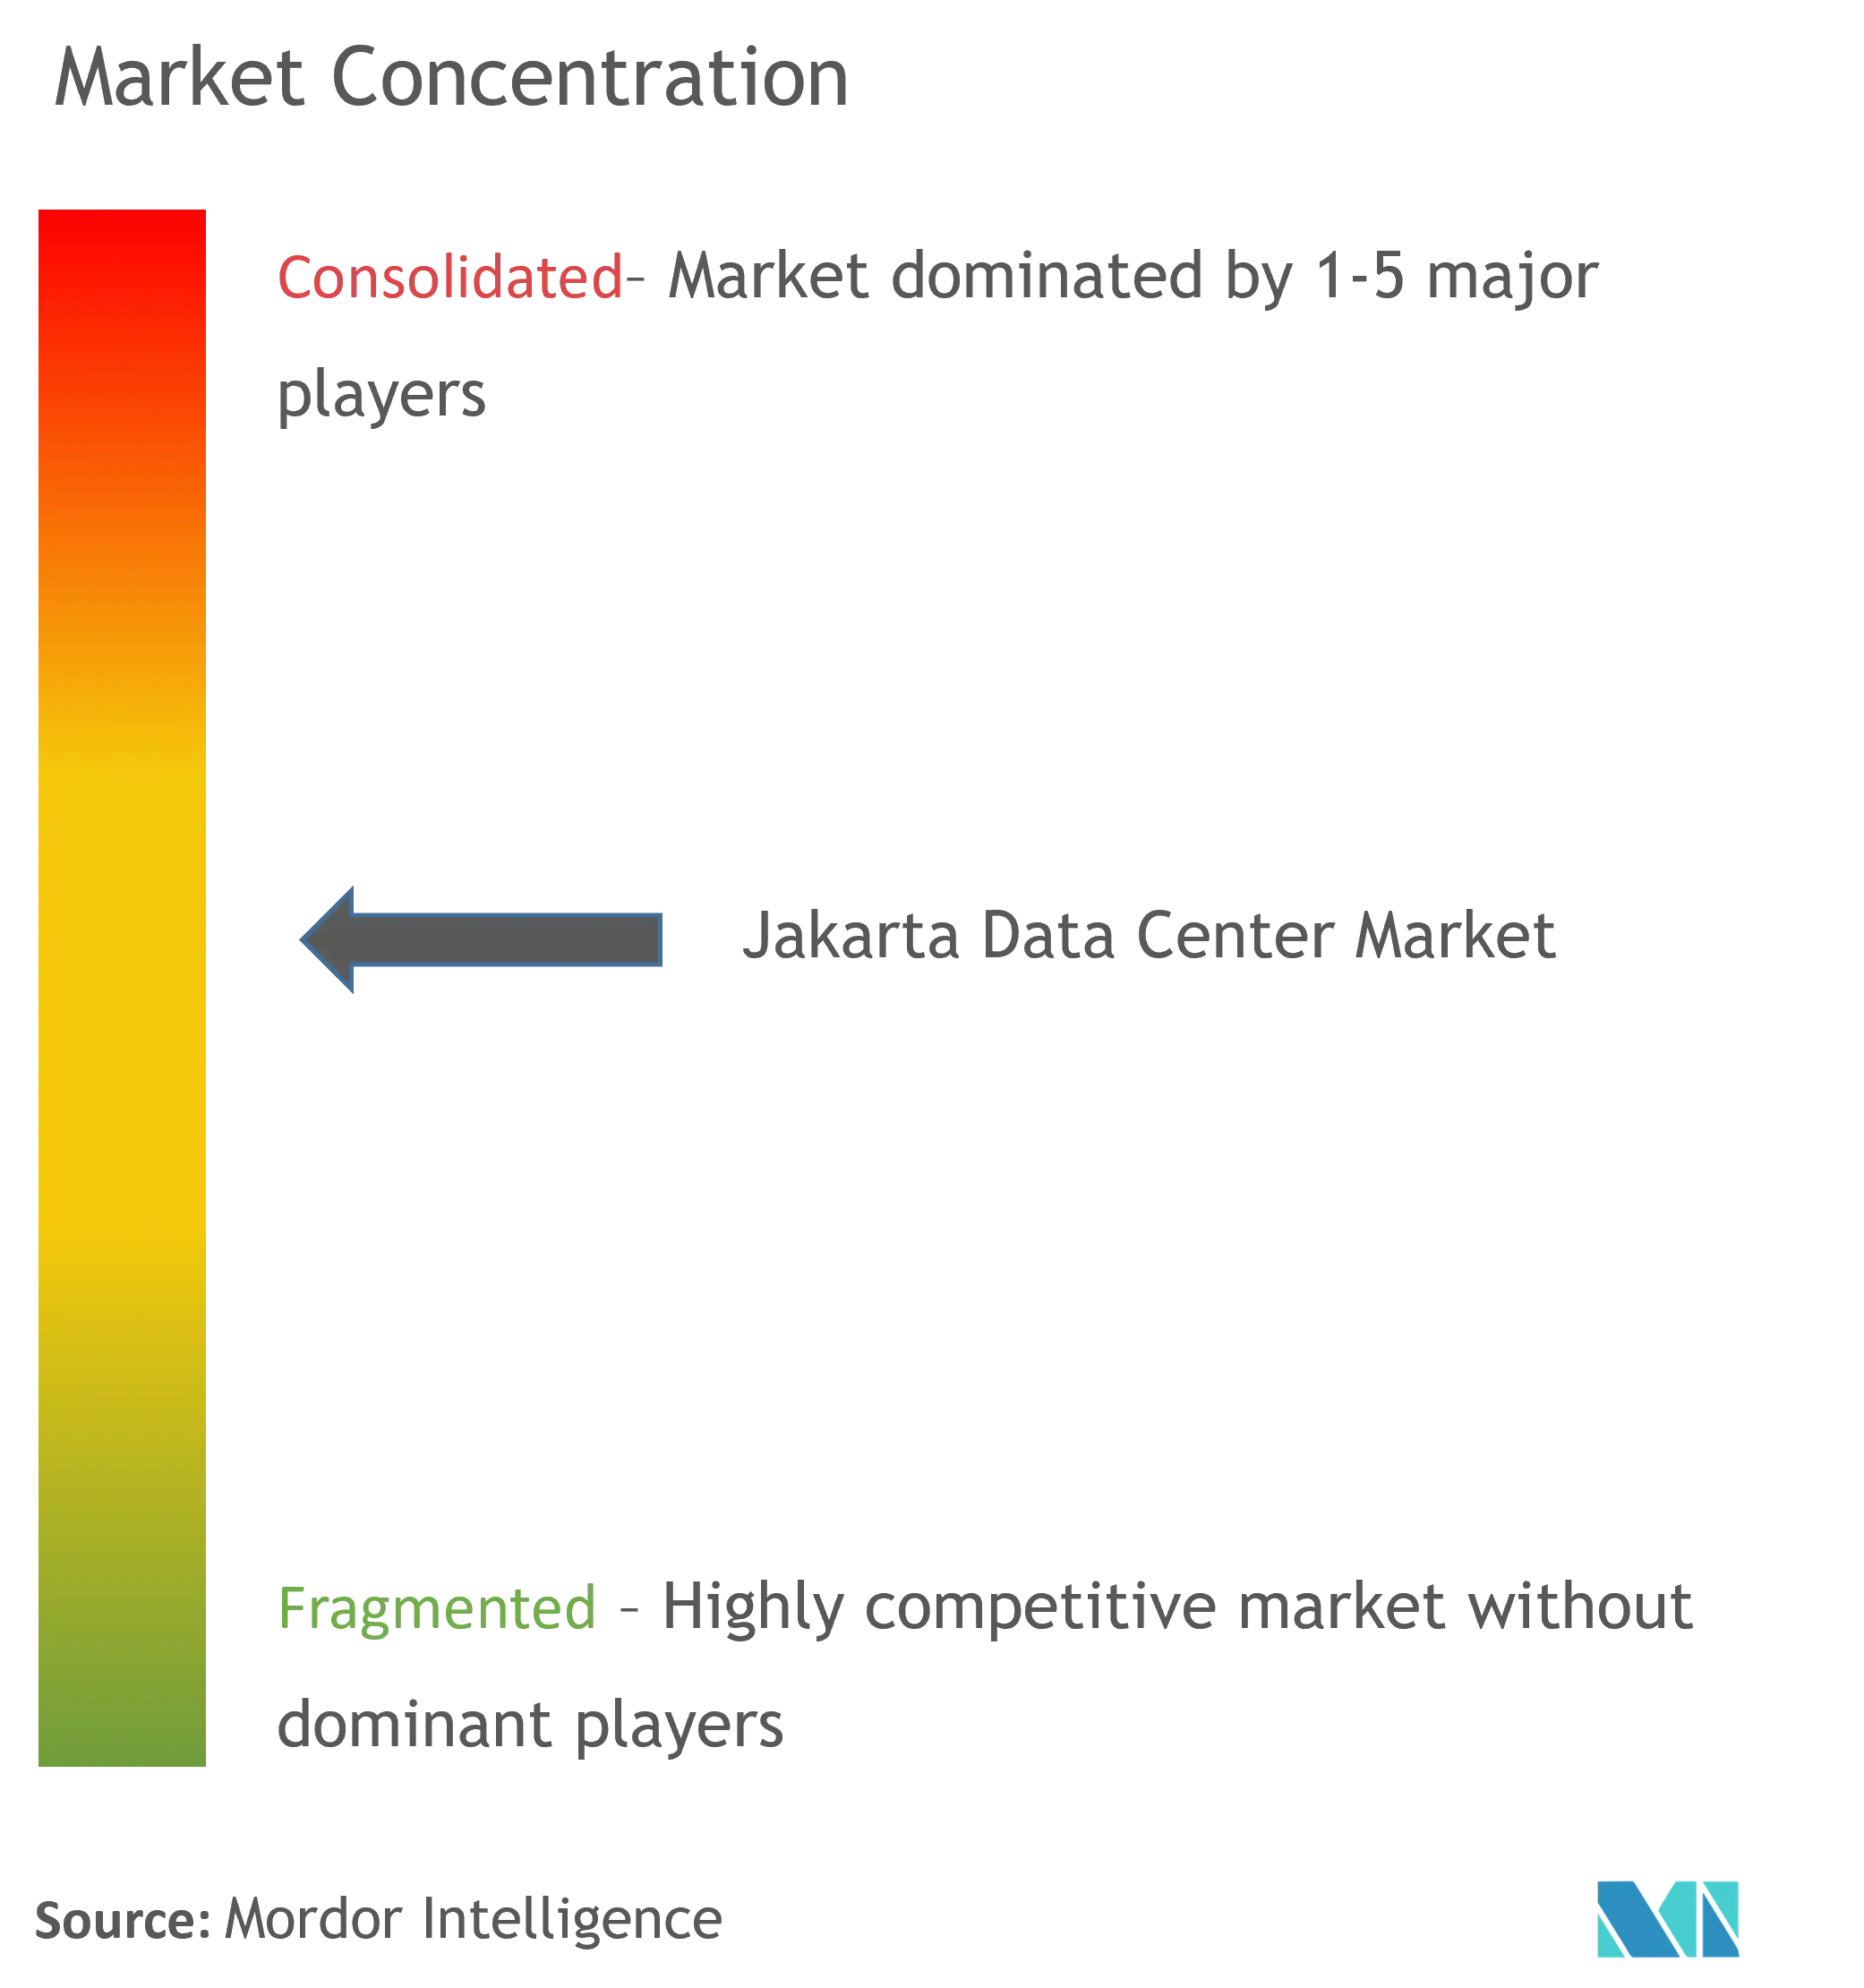
| Market Concentration | Medium |
Major Players *Disclaimer: Major Players sorted in no particular order Image © Mordor Intelligence. Reuse requires attribution under CC BY 4.0. | |
Jakarta Data Center Market Analysis by Mordor Intelligence
Jakarta data center market size in 2026 is estimated at 728.91 MW, growing from 2025 value of 658.78 MW with 2032 projections showing 1,336.09 MW, growing at 10.64% CAGR over 2026-2032. This upward curve underscores a robust market size outlook supported by hyperscale cloud investments, a deepening 5G footprint and Indonesia’s data-sovereignty agenda. Intensifying campus builds by hyperscale tenants, the APRICOT submarine cable system’s arrival, and aggressive green-energy power-purchase agreements are further accelerating demand. Competitive pressure is already pushing colocation rents down to USD 300-320 per kVA, yet operators remain attracted by the very low per-capita installed capacity that signals ample runway. The interplay of rapid e-commerce expansion, stringent financial-services latency requirements and expanding AI workloads positions the Jakarta data center market for sustained double-digit growth.
Key Report Takeaways
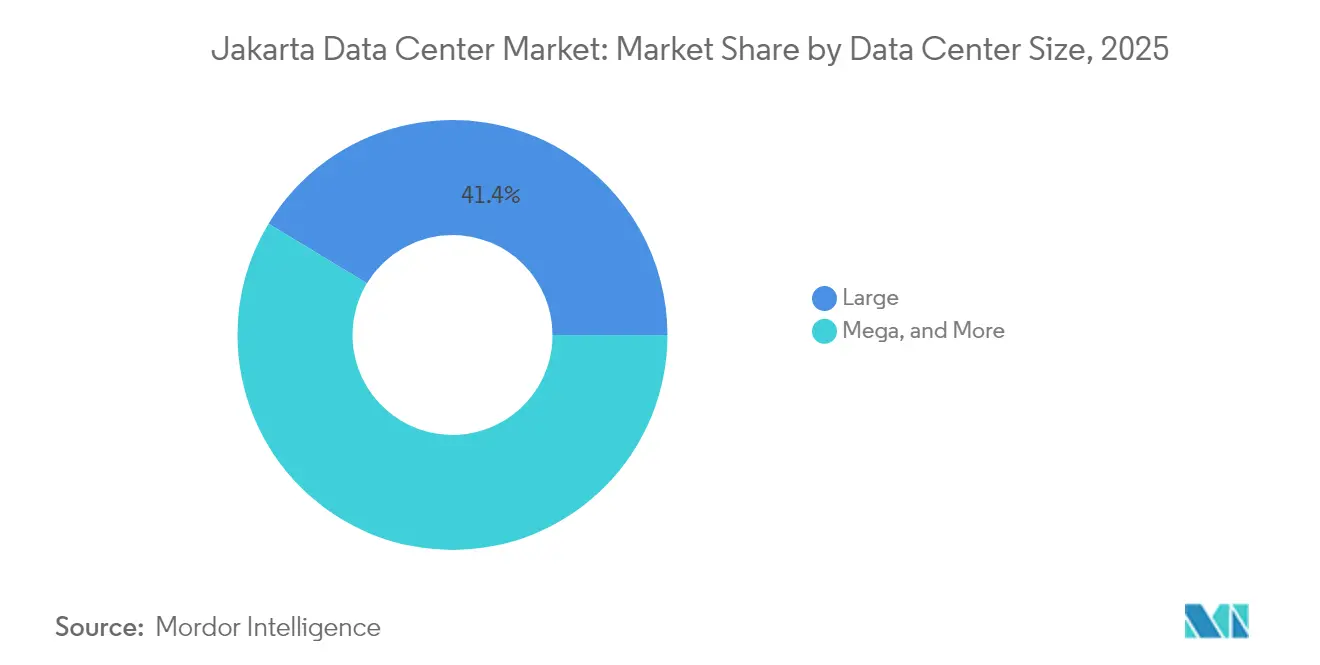
- By data center size, large facilities led with 41.35% revenue share in 2025, while mega facilities are advancing at a 20.35% CAGR through 2032.
- By tier standard, Tier III infrastructure held a 50.25% share of the Jakarta data center market size in 2025 and Tier IV deployments are growing at an 17.60% CAGR to 2032.
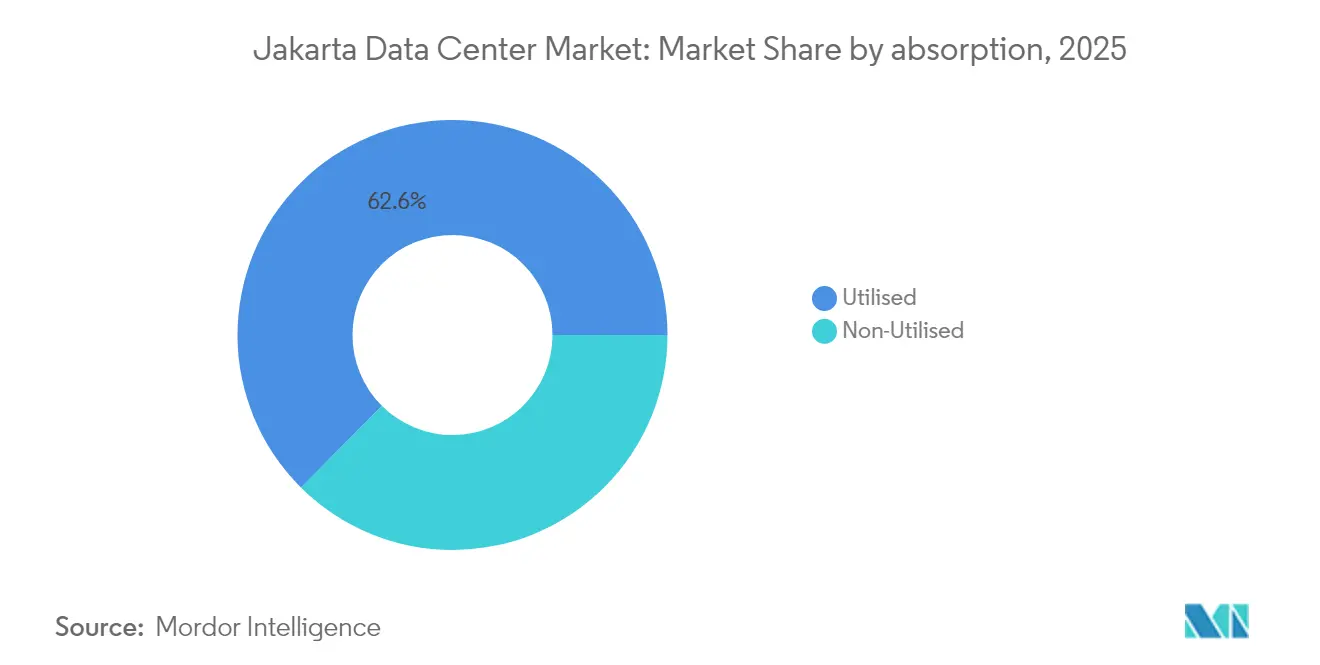
- By absorption, utilised capacity represented 62.55% of the Jakarta data center market share in 2025; hyperscale colocation is expanding at a 23.85% CAGR through 2032.
- By hotspot, Greater Jakarta accounted for 51.20% share in 2025, whereas the Bekasi-Cikarang Corridor is set to grow at a 12.94% CAGR between 2026-2032.
Note: Market size and forecast figures in this report are generated using Mordor Intelligence’s proprietary estimation framework, updated with the latest available data and insights as of 2026.
Jakarta Data Center Market Trends and Insights
Drivers Impact Analysis*
| Driver | (~) % Impact on CAGR Forecast | Geographic Relevance | Impact Timeline |
|---|---|---|---|
| Exploding mobile-data consumption and 5G roll-out | +2.80% | Greater Jakarta, Bekasi-Cikarang Corridor | Medium term (2-4 years) |
| E-commerce and fintech boom requiring low-latency hosting | +2.10% | Greater Jakarta, Rest of Jakarta | Short term (≤ 2 years) |
| Government "Making Indonesia 4.0" and data-sovereignty push | +1.90% | National, with concentration in Greater Jakarta | Long term (≥ 4 years) |
| Influx of hyperscale cloud providers driving campus builds | +3.20% | Bekasi-Cikarang Corridor, Greater Jakarta | Medium term (2-4 years) |
| Rapid build-out of new submarine-cable landings | +1.40% | Greater Jakarta, Bekasi-Cikarang Corridor | Long term (≥ 4 years) |
| Green-energy PPAs to meet net-zero mandates unlocking permits | +0.80% | National, early adoption in Greater Jakarta | Long term (≥ 4 years) |
| Source: Mordor Intelligence | |||
Exploding mobile-data consumption and 5G roll-out
Indonesia’s 5G coverage accelerated in 2024, lifting total mobile data traffic by 9% to 17.9 million TB. The surge forces content and application providers to house workloads closer to end users, which in turn raises demand for low-latency edge nodes across the Jakarta data center market[1]. IoT devices tied to Industry 4.0 programs are projected to contribute IDR 1,620 trillion in value by 2025, deepening the requirement for distributed processing capacity that centralized data centers cannot efficiently meet. As latency-sensitive services such as augmented-reality commerce and autonomous logistics mature, operators are prioritizing micro-modules inside dense urban footprints. These deployments improve user experience, reduce network backhaul and underpin sustained rack-fill rates. The trend also drives capital toward liquid-cooling and direct-to-chip technologies that fit high-density 5G edge environments.
E-commerce and fintech boom requiring low-latency hosting
Jakarta remains Southeast Asia’s largest e-commerce hub, and the region’s transaction-heavy platforms require resilient, latency-optimized data centers. Tokopedia reported a 10× smarter search capability after deploying vector search on AI-ready infrastructure, a result that highlights the commercial upside of high-performance hosting [2]. Financial players follow suit: DOKU’s disaster-recovery configuration on Alibaba Cloud cut operating costs by 20% while safeguarding compliance with Bank Indonesia regulations. With online-payment velocity rising, colocation providers offering <2 ms round-trip latency can command premium pricing even as the broader Jakarta data center market faces rental compression. The stickiness of fintech workloads, combined with regulatory scrutiny, yields predictable occupancy and serves as a hedge against cyclical demand shifts.
Making Indonesia 4.0 and the data-sovereignty push
The government’s consolidation of 2,700 legacy facilities into a handful of national data centers is reinventing public-sector IT architecture. The flagship PDN campus in Cikarang brings 25,000 CPU cores, 40 PB of storage and 20 MW of power, underpinned by EUR 164 million in state-backed financing [3].Mandatory on-shore data residency for personal information compels multinationals to localize storage, shifting workloads out of Singapore and into the Jakarta data center market. The regulation is fostering captive demand that decouples from price competition because compliance risk outweighs hosting cost. Over the long term, the national AI strategy embeds data centers into every e-government service, anchoring sustained utilization regardless of private-sector cycles.
Influx of hyperscale cloud providers driving campus builds
Microsoft, Temasek and BlackRock have earmarked USD 30 billion for the 480 MW Project MGX hyperscale campus, signalling Jakarta’s graduation to a first-tier cloud region. Digital Realty and Bersama’s CGK11 site illustrates the new norm: starting at 5 MW, scaling rapidly to 32 MW through modular blocks. Hyperscalers demand standardized designs and end-to-end automation, forcing local incumbents to upgrade their facilities or partner for scale. The corridor east of Jakarta offers large contiguous land parcels and 150 kV grid feeds, which underpin dual-feed architectures vital to these giant deployments. As campuses expand, ecosystem participants ranging from chillers to network fabrics enjoy a multiplier effect, reinforcing the Jakarta data center market’s growth flywheel.
Restraints Impact Analysis*
| Restraint | (~) % Impact on CAGR Forecast | Geographic Relevance | Impact Timeline |
|---|---|---|---|
| High electricity tariffs and grid congestion in Greater Jakarta | -1.80% | Greater Jakarta, Rest of Jakarta | Short term (≤ 2 years) |
| Land scarcity and zoning limits for large-footprint campuses | -1.20% | Greater Jakarta, moderate impact in Bekasi-Cikarang | Medium term (2-4 years) |
| Seismic and flood-risk premiums raising insurance/financing costs | -0.90% | Greater Jakarta, Rest of Jakarta | Long term (≥ 4 years) |
| Water-use restrictions for liquid-cooling in urban districts | -0.70% | Greater Jakarta, emerging in Bekasi-Cikarang | Medium term (2-4 years) |
| Source: Mordor Intelligence | |||
High electricity tariffs and grid congestion in Greater Jakarta
PLN’s 2025 tariff schedule ranges from IDR 996.74 to IDR 1,699.53 per kWh for commercial accounts, inflating opex at a time when colocation prices are falling[4]. The 67% share of coal in the power mix complicates renewables procurement, a key requirement for global cloud clients pursuing net-zero mandates. Grid bottlenecks delay energization dates, forcing developers to install larger diesel reserves and on-site battery systems, raising capex by 5%. Cushman & Wakefield ranks Jakarta the fourth most expensive data center construction market in Asia Pacific, evidence of combined power and labor cost pressures. These headwinds are steering future builds toward the Bekasi-Cikarang Corridor, where high-voltage feeders and industrial zoning streamline connections.
Land scarcity and zoning limits for large-footprint campuses
Urban densification has squeezed Jakarta’s supply of 10+ acre plots needed for next-gen campuses. North Jakarta Bay reclamation lifted land prices to match central-city benchmarks, eroding cost advantages. Height and power-density restrictions in many districts cap deployable IT load, challenging the economics of AI-ready halls that exceed 30 kW per rack. Environmental clearances now stretch 12-18 months, affecting project IRRs and pushing operators toward pre-zoned industrial parks east of the city. These hurdles elevate barriers to entry, favoring incumbent players with local joint-venture partners and deep permitting experience.
*Our forecasts treat driver/restraint impacts as directional, not additive. The impact forecasts reflect baseline growth, mix effects, and variable interactions.
Segment Analysis
By Data Center Size: Mega builds set the new scale benchmark
Mega facilities are rewriting the Jakarta data center market’s economics. While large sites still held the highest 2025 share at 41.35%, mega campuses are sprinting ahead at a 20.35% CAGR. That pace reflects cloud providers’ need for contiguous 20 MW blocks, standardized white space and economies of scale that shrink per-MW opex. The Jakarta data center market size attributed to mega builds is poised to more than double from 2026-2032 as AI workloads favor high-density designs.
Automation, integrated liquid-cooling and onsite sub-station builds help mega sites achieve PUE figures below 1.35. Massive facilities remain an emerging niche aligned with sovereign AI projects such as the Cikarang PDN, but the underpinning technology—immersion cooling and 100 GbE fabrics—will filter into mega campuses first. Medium and small formats retain relevance by enabling densified edge nodes for 5G and IoT deployments close to user clusters.

By Tier Standard: Tier IV certifications gain speed
Tier III still commands 50.25% of deployed power because it meets most enterprise uptime mandates without a steep cost premium. Yet the Jakarta data center market size accredited as Tier IV is projected to expand faster than any other standard, registering an 17.60% CAGR through 2032. AI inferencing clusters and real-time fintech workloads cannot tolerate scheduled downtime, pushing builders toward concurrently maintainable and fault-tolerant designs.
Dual-grid feeds, 2N+1 power architectures and ISO 14001 water-recycling systems are now baseline requirements for top-tier customers. Uptime Institute audits provide a competitive differentiator for colocation brands in bidding rounds with regulated sectors, especially banks. Tier I-II capacity remains confined to edge and content-delivery nodes where cost outweighs the benefit of extra redundancy.
By Absorption: Hyperscale colocation reshapes utilization
Utilised halls represented 62.55% of active power in 2025, reflecting healthy take-up across Jakarta’s prime campuses. Within that footprint, hyperscale cages are driving a 23.85% CAGR, eclipsing retail colocation growth as cloud providers pursue regional availability zones. The Jakarta data center market share commanded by hyperscale tenants is expected to pass the 50% mark before 2030 as multi-MW pre-commitments dominate leasing pipelines.
Non-utilised capacity remains a strategic buffer that allows operators to sign rapid-turnaround bookings without adding shell space. To maximize yield, data center landlords are deploying AI-based capacity-planning engines that rebalance power, cooling and space allocations across wholesale and retail cohorts. Edge-focused operators supplement hyperscale-centric portfolios to capture diversified revenue streams.
Geography Analysis
Greater Jakarta’s legacy connectivity and dense enterprise base gave it a 51.20% share in 2025, but land scarcity and tariff premiums are redirecting new capex toward Bekasi-Cikarang. The corridor’s 12.94% CAGR is supported by 150 kV grid links, industrial water rights and immediate proximity to landing stations for the 190 Tbps APRICOT cable.
Developers leverage lower land costs to build horizontally oriented, single-story halls that improve airflow and ease equipment logistics. Meanwhile, the rest of Jakarta hosts disaster-recovery and government-sector nodes that value geographic separation from the core business district. That mixed footprint increases resiliency across the broader Jakarta data center market.
Greater Jakarta remains the epicenter of Indonesia’s digital economy. Financial institutions and cloud-first start-ups need the sub-2 ms latency only metro-core facilities can guarantee, enabling sticky demand even as land prices climb. Equinix’s JK1 downtown site anchors peering with more than 50 carriers and validates the high-density interconnection model that underpins metro resilience.
Regulatory Landscape
Indonesia positions data centers as strategic infrastructure through Presidential Regulation No. 82 of 2022, which designates the ICT sector as strategic and classifies data centers as Vital Information Infrastructure (VII). Cybersecurity governance for VII entities is anchored by the National Cyber and Crypto Agency (BSSN), shaping requirements for risk-based controls and incident readiness that influence design, audit, and operational practices for Jakarta facilities serving regulated and public-sector workloads.
Compliance also extends to how Electronic System Providers (PSE) use third-party cloud services. Ministry of Communication and Digital (Komdigi) Regulation No. 5 of 2025 introduced risk-based data classification obligations for public-scope PSEs that rely on external cloud, reinforcing data handling and assurance expectations for providers hosting sensitive workloads. On the delivery side, permitting remains multi-agency and utility linked, typically involving Komdigi, the Ministry of Trade, the Ministry of Environment and Forestry, and PLN for grid connection, which keeps schedule risk tied to coordination across these bodies.
Value Chain Analysis
The Jakarta data center value chain begins with land and site assembly, moves into design and build (civil works, power and cooling systems), and then shifts to commissioning and operations (facility management, security, maintenance, and uptime management). Power access and energization are a core dependency, with PLN as the central counterparty for grid connection and capacity allocation. Sustainability constraints are also pushing more projects to formalize green-energy procurement and efficiency measures within customer contracting.
At the ecosystem level, the Indonesia Data Center Provider Organization (IDPRO) coordinates across operators, suppliers, and enterprise users. Operator scale and financing capacity increasingly affect upstream procurement and downstream go-to-market. PT DCI Indonesia Tbk is cited with 128 MW of platform capacity across campuses in Cibitung (H1), Karawang (H2), South Jakarta (E1), and Surabaya (E2), and it secured a 17 trillion rupiah investment credit facility from Bank Central Asia in 2026 to fund expansion capex. This type of balance-sheet access influences equipment sourcing, substation buildouts, and the ability to offer multi-MW blocks aligned with hyperscale and government consolidation demand.
Competitive Landscape
Intense price competition is compressing rents as new supply arrives. Conglomerates with diversified cash flows can price aggressively, prompting average colocation rates to fall to USD 300-320 per kVA in early 2025. Despite downward pressure, the Jakarta data center market continues to register new entrants because demand growth outstrips supply. Telkom Indonesia leverages a 32-site domestic network to upsell sovereign clients, while Digital Realty and Equinix rely on global ecosystems to court multinationals.
Technology leadership is pivotal. NeutraDC’s 2024 agreement with PLN secures preferential power allocation, strengthening its AI-ready positioning. EdgeConneX scales beyond 200 MW via modular block design that cuts deployment time to nine months, giving it speed-to-market advantage. Smaller incumbents often pivot toward edge and managed-service niches, or partner with foreign investors to fund capex.
M&A momentum is set to continue as capital-intensive mega projects strain balance sheets of standalone operators. Cross-border funds, regional telcos and infrastructure REITs view the Jakarta data center market as strategic, ensuring competitive tension that ultimately benefits end-users via better pricing and richer connectivity ecosystems.
Jakarta Data Center Industry Leaders
-
PT DCI Indonesia
-
Telkomsigma
-
NTT Communications Corporation
-
XL Axiata Tbk PT (Princeton Digital Group)
-
GTN Data Center (Edge Connex)
- *Disclaimer: Major Players sorted in no particular order
Market Opportunities and Future Outlook
Public-sector modernization is creating a defined procurement lane for commercial operators. Under the ecosystem-based National Data Center (PDN) policy (Ministerial Decision 519 of 2024), the government opened storage and processing of government data to private-sector providers. This expands addressable demand beyond purely captive state facilities and increases the value of compliance-ready, Jakarta-region capacity that can meet sovereign and cybersecurity controls.
A second opportunity comes from geographic rebalancing of Indonesia's digital infrastructure, with Komdigi executing a master plan to expand data center development into Eastern Indonesia. For Jakarta operators and suppliers, this creates whitespace for interconnection, managed services, and multi-site architectures linking Greater Jakarta and the Bekasi-Cikarang corridor to secondary nodes, while still anchoring latency-sensitive workloads in the capital region. Company actions show how the shift is taking shape: DCI Indonesia inaugurated the 9 MW E2 Surabaya facility in April 2026 and is developing the DCI Hyperscale 3 Sky (H3) campus in Bintan, Riau Islands, with a design capacity exceeding 1,000 MW. This indicates that Jakarta-centered platforms are extending into new Indonesian geographies, which can feed back into Jakarta demand for cloud on-ramps and disaster recovery.
Recent Industry Developments
- July 2026: LG Sinar Mas topped out SMX01 data center in Jakarta, 6MW phase one capacity scheduled for Q4 2026. The expansion increases Jakarta's near term available capacity to support AI and edge workloads. The project strengthens the company's position in the rapid demand growth for scalable colocation in the market.
- June 2026: ST Telemedia Global Data Centres (STT GDC) launched STT Jakarta 2, topped out STT Jakarta 3, and groundbreaking of STT Jakarta 5 and 6. The campus expansions deepen the Jakarta metro footprint and accelerate hyperscale deployment. The capacity additions reinforce STT GDC's pace to capture growing demand from hyperscale and enterprise users.
- May 2026: Princeton Digital Group (PDG) secured US$856 million financing to develop its 120MW JC3 data center campus in Jakarta. The financing enables a large scale capacity ramp to address rising hyperscale demand. The investment strengthens PDG's ability to accelerate project delivery and capture Jakarta market opportunities.
Research Methodology Framework and Report Scope
Market Definition and Coverage
This market measures the installed and expected IT power capacity of data centers located in Jakarta, expressed in MW. It covers capacity that is currently live, being built, or planned, as long as it can be attributed to facilities serving compute and storage workloads in the city.
Scope exclusions: we exclude edge rooms inside offices and factories, telecom tower sites, and non-data-center power equipment spending that is not directly tied to data hall IT load.
Segmentation Overview
- By Data Center Size
- Small
- Medium
- Large
- Mega
- Massive
- By Tier Standard
- Tier I and II
- Tier III
- Tier IV
- By Absorption
- Non-Utilised
- Utilised
- By Colocation Type
- Hyperscale
- Retail
- Wholesale
- By End-User Industry
- BFSI
- Cloud Service Providers
- E-Commerce
- Government
- Manufacturing
- Media and Entertainment
- Telecom
- Other End Users
- By Colocation Type
- By Hotspot
- Greater Jakarta
- Bekasi - Cikarang Corridor
- Rest of Jakarta
Data Sources, Market Sizing, and Validation
Desk Research
Desk research set the base model structure by mapping Jakarta supply signals, demand indicators, and policy conditions that shape buildouts. We referenced public sources such as Statistics Indonesia (BPS), the Ministry of Communication and Digital, PLN electricity updates, and BKPM investment announcements to understand the direction of digital infrastructure and grid readiness.
To ground capacity and timing, we also reviewed sources such as official connectivity and spectrum notes from regulators, industry association portals covering data center and telecom infrastructure, and reputable press coverage of new campuses and commissioning milestones. Where company-level capacity, openings, or expansion timing were unclear, we complemented the public trail with paid subscriptions used for company financials and intelligence, plus a patent database to track cooling and power design themes. These desk sources are illustrative only, and we checked other public documents and datasets to collect, cross-verify, and clarify assumptions.
Primary Interviews and Surveys
Interviews and surveys with data center operators, infrastructure suppliers, cloud and colocation specialists, and enterprise technology leaders in Indonesia help clarify secondary capacity figures, utilization levels, commissioning dates, gaps in public disclosures, and the assumptions used for the Jakarta estimate.
Distribution of primary research fieldwork respondents
| Company type | Respondent position |
|---|---|
| Top tier: 28% | CXOs: 20% |
| Mid tier: 47% | Functional/Unit leaders: 30% |
| Smaller Players: 25% | Managers: 50% |
Market-Sizing & Forecasting
The core sizing uses a top-down approach where city level capacity is reconstructed from facility counts, announced MW per site, commissioning timelines, and utilization patterns that were validated in interviews. We then apply selective bottom-up checks by sampling MW additions by hotspot, and converting those into implied absorption using typical rack density and expected take-up to confirm the implied pace stays realistic.
Inputs that influenced the model included reported and inferred IT load per new hall, the pace of pre-commitments for colocation space, Tier III and Tier IV build preference, typical power density shifts (including higher density for AI-ready deployments), and local constraints such as grid allocation timing and land availability. When some facilities did not disclose MW, we used comparable site profiles (floor space, tier, and target customers) to fill the gaps, then adjusted using primary feedback on achievable design loads. For forecasting, we ran scenario analysis based on expert views on delivery risk, demand timing, and price pressure, and selected the final path when implied MW additions matched Jakarta pipeline realism and absorption pacing.
Data Validation & Update Cycle
Validation uses several checks so the MW totals stay aligned with real market signals. Outputs are compared against independent indicators such as commissioning announcements, major lease wins, power connection readiness, and observed utilization changes. Any sharp variance triggers a re-check of assumptions and targeted re-contact with sources.
Before sign-off, a second analyst review challenges outliers at hotspot and tier level, and confirms that year-on-year changes track with known construction lead times. The report is refreshed annually, with interim updates when material events occur, such as large new campuses, delays, or power policy shifts. Right before delivery, a final pass is completed so clients receive the latest view available at that time.
Mordor Intelligence's Jakarta Data Center Market Size Versus Other Published Estimates
Published market estimates for Jakarta data centers do not always align because they are often based on different units, different scope choices, and different timing assumptions. Some sources size only revenue from colocation services, and others focus on pipeline capacity instead of commissioned and usable IT load.
Key gap drivers in this market usually come down to whether the estimate counts only multi-tenant colocation demand, whether it mixes planned capacity with delivered capacity, and how it translates facility announcements into MW that can actually be energized. One set of figures is often presented in USD and tied to rent and occupancy assumptions, while another is presented in MW and tied to delivered halls and absorption. Some estimates focus only on colocation revenue, and Mordor Intelligence limits the market to IT load capacity in MW (including utilized and non-utilized capacity) rather than converting the same demand pool into USD value.
Benchmark comparison
| Source | Market Size | Gaps in Research Methodology |
|---|---|---|
| Mordor Intelligence | USD 0.66 T (2025) | |
| Trade Publication A | USD 507.20 M (2025) | This figure is framed as a Jakarta colocation market value in USD, which can exclude enterprise self-build capacity and will move with pricing and occupancy assumptions rather than MW additions. |
| Real Estate Advisory B | USD 0.71 T (2025) | This figure reflects the total development pipeline in MW (under-construction plus planned), which can overstate near-term deliverable capacity if commissioning and power-connection timing are not filtered. |
The comparison shows that the biggest differences come from unit choice (USD value versus MW) and from whether planned projects are treated as committed supply. By keeping the sizing anchored to site level capacity additions, utilization progression, and delivery timing checks, we can present a market view that is easier to replicate and easier to reconcile against real commissioning milestones.
Key Questions Answered in the Report
How fast is capacity growing in Jakarta’s colocation space?
Installed IT load is projected to rise from 728.91 MW in 2026 to 1,336.09 MW by 2032, implying a 10.64% CAGR.
Which district is attracting most greenfield builds?
The Bekasi-Cikarang Corridor is the fastest-growing hotspot, set to expand at a 12.94% CAGR thanks to cheaper land, grid headroom and new submarine-cable landings.
What share of power is already committed to tenants?
Utilised halls account for 62.55% of active capacity, with hyperscale colocation driving a 23.85% CAGR in take-up.
Why are Tier IV certifications gaining traction?
AI workloads and financial-services applications require near-continuous uptime, pushing Tier IV deployments to grow at an 17.60% CAGR through 2032.
How are rental rates trending?
Intense competition has reduced average colocation pricing to USD 300-320 per kVA even as construction costs rise, suggesting continued buyer advantage.
What makes Jakarta attractive for hyperscale cloud providers?
Proximity to a 275 million-person domestic market, data-sovereignty rules, new 190 Tbps submarine cables and available industrial sites east of the city combine to form a compelling hyperscale proposition.
- Artificial Intelligence (AI) Data Center Market AI facilities worldwide, split by facility type, component and tier.
- Data Center Power Market Power systems across all regions, split by component, tier and facility size.
- Data Center Construction Market Global construction demand, split by tier, facility size and facility type.
- Indonesia Data Center Power Market Power systems in Indonesia, split by component, facility type and facility size.
- Indonesia Hyperscale Data Center Market Indonesia hyperscale sites, split by facility type, component and tier.
- Indonesia Data Center Server Market Servers demand across Indonesia, covering facility size and tier.
- Philippines Data Center Construction Market Construction in the Philippines, split by facility size and tier.
- Indonesia Data Center Cooling Market Cooling demand across Indonesia, covering cooling technology, type and end-user vertical.
- AI Data Center GPU Market AI accelerators across the global market, covering deployment mode, gpu type and interconnect.
- Indonesia Data Center Physical Security Market Physical security demand across Indonesia, covering solution type and service type.
- Indonesia Data Center Processor Market Indonesia's processors, split by processor type, application and architecture.
- Philippines Data Center Power Market Power systems in the Philippines, split by component, facility type and facility size.