
Market Overview
| Study Period | 2021 - 2031 |
|---|---|
| Forecast Data Period | 2026 - 2031 |
| Base Year Market Size (2025) | 13.33 gigawatt |
| Market Volume (2026) | 13.73 gigawatt |
| Market Volume (2031) | 15.94 gigawatt |
| Growth Rate (2026 - 2031) | 3.02 % |
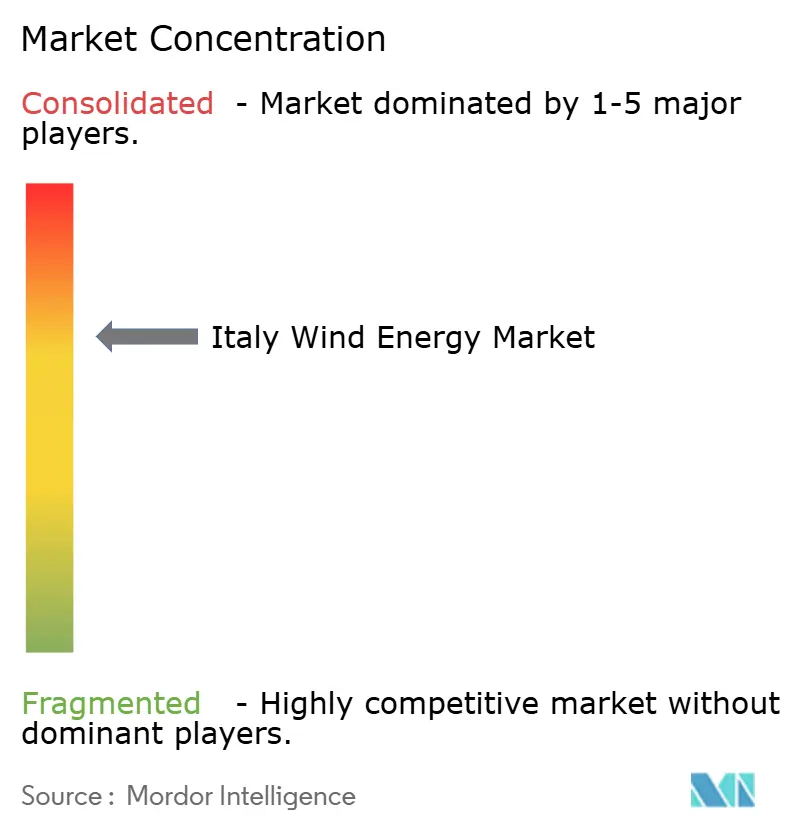
| Market Concentration | Medium |
Major Players *Disclaimer: Major Players sorted in no particular order Image © Mordor Intelligence. Reuse requires attribution under CC BY 4.0. | |
Italy Wind Energy Market Analysis by Mordor Intelligence
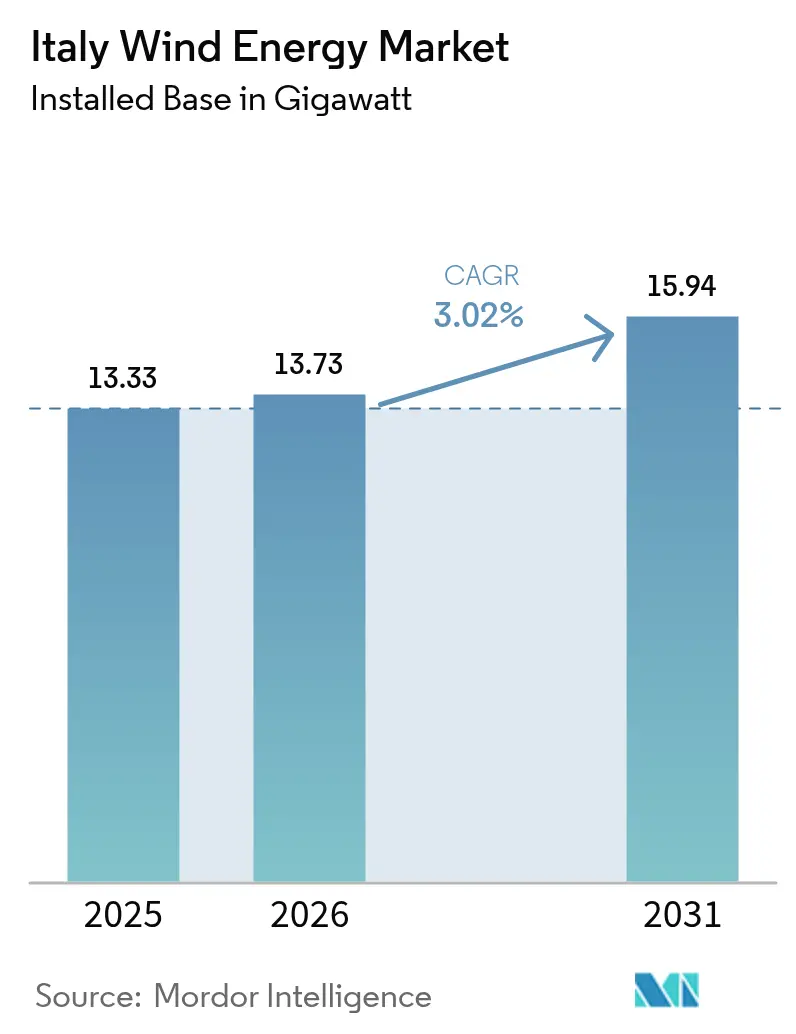
The Italy Wind Energy Market size in terms of installed base is expected to grow from 13.33 gigawatt in 2025 to 13.73 gigawatt in 2026 and is forecast to reach 15.94 gigawatt by 2031 at 3.02% CAGR over 2026-2031.
The expansion is shaped by floating offshore technologies that unlock the country’s deep-water Mediterranean resource, a dense pipeline of more than 100 GW of grid connection requests, and supportive auction frameworks that lower revenue risk through two-way contracts for difference. Grid-digitalization investments by Terna and the European Commission’s multi-billion-euro recovery funds further improve integration prospects and financing visibility. At the same time, local permitting reforms shorten approval cycles, while corporate power-purchase agreements (PPAs) from steel, chemicals, and automotive players add predictable offtake demand. Rising commodity prices and supply-chain inflation create cost headwinds that temper near-term capacity additions, yet these challenges are partly offset by repowering programs that replace aging turbines with higher-capacity units.
Key Report Takeaways
- By location, onshore installations accounted for 99.78% of Italy's wind energy market share in 2025; offshore capacity is projected to advance at a 71.6% CAGR through 2031.
- By turbine capacity, platforms with a capacity above 6 MW captured 18.60% of the growth in Italy's wind energy market size between 2025 and 2031, making them the fastest-expanding class.
- By application, utility-scale projects commanded 89.95% of Italy's wind energy market share in 2025, while commercial and industrial systems are forecast to expand at a 12.2% CAGR to 2031.
- By company, Enel Green Power, ERG, and Edison collectively accounted for nearly 44.6% of 2025 installed capacity within the Italy wind energy market.
Note: Market size and forecast figures in this report are generated using Mordor Intelligence’s proprietary estimation framework, updated with the latest available data and insights as of 2026.
Italy Wind Energy Market Trends and Insights
Drivers Impact Analysis*
| Driver | (~) % Impact on CAGR Forecast | Geographic Relevance | Impact Timeline |
|---|---|---|---|
| Renewable-energy auction pipeline expansion | +0.8% | National, concentrated in Southern Italy and Sicily | Medium term (2-4 years) |
| NECP-aligned permitting reform momentum | +0.6% | National, with early gains in Emilia-Romagna, Puglia | Short term (≤ 2 years) |
| Corporate-PPA pull from hard-to-abate industries | +0.4% | Northern Italy industrial corridors, Lombardy, Veneto | Medium term (2-4 years) |
| Floating-offshore wind resource unlock | +0.9% | Mediterranean coastal regions, Sardinia, Sicily, Puglia | Long term (≥ 4 years) |
| Grid-digitalization & storage synergy | +0.5% | National | Medium term (2-4 years) |
| EU regulatory support and funding mechanisms | +0.7% | National | Short term (≤ 2 years) |
| Source: Mordor Intelligence | |||
Renewable‐energy auction pipeline expansion
Italy’s FER2 decree establishes two-way CfDs with a EUR 185/MWh (USD 199.8/MWh) strike price for offshore wind, eliminating merchant revenue uncertainty and facilitating project debt financing. The European Commission approved a EUR 35.5 billion (USD 38.3 billion) scheme spanning 2028 that encompasses 4.59 GW of new renewable capacity, including gigawatt-scale floating projects in the Adriatic and Ionian Seas.[1] Environmental approvals for Agnes-1-2 (700 MW) and Energia Wind 2020 (330 MW) show the funnel converting from intent to shovel-ready status, with late-2024 auctions moving projects toward 2025-2026 construction starts
NECP-aligned permitting reform momentum
Legislative Decree 190/2024 and the Testo Unico Rinnovabili introduce a single-window system and standardized environmental assessments, trimming the average approval cycle from fourteen to under five years.[2] The Energy Release 2.0 measure accelerates grid-connection procedures, while a presumption of overriding public interest limits legal challenges. Adoption of maritime spatial plans in October 2024 finally brings certainty to offshore zone delimitation.
Corporate-PPA pull from hard-to-abate industries
Italian steelmakers, chemical refineries, and automotive suppliers increasingly lock into 10- to 15-year renewable PPAs to hedge wholesale price volatility and meet Scope 2 targets. Recent deals include Iberdrola–Acciaierie Venete and Eni Plenitude–Autostrade per l’Italia, which support bankability for mid-sized onshore projects in Basilicata and Veneto. ETS carbon-price escalation and CSRD reporting rules widen the value gap between grid-average and zero-carbon power, accelerating industrial renewable procurement.
Floating-offshore wind resource unlock
Italy hosts 207.3 GW of technical floating potential, the third-largest globally, with Sardinia and Sicily offering the strongest resource.[3] Flagship projects such as Renexia’s 2.8 GW Med Wind and the 1.11 GW Barium Bay array plan to deploy 15- to 18-MW turbines on semi-submersible foundations, bringing annual generation of up to 9 TWh per site. LCOEs near EUR 200/MWh (USD 216/MWh) remain above onshore levels but are expected to fall as blade lengths exceed 115 meters and supply-chain localization advances.
Restraints Impact Analysis*
| Restraint | (~) % Impact on CAGR Forecast | Geographic Relevance | Impact Timeline |
|---|---|---|---|
| Lengthy local-permitting & NIMBY pushback | -0.7% | Regional variations, strongest in Sardinia with renewable moratorium | Short term (≤ 2 years) |
| Solar-PV cost-competitiveness pressure | -0.3% | National, particularly Southern Italy high-irradiance zones | Medium term (2-4 years) |
| Euro-wind-turbine supply-chain inflation | -0.4% | National | Short term (≤ 2 years) |
| Grid integration and curtailment challenges | -0.6% | Southern mainland & islands | Medium term (2-4 years) |
| Source: Mordor Intelligence | |||
Lengthy local-permitting & NIMBY pushback
Despite national streamlining efforts, several regions slow or halt projects due to concerns over landscape and tourism. Sardinia’s temporary moratorium leaves 2.5 GW of authorized but unbuilt capacity, extending carrying costs for developers and widening the gap between tender awards and actual commissioning.
Solar-PV cost-competitiveness pressure
Utility PV LCOE fell 85% over 2010-2022, undercutting onshore wind in sunny Apulia and Sicily. Solar’s shorter construction lead times lure bidders in pay-as-bid auctions, compelling wind proponents to offer hybrid configurations or accept lower bid volumes in mixed-technology tenders.
*Our forecasts treat driver/restraint impacts as directional, not additive. The impact forecasts reflect baseline growth, mix effects, and variable interactions.
Segment Analysis
By Location: Offshore Emergence Transforms Market Dynamics
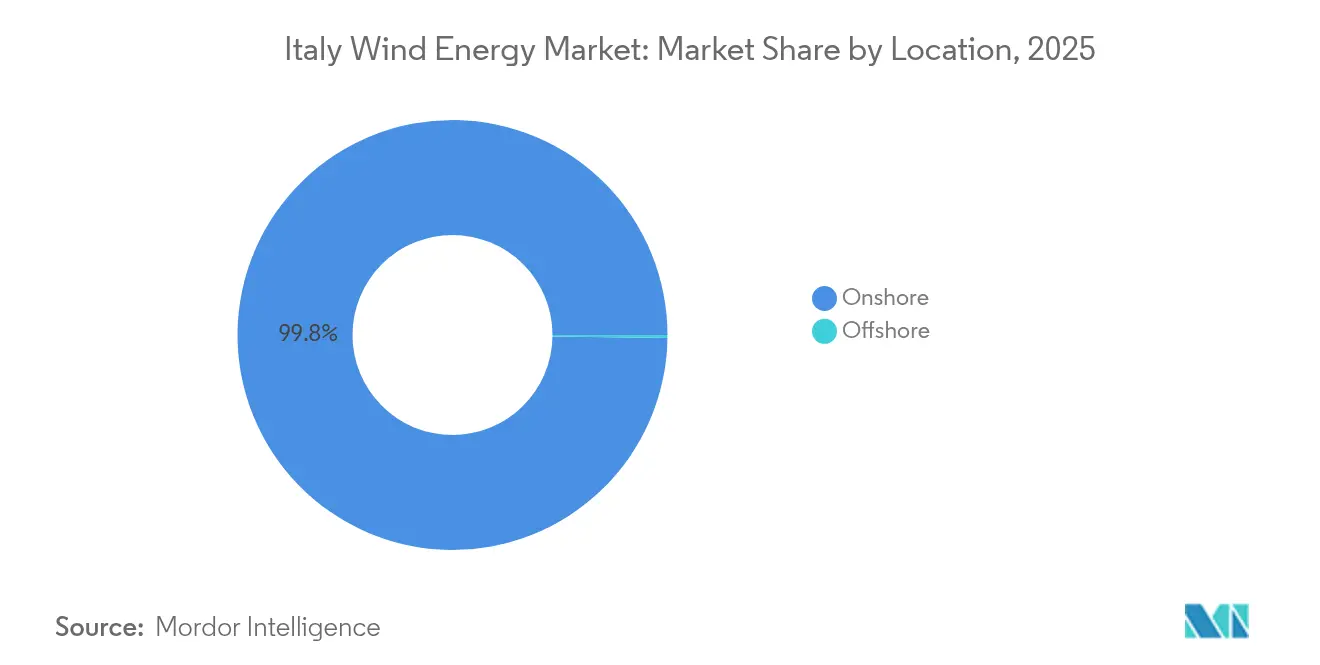
Onshore assets dominated the Italian wind energy market, accounting for 13.3 GW in 2025, which is equivalent to 99.78% of the installed capacity. Yet offshore additions are forecast to lift the location’s share to about 4.9% by 2031 on a 71.6% CAGR, making it the sector’s prime growth engine. The Italy wind energy market is tracking a clear pivot as floating foundations overcome the peninsula’s steep continental shelf, bringing multi-megawatt turbines to waters 60-200 meters deep.
Early offshore projects, such as Med Wind, Krimisa, and Messapia, leverage 15- to 18-MW machines that reduce foundation counts, lower balance-of-plant costs, and shorten construction timelines. Regulatory certainty from maritime spatial plans and FER2 auction pricing aligns with EU recovery funds to unlock debt financing. Onshore growth continues through repowering in Puglia and Calabria; yet, incremental sites are scarcer, underscoring the rising importance of offshore wind for the Italian wind energy market.

By Turbine Capacity: Technology Shift Toward Higher-Efficiency Platforms
Turbines under 3 MW still account for 71.95% of 2025 installations, a legacy of first-generation onshore wind builds. This cohort drives a repowering wave that replaces aging hardware with 4- to 6-MW units, doubling output on fewer towers and trimming O&M costs. Above 6 MW equipment records an 18.44% CAGR, the fastest within the Italy wind energy market, and is projected to command nearly one-fifth of cumulative capacity by 2031.
Higher-rated turbines increase annual energy production and reduce project footprints, which is critical in a market where permitting agencies favor smaller visual impacts. Vestas’ Ferrandina order for 5 × V162-6.4 MW platforms illustrates the onshore shift toward large rotors. Offshore arrays will rely almost exclusively on >15 MW machines by the decade’s end, accelerating supply-chain localization for blades, nacelles, and floating substructures.
By Application: Utility-Scale Dominance with C&I Acceleration
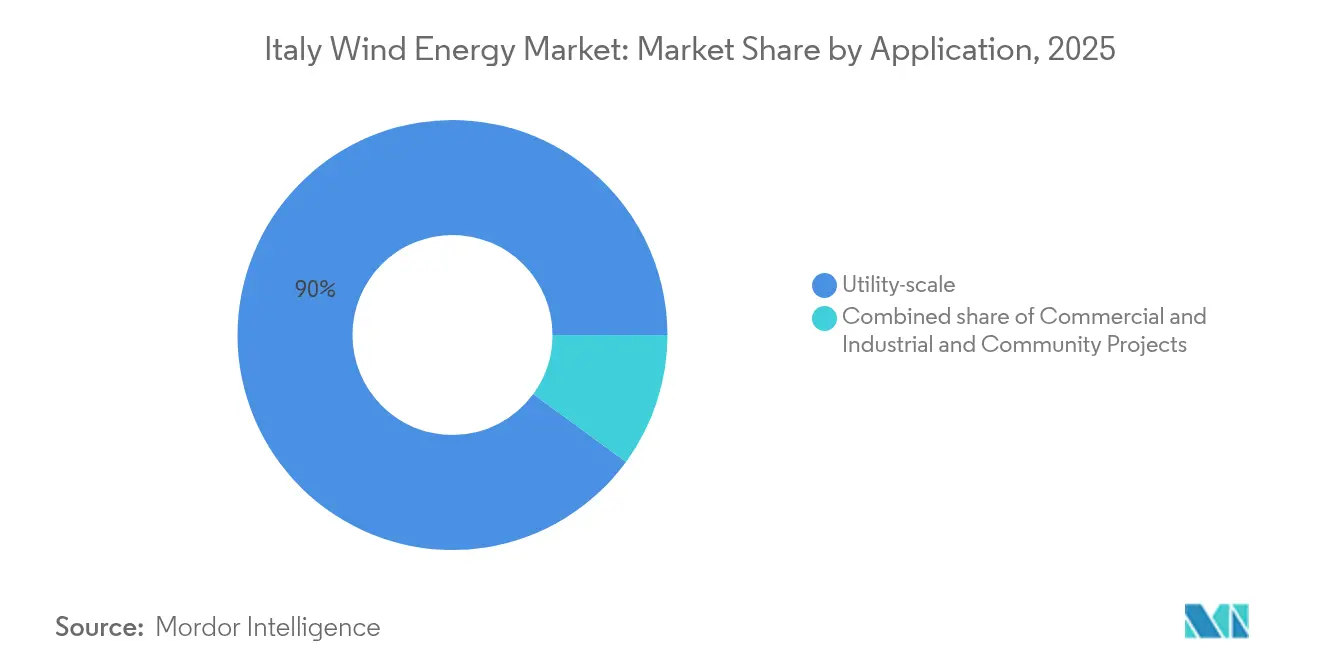
Utility projects accounted for 89.95% of the Italian wind energy market share in 2025, driven by auction design and grid interconnect standards that favor 50- to 500-MW clusters. Their aggregated bidding power yields lower financing spreads and easier access to EU grants. Italy's wind energy market size for utility-scale is projected to reach 14.37 GW by 2031, even as total market growth moderates.
Commercial and industrial (C&I) demand grows at a 12.2% CAGR, catalyzed by triple-digit ETS prices and mandatory corporate disclosures. Many C&I buyers sign synthetic PPAs or acquire equity stakes in dedicated renewable energy projects, ensuring the traceability of renewable attributes. Community schemes remain small but stable, aided by cooperative financing mechanisms that channel local savings into micro-wind clusters.
Geography Analysis
Southern regions host about 89.60% of existing wind assets, with Puglia leading due to flat terrain, robust Adriatic-Ionian winds, and proximity to Taranto’s heavy-industry load. Sicily follows, though grid-export limits delay some projects. Sardinia offers world-class resources but faces a political moratorium that pauses fresh approvals until 2026.
The Italy wind energy market is gradually diversifying northward. Emilia-Romagna and Veneto secure fixed-bottom offshore sites in shallower hubs for clean power in the Mediterranean Adriatic waters, evidenced by the Agnes-1-2 and Rimini projects. Improved north-south transmission links cut balancing costs, allowing surplus southern output to reach Lombardy’s industrial belts.
Island interconnectors, such as the Tyrrhenian Link and the Sicily–Calabria upgrade, unlock stranded capacity and reduce curtailment. Together with HVDC expansion toward the Balkans, these projects integrate variable wind flows, enabling Italy to function as a Mediterranean hub for clean power.
Regulatory Landscape
Italy has been tightening and standardizing renewable authorization and support mechanisms through the 2024-2026 reforms led by the Ministry of Environment and Energy Security (MASE), with implementation and incentive administration supported by GSE and oversight by sector regulators such as ARERA. Legislative Decree 190/2024 restructured renewable permitting under a unified, simplified approach, including standardized assessments and a single-window logic for authorizations. Legislative Decree 178/2025 introduced corrective measures, explicitly bringing energy storage systems and electrolyzers within simplified administrative regimes to support grid integration.
On the revenue-support side, the Transitional FER X scheme (Ministerial Decree 30 December 2024) set operating-price bands for eligible onshore wind, with a base operating price of EUR 85/MWh and upper and lower limits of EUR 95/MWh and EUR 70/MWh. In December 2025, GSE published the rankings for the Transitional FER X competitive procedures, assigning around 940 MW to 29 onshore wind projects at a weighted average awarded price of EUR 72.851/MWh, which points to active price competition under the updated auction framework. Law No. 4 of 15 January 2026 (conversion of Decree-Law 175/2025) also introduced urgent measures tied to the Transition 5.0 Plan and renewable electricity production, reinforcing the policy stack behind project execution and grid readiness.
Competitive Landscape
Market concentration is moderate, as the five largest developers, Enel Green Power, ERG, Edison, Renexia, and RWE, control approximately 60% of the installed onshore capacity. Enel leverages a 2.2 GW domestic fleet and a 4 GW project pipeline, including the repowering of early-2000s farms. ERG pivots toward offshore joint ventures, while Edison earmarks USD 1.5 billion for wind through 2026.[5]
New entrants such as BlueFloat Energy and Spanish utility Iberdrola partner with floating-foundation specialists to capture FER2 offshore volumes. Chinese OEM MingYang teams with Renexia on the 2.8 GW Med Wind, introducing lower-cost 18 MW turbines that challenge European incumbents Vestas and Siemens Gamesa.
Supply-chain localization gains traction: Vestas doubled headcount at its Taranto blade plant to deliver 115-meter blades for the V236-15 MW platform, while Prysmian prepares submarine cables for HVDC links financed by EU resilience funds. Yet, turbine price inflation, raw material volatility, and ongoing consolidation test the profitability of developers and suppliers.
Italy Wind Energy Industry Leaders
-
ERG S.p.A
-
Enel Green Power
-
Edison SpA
-
EDP Renováveis
-
Alerion Clean Power SpA
- *Disclaimer: Major Players sorted in no particular order
Market Opportunities and Future Outlook
A central opportunity is closing the gap to Italy's updated PNIEC 2030 wind objective of 28.1 GW, including 2.1 GW offshore, which shifts attention toward unlocking offshore zones and bankable offtake structures alongside continued repowering on constrained onshore sites. The policy toolkit is moving from fragmented measures toward codified and competitive instruments, including FER 2 (Ministerial Decree 19 June 2024), which supports innovative renewables such as floating offshore wind and provides a tariff schedule that reduces by 3% per year starting from 2025 (with specific provisions for smaller plants). Separately, the Unified Renewable Energy Code pathway under Legislative Decree 190/2024 sets obligations for regional and local adjustments within 180 days of its entry into force, creating whitespace for developers and supply-chain players that can work through the standardized permitting environment.
Execution signals also show where near-term commercialization is forming. In February 2026, Renexia deployed floating LiDAR for a 12-month measurement campaign at the 2.8 GW Med Wind site in the Strait of Sicily, supporting resource validation and financing steps for floating offshore arrays. In June 2026, the Ministry of Culture's Special PNRR Superintendency authorized the 504 MW Ichnusa Wind Power floating offshore project off Sardinia, adding momentum to offshore development where local constraints have been a key gating factor. Together, these actions create openings for ports and fabrication capacity for floating substructures, HV and submarine-cable readiness, and integrated solutions that pair wind with storage under the expanded administrative scope introduced by the 2025 corrective decree.
Recent Industry Developments
- June 2026: Edison completed a comprehensive repowering of its wind farm portfolio in Abruzzo, raising regional capacity from 114 MW to 186 MW through the installation of 47 latest-generation turbines. The upgrade shows how repowering can increase output within existing site footprints while addressing permitting and grid constraints. It also strengthens the operating base for merchant and contract-backed sales as older incentive periods roll off.
- March 2025: Edison announced the start of construction works for over 400 MW of new renewable capacity, including around 100 MW of wind, largely located in Southern Italy. This indicates continued buildout beyond repowering, with a multi-project approach that can help scale procurement and refine construction sequencing. The pipeline also supports grid-connection demand in regions that are already central to Italian wind generation.
- December 2024: ERG secured a EUR 243 million green loan from the European Investment Bank to finance renewable projects, including the repowering of two existing wind farms in Italy. The facility points to the availability of large-ticket, institution-backed financing for wind life-extension and performance upgrades. It also supports capital recycling strategies as developers balance offshore ambitions with onshore optimization.
Research Methodology Framework and Report Scope
Market Definition and Coverage
In this methodology, the Italy wind energy market is defined as the country's operational wind power capacity connected to the grid, counted in gigawatts and tracked across onshore and offshore installations.
Scope exclusions: We exclude non-wind renewables, standalone transmission build-outs, and generic EPC work that is not directly tied to wind farm capacity additions or repowering.
Segmentation Overview
- By Location
- Onshore
- Offshore
- By Turbine Capacity
- Up to 3 MW
- 3 to 6 MW
- Above 6 MW
- By Application
- Utility-scale
- Commercial and Industrial
- Community Projects
- By Component (Qualitative Analysis)
- Nacelle/Turbine
- Blade
- Tower
- Generator and Gearbox
- Balance-of-System
Data Sources, Market Sizing, and Validation
Desk Research
Desk research was used to build the factual base for capacity, generation, and policy context in Italy. We relied on public releases and statistics from national energy and grid bodies, Eurostat energy datasets, IEA and IRENA capacity and generation tables, and documents from offshore wind working groups and project registries where available.
To avoid building the model on a single series, several sources were cross-checked for the same markers, including annual installed capacity, announced repowering volumes, permitting and auction schedules, and typical turbine rating shifts over time. We also reviewed company annual reports, investor decks, and reputable industry news to confirm project timing, site status, and commissioning slippage. In addition, paid database subscriptions were used selectively for company financial intelligence, patent look-ups on turbine and foundation innovations, and import and shipment signals for large components. These desk sources are illustrative, and many other public references were used during data collection, clarification, and validation.
Primary Interviews and Surveys
Primary work focused on interviews and structured surveys with developers, utilities, project owners, turbine and component suppliers, contractors, and grid and advisory stakeholders who track Italy's pipeline closely. Since this is a country market, conversations were organized around regions with active wind build-outs, then used to test assumptions on repowering pace, permitting timelines, connection bottlenecks, and realistic annual additions.
Distribution of primary research fieldwork respondents
| Company type | Respondent position |
|---|---|
| Top tier: 34% | CXOs: 15% |
| Mid tier: 51% | Functional/Unit leaders: 25% |
| Smaller Players: 15% | Managers: 60% |
Market-Sizing & Forecasting
The core sizing uses a top-down approach where Italy's wind installed base is reconstructed from published capacity series, then adjusted using commissioning timelines, retirements, and repowering conversions that were validated in interviews. Results are also checked with selective bottom-up approximations, such as sampled project roll-ups by region, channel checks on turbine deliveries, and simple volume-by-rating checks to make sure totals are realistic.
Key model inputs include annual capacity additions (GW), repowering share versus greenfield build, average turbine size progression, grid connection lead times, and auction and permitting calendars that influence when projects move from pipeline to operations. Where project-level details were incomplete, gaps were handled through conservative timing rules based on observed permitting duration and typical construction windows, then re-checked with local experts.
For forecasting, scenario analysis was used so expected additions, faster-permit cases, and slower-connection cases could be tested using the same demand signals. Assumptions were aligned to what primary respondents said they are planning for, and then the scenario spread was narrowed to keep the final outlook consistent with documented policy targets and build-rate constraints.
Data Validation & Update Cycle
Validation was done through step-by-step triangulation across independent capacity series, project pipeline sanity checks, and variance reviews against generation patterns and known commissioning waves. When a number looked off, the driver was traced back to one assumption at a time, and follow-up calls were triggered to confirm whether the gap came from timing, repowering treatment, or grid connection delays.
Before sign-off, model outputs go through multi-step analyst review so calculation logic, units, and year mapping stay consistent. The report is refreshed annually, and interim updates are added when material auctions, policy changes, or major project decisions shift the expected build-out. Right before delivery, we run a final pass to reflect the most recent public releases and any new validation received from experts.
Mordor Intelligence's Italy Wind Energy Market Size Versus Other Published Estimates
Published estimates for Italy's wind market can still differ, even when the same country is being discussed, because the underlying measurement and timing choices are not always aligned. The biggest swings usually come from whether the number represents installed capacity, generation, or a value proxy, and from how repowering and retirements are treated across years.
By tracking operational grid-connected capacity and refreshing repowering conversions with interview checks, Mordor Intelligence keeps the model tied to what is actually online in Italy, rather than mixing in early-stage pipeline or counting nameplate changes twice during turbine replacement cycles.
Benchmark comparison
| Source | Market Size | Gaps in Research Methodology |
|---|---|---|
| Mordor Intelligence | USD 13.33 B (2025) | |
| Industry Data Provider A | USD 13.33 B (2023) | Uses an earlier base year and a higher-growth build-rate, which can embed optimistic permitting and grid-connection timing that is not always achieved in practice. |
| Energy Data Publisher B | USD 11.87 B (2022) | Often emphasizes historical cumulative capacity and generation tables, so the headline can lag current commissioning, and the cut between operational assets and pipeline is not always stated clearly. |
Across the three references, the spread is mainly explained by year alignment and by whether repowering is treated as net additions or as a replacement activity that also removes old capacity. When those boundary choices are made explicit and then checked against project timing and grid constraints, the resulting size is easier to reproduce and defend on a client call.
Key Questions Answered in the Report
How large is the installed wind capacity in Italy in 2026?
The Italy wind energy market size stands at 13.33 GW for 2025 and is expected to surpass 13.73 GW during 2026 based on the 3.02% CAGR trajectory.
What CAGR is forecast for Italian wind additions between 2026 and 2031?
Capacity is projected to expand at a 3.02% CAGR, lifting total installations to 15.94 GW by 2031.
Which location segment is growing fastest?
Offshore installations lead with a 71.6% CAGR through 2031 as floating foundations unlock deep-water Mediterranean resources.
Why are corporate PPAs important for Italian wind?
They provide long-term revenue certainty, lower financing costs, and help industries meet decarbonization targets amid rising ETS prices.
What are the main restraints on future wind growth?
Local permitting delays, grid congestion causing curtailment, turbine cost inflation, and intense price competition from low-cost solar PV.
Which companies dominate Italy’s wind sector?
Enel Green Power, ERG, Edison, Renexia, and RWE account for about 59.30% of installed capacity, while BlueFloat Energy and MingYang target emerging offshore opportunities.