
Market Overview
| Study Period | 2021 - 2031 |
|---|---|
| Forecast Data Period | 2026 - 2031 |
| Base Year Market Size (2025) | 43.5 gigawatt |
| Market Volume (2026) | 49.37 gigawatt |
| Market Volume (2031) | 93.06 gigawatt |
| Growth Rate (2026 - 2031) | 13.49 % |
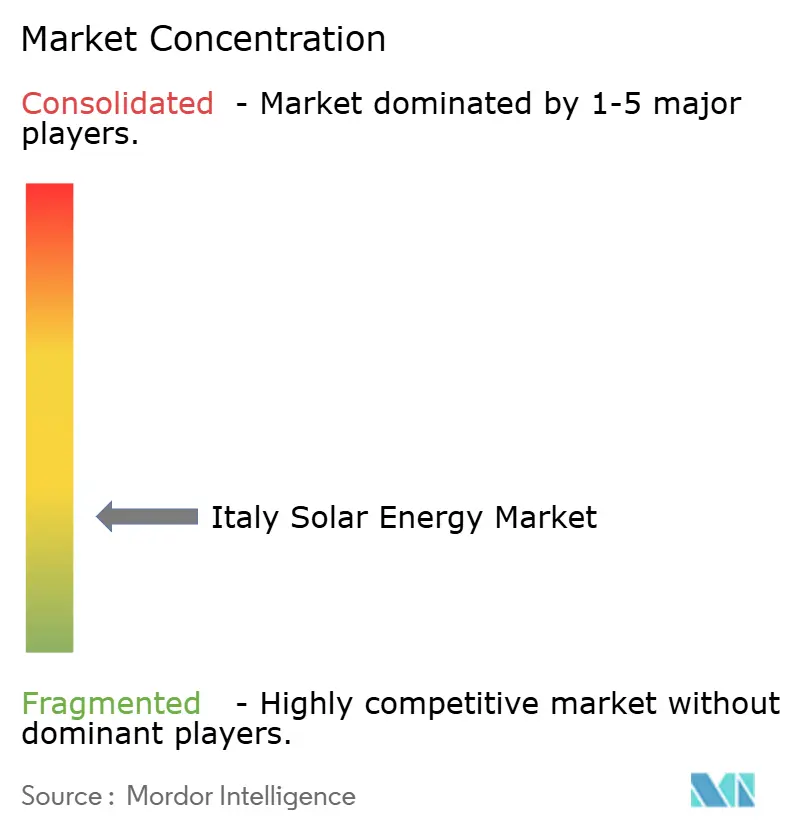
| Market Concentration | Low |
Major Players *Disclaimer: Major Players sorted in no particular order Image © Mordor Intelligence. Reuse requires attribution under CC BY 4.0. | |
Italy Solar Energy Market Analysis by Mordor Intelligence
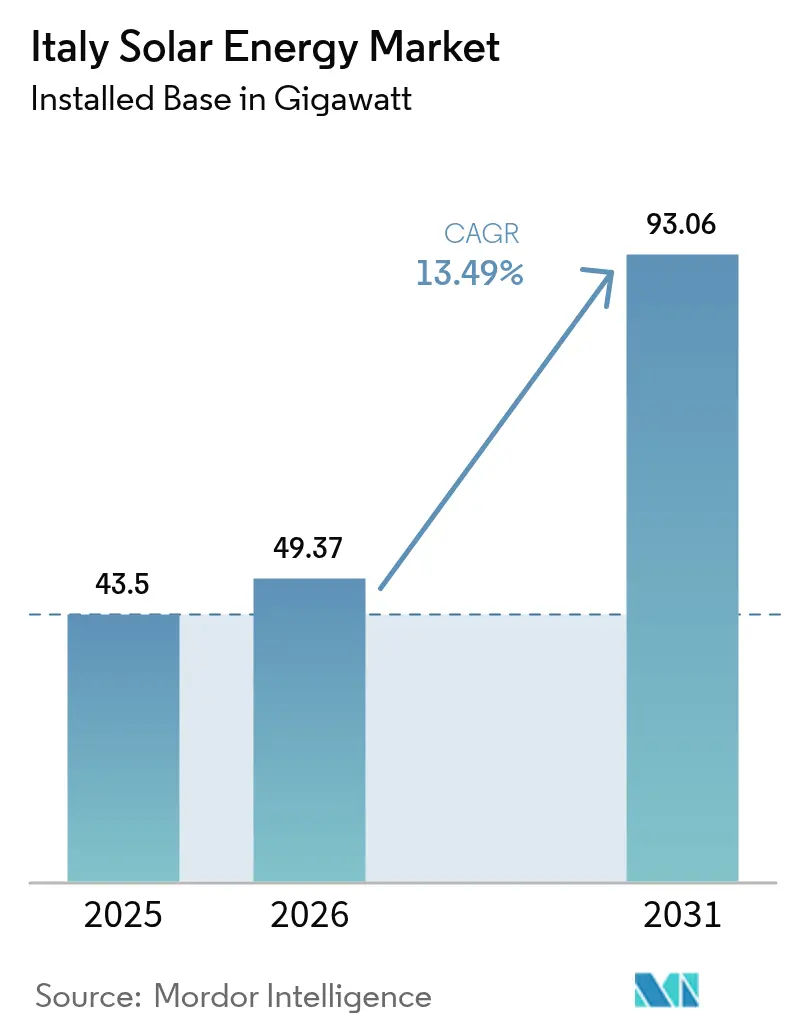
The Italy Solar Energy Market size in terms of installed base was valued at 43.5 gigawatt in 2025 and estimated to grow from 49.37 gigawatt in 2026 to reach 93.06 gigawatt by 2031, at a CAGR of 13.49% during the forecast period (2026-2031).
Lowered levelized cost of electricity, the European Union’s REPowerEU mandate, and Italy’s PNIEC 2030 target combine to provide developers with long-range visibility, while abundant capital inflows sustain momentum even as subsidies taper. Utility-scale projects now achieve an average LCOE of below EUR 0.040/kWh in sunny southern provinces, outperforming gas-fired generation at every hour of the day.(1) Corporate power-purchase agreements (PPAs) worth EUR 2.8 billion were signed in 2024 alone, indicating that large manufacturers view fixed-price solar contracts as a hedge against commodity volatility. At the household level, the Superbonus incentive is spurring residential demand, although its upcoming phase-down creates urgency that may prompt front-loading of installations into 2025.
Key Report Takeaways
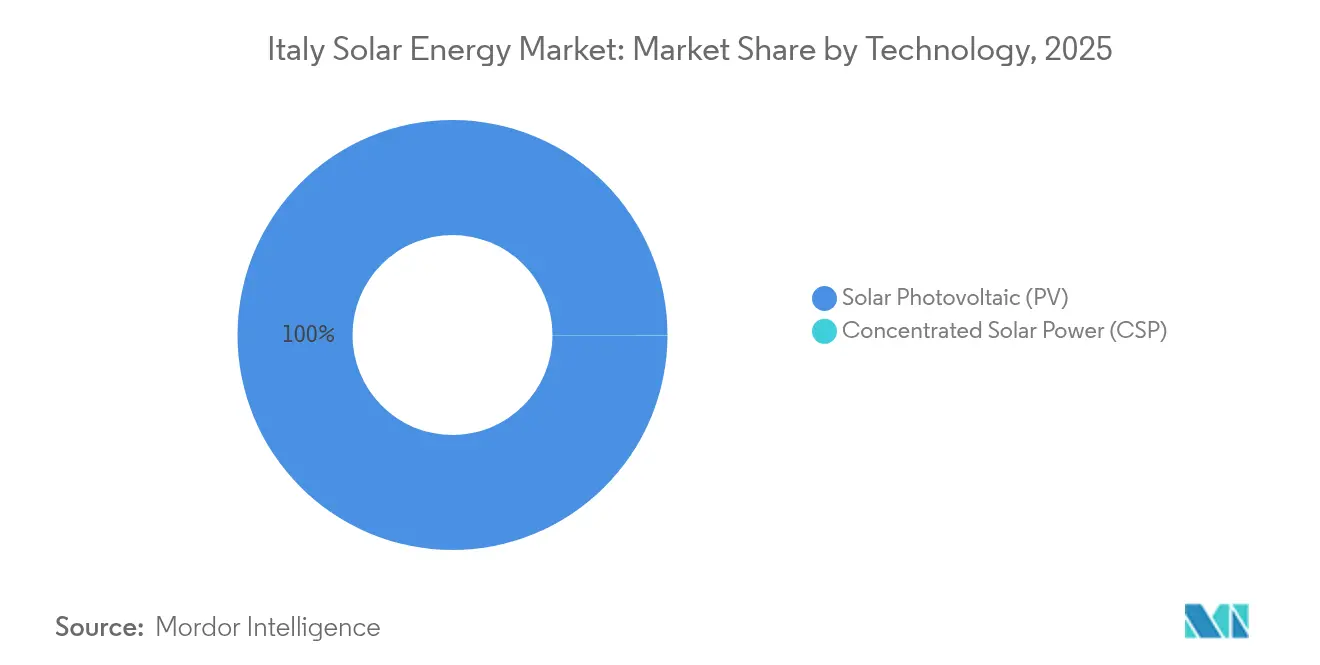
- By technology, photovoltaic systems held 99.97% of Italy's solar energy market share in 2025; concentrated solar power is forecast to expand at a 104.7% CAGR through 2031.
- By grid type, on-grid installations accounted for a 97.55% share of the Italian solar energy market size in 2025, while the off-grid segment is projected to advance at a 26.9% CAGR through 2031.
- By end-user, utility-scale plants accounted for 53.65% of the Italy solar energy market size in 2025 and are set to grow at a 14.21% CAGR over the forecast period.
- Enel Green Power, EF Solare Italia, and Sonnedix collectively controlled approximately 34.60% of the Italian solar energy market share in 2025.
Note: Market size and forecast figures in this report are generated using Mordor Intelligence’s proprietary estimation framework, updated with the latest available data and insights as of 2026.
Italy Solar Energy Market Trends and Insights
Drivers Impact Analysis*
| Driver | (~) % Impact on CAGR Forecast | Geographic Relevance | Impact Timeline |
|---|---|---|---|
| Declining LCOE of PV electricity | +3.2% | National, highest in the South | Medium term (2-4 years) |
| EU REPowerEU & PNIEC 2030 targets | +2.8% | National, accelerated in Mezzogiorno | Long term (≥ 4 years) |
| Corporate-PPA boom among industrials | +2.1% | Northern industrial corridors | Short term (≤ 2 years) |
| Residential “Superbonus” tax credits | +1.9% | Urban centers nationwide | Short term (≤ 2 years) |
| Agrivoltaics enhancing land value | +1.4% | Puglia, Sicily, Emilia-Romagna | Medium term (2-4 years) |
| Behind-the-meter storage cost parity | +1.1% | High-tariff regions | Medium term (2-4 years) |
| Source: Mordor Intelligence | |||
Declining LCOE of PV Electricity
Italy’s average solar LCOE fell to EUR 0.045/kWh in 2024, marking the first instance of subsidy-free parity with conventional generation.(2) Module efficiencies reached 22.5% for mainstream crystalline panels, and standardized racking further trimmed balance-of-system expenses. Southern utility projects now deliver LCOE as low as EUR 0.040/kWh, pushing gas peakers into residual duty. Domestic inverter maker Fimer introduced 99.2% efficiency string models that reduce conversion losses, locking in cost reductions that are likely to deepen through 2027.
EU REPowerEU & PNIEC 2030 Targets
Brussels raised Italy’s 2030 solar obligation to 85 GW, nearly doubling the earlier PNIEC figure and incorporating quarterly compliance reviews that maintain political focus.(3) Rome earmarked EUR 6.9 billion in PNRR funds, with 60% dedicated to southern solar build-out. Regional “green corridors” have reduced permit cycles for sites exceeding 50 MW from 24 months to approximately 8 months, while new commercial buildings over 1,000 m² are required to install rooftop systems, creating an assured demand pipeline.
Corporate-PPA Boom Among Italian Industrials
Industrial buyers locked in 2.3 GW of new solar PPAs during 2024, a 340% jump year-on-year. Steelmaker Arvedi signed for 180 MW under a 15-year fixed-price deal, and magnetics producer Bekaert lined up 95 MW to curb input-cost swings. Banks now treat PPAs as quasi-hedging instruments, offering debt at spreads below those of traditional project finance, because corporate credit stands behind the cash flows.
Residential “Superbonus” & Tax-Credit Schemes
The 110% Superbonus drove 4.2 GW of residential rooftop capacity through 2024, democratizing access across income brackets. The incentive begins stepping down to 90% in 2025, prompting a rush that has installer waiting lists stretching to 12 months in Lombardy. While complexity adds EUR 2,000-4,000 to average system cost, energy communities enjoy an extra 20% credit, accelerating neighborhood-scale deployment.
Restraints Impact Analysis*
| Restraint | (~) % Impact on CAGR Forecast | Geographic Relevance | Impact Timeline |
|---|---|---|---|
| Grid saturation & lengthy permitting | -2.3% | Northern regions, spreading central | Short term (≤ 2 years) |
| Phase-down of Superbonus incentives | -1.8% | Residential nationwide | Short term (≤ 2 years) |
| Restrictions on farmland ground-mount | -1.2% | Protected rural landscapes | Medium term (2-4 years) |
| Local opposition & landscape rules | -0.9% | Heritage and coastal areas | Long term (≥ 4 years) |
| Source: Mordor Intelligence | |||
Grid Saturation & Lengthy Permitting
Northern grids face 23 GW of queued projects, which delays connections by up to two years and increases interconnection fees to EUR 80,000/MW in hotspots. Terna’s EUR 18 billion expansion plan is still ramping. Developers must navigate 14 approvals; environmental impact assessments alone can take up to 12 months. Fast-track rules for sub-10 MW plants ease pressure but do little for the large farms that dominate new capacity.
Phase-down of Superbonus Incentives
Cutting the Superbonus to 90% in 2025 reduces paybacks and clouds installer pipelines, with many forecasting revenue drops of 40-60% post-2025. Material shortages already add 15-20% to component costs during current demand peaks, and banks are tightening lending amid an uncertain future for savings. Regional programs attempt to fill gaps but often add administrative layers that can confuse consumers.
*Our forecasts treat driver/restraint impacts as directional, not additive. The impact forecasts reflect baseline growth, mix effects, and variable interactions.
Segment Analysis
By Technology: PV Dominance Masks CSP Renaissance
PV installations accounted for 99.97% of total additions in 2025, driven by mature supply chains and the ease of rooftop siting. Concentrated solar power, though scarcely 0.02 GW today, is accelerating at a 104.7% CAGR and could supply evening peaks with six-hour molten-salt storage. Sicily's high direct normal irradiance, exceeding 2,000 kWh/m²/year, enables CSP to dispatch at fixed tariffs that rival those of gas units, and the EU taxonomy favors its grid-firming traits. Enel Green Power's hybrid CSP-PV blueprint pairs up-front PV yields with stored thermal output after dusk, a template that could reshape baseload renewables.
The Italy solar energy market size for CSP remains modest, yet favorable debt terms under green bonds lower capital cost. Independent power producers secure 25-year feed-in contracts that cover both electricity and "capacity-like" availability payments, improving risk-adjusted returns. A policy requiring ≥50 MW projects to demonstrate grid-support services implicitly rewards thermal storage, nudging developers toward CSPs' dispatchable profile. Medium-term growth thus hinges less on technology risk than on how quickly component suppliers can scale specialized receivers and salts.

By Grid Type: Off-Grid Acceleration Challenges On-Grid Hegemony
On-grid systems enjoy 97.55% market share thanks to net-metering simplicity and a streamlined process for <20 kW connections. Yet the off-grid segment is pacing at a 26.9% CAGR, catalyzed by island microgrid programs where diesel costs exceed EUR 0.35/kWh. Sicily's minor islands plan to replace aging gensets entirely by 2028, and mainland factories hurt by 2022 energy shocks are installing solar-storage microgrids that cut outage risk.
Italy's solar energy market size for off-grid remains small, but battery innovation makes it feasible for mines, data centers, and food processors to sever grid dependence. Projects bypass long interconnection queues, trimming development time to under a year. Vanadium flow batteries are suited to 10-hour profiles common in isolated resorts, while lithium-iron-phosphate units dominate shorter-cycle industrial applications. Regulators now permit off-grid plants to export surpluses into local distribution networks up to 5 GWh per year, a hybrid model that further blurs the boundaries of the grid.
By End-User: Utility-Scale Momentum Reshapes Market Dynamics
Utility-scale plants captured 53.65% market share in 2025, advancing at a 14.21% CAGR on the back of cheap capital and appetite for corporate PPAs. Land-bank schemes in Puglia and Basilicata pre-permit brownfields, removing a key barrier and letting projects reach notice-to-proceed in under nine months. Terna’s new grid code compensates large sites for providing reactive power support, adding a small but dependable revenue stream.
The Italian solar energy market size tied to commercial and industrial rooftops continues to expand, albeit at a slower pace than utility farms, as many SMEs still rent their premises. Residential uptake depends on evolving incentives, although energy-community bonuses maintain a baseline level of interest. Utility-scale investors now routinely integrate agrivoltaics or sheep grazing to mitigate land-use conflicts, and combined PV-plus-storage arrays achieve an average capacity factor of 30% when dispatch optimization is included.

Geography Analysis
Southern Italy maintains the strongest solar economics, with capacity factors of 22-25% compared with 15-17% in the north. Puglia leads with 3.8 GW of installed capacity, boosted by dedicated agrivoltaic fast lanes in regional permitting. Sicily and Sardinia add a laboratory use-case, piloting floating solar and CSP hybrids that inform mainland rollouts. Central provinces, such as Abruzzo, balance solid irradiation and proximity to Rome’s load centers, making them favored by PPA-backed developers.
Northern regions suffer grid congestion but host Italy’s largest industrial off-takers; Lombardy alone registered 7 TWh of signed solar PPAs in 2024. Developers willing to fund 150 kV upgrade taps unlock lucrative dispatch zones. Terna budgets EUR 3.2 billion through 2028 for North-South transmission reinforcement to shift surplus midday solar energy from south to north. New HVDC corridors mitigate curtailment risk, reducing merchant price volatility, particularly in Emilia-Romagna.
Internal trade in guarantees of origin (GO) is emerging: southern generators monetize excess certificates to northern corporates that lack local rooftop potential. Previously overlooked Molise and Basilicata capitalize on flat terrain and friendly town councils, offering over 1,000 hectares of pre-zoned land for sites exceeding 50 MW. Coastal heritage rules steer tourist districts toward rooftop formats; hence, Liguria prioritizes BIPV tiles, avoiding visual intrusion. The disparate regulatory tempo across provinces incentivizes developers to diversify pipelines geographically, spreading approval risk.
Regulatory Landscape
Italy's solar build-out is shaped by EU-aligned national legislation, tariff decisions from the energy regulator, and permitting simplifications. In January 2026, Law 4/2026 (published in the Gazzetta Ufficiale) converted Decree-Law 175/2025 with urgent measures tied to the Piano Transizione 5.0 and renewable electricity production, reflecting continued transposition of EU rules into domestic permitting and support frameworks. In parallel, Italia Semplice guidance and the PAS (Procedura Abilitativa Semplificata) pathway keep authorization timelines shorter for certain PV plants, including streamlined deadlines and defined thresholds that determine when a regional environmental impact assessment (VIA) is required.
On tariffs and revenue streams, ARERA actions in 2026 updated components used to fund renewable support. Deliberation 98/2026/R/com (effective 1 April 2026) revised grid tariff components, including ASOS and ARIM, and ARERA also set the 2025 average electricity price used to calculate 2026 replacement incentives for legacy mechanisms. Decree-Law 21/2026 (the 2026 Energy Decree) introduced voluntary mechanisms for PV plants above 20 kW that receive Conti Energia feed-in tariffs, linking legacy support to modernization choices and repowering pathways, which in turn affects the large installed base as the market shifts toward repowering and hybridization.
Competitive Landscape
The top five operators hold roughly 40% combined share, indicating moderate concentration that still leaves space for niche entrants. Enel Green Power leverages its grid affiliate expertise to secure priority interconnection and has earmarked EUR 1.2 billion for 2.1 GW of new southern sites by 2027.(5) EF Solare Italia focuses on operational excellence, reporting 99.5% fleet availability through predictive maintenance. Sonne, as leading firms now own EPC arms, tracker manufacturers, and O&M software suites, thereby expanding by acquiring 450 MW of pipeline assets, underscoring that scale can be bought as well as built.
Vertical integration is the dominant strategy: leading firms now own EPC arms, tracker manufacturers, and O&M software suites, capturing more value and de-risking schedules. Fimer’s high-efficiency inverters gain share due to compliance with the latest grid-support mandates, while Canadian Solar’s planned 2 GW panel plant aims to shorten European supply chains and hedge tariff risk. Digital newcomers, such as Otovo, curate turnkey packages for homeowners via online portals, thereby squeezing soft costs and boosting close rates.
Specialty arenas, agrivoltaics, floating arrays, and BIPV offer white-space where smaller innovators with agronomic or marine expertise can compete. Institutional investors pour pension money into mid-size portfolios (10-50 MW) for steady inflation-linked returns, spawning a secondary market for de-risked assets. Meanwhile, battery aggregators court homeowners with upfront rebates in return for multi-year cycling rights, forging new alliances between utilities and retail installers.
Italy Solar Energy Industry Leaders
-
Enel Green Power S.p.A.
-
EF Solare Italia S.p.A.
-
Sonnedix Power Holdings Ltd
-
Renantis S.p.A.
-
A2A S.p.A.
- *Disclaimer: Major Players sorted in no particular order
Market Opportunities and Future Outlook
The utility-scale opportunity is widening in Southern Italy as project sizes grow and contracting routes become more bankable through corporate contracting and new-build benchmarks. In June 2026, Iberdrola inaugurated the 243 MW Fenix photovoltaic plant in Sicily, which sets a new reference point for single-site scale and reinforces the province's role for high-yield, grid-relevant projects. Developers are also moving from standalone generation into solar-plus-storage and dispatch-oriented portfolios. In July 2026, Enfinity Global reported that it surpassed 535 MW of operational PV across 18 plants in Italy and had 600 MW of authorized battery storage capacity, underscoring where value is being created around grid services and congestion management.
A second opportunity is emerging in structured procurement and self-consumption programs that reduce exposure to volatile merchant prices while aligning with industrial load needs. Italy's early-2026 legal updates, including Law 4/2026 and related measures published in the official gazette, improve the rulebook for permitting and support-scheme design in line with EU Directive 2023/2413. At the same time, the state agency GSE's FerX auction mechanism, with a stated 10 GW allocation plan across 2026-2027, provides a defined contracting channel for large projects, while government-managed incentive windows under programs such as PNRR-linked actions continue to steer capital toward southern regions and self-consumption use cases. Together with the existing corporate-PPA base referenced in the broader market context, these elements create room for developers and EPCs to scale standardized PV, agrivoltaics, and PV-plus-storage configurations across auction and bilateral contracting models.
Recent Industry Developments
- July 2026: Enfinity Global announced that its operational solar PV portfolio in Italy surpassed 535 MW across 18 plants, and it also cited 600 MW of authorized battery storage capacity. The paired PV and storage footprint points to a shift toward hybridization for improved dispatch control and congestion management in high-penetration zones.
- June 2026: Iberdrola inaugurated the 243 MW Fenix solar farm in Sicily, described as Italy's largest operating photovoltaic plant at the time. The commissioning raised the benchmark for utility-scale project sizing and reinforced Sicily's position as a key province for large-format PV deployment.
- October 2025: Enel Green Power announced a EUR 1.2 billion plan to deliver 2.1 GW of utility-scale solar capacity by 2027, with a substantial share structured as agrivoltaic projects. The program adds depth to the late-stage pipeline and signals continued industrialization of project development in the Mezzogiorno.
Research Methodology Framework and Report Scope
Market Definition and Coverage
For this study, the Italy solar energy market is defined as the country level solar power sector measured in installed capacity, covering operating solar PV and CSP systems connected to the grid or deployed off-grid.
Scope exclusions: We do not count non-power solar thermal heating systems and we also exclude electricity transmission and retail supply activities.
Segmentation Overview
- By Technology
- Solar Photovoltaic (PV)
- Concentrated Solar Power (CSP)
- By Grid Type
- On-Grid
- Off-Grid
- By End-User
- Utility-Scale
- Commercial and Industrial (C&I)
- Residential
- By Component (Qualitative Analysis)
- Solar Modules/Panels
- Inverters (String, Central, Micro)
- Mounting and Tracking Systems
- Balance-of-System and Electricals
- Energy Storage and Hybrid Integration
Data Sources, Market Sizing, and Validation
Desk Research
We start by building a fact base on Italy's solar buildout using public energy statistics and policy documents, then we map those signals into a clean historical timeline. Common inputs include Terna grid data, GSE publications, Eurostat energy balances, IEA PVPS country snapshots, and official releases from the Italian energy ministry and regulator.
Next, the desk work is used to set ranges for annual additions, cumulative capacity, typical system sizes, and grid-connection patterns, which are then carried into the market model. Company filings, investor presentations, and reputable press are also reviewed to understand project pipelines, utility tender momentum, and tracker and module price direction. A paid subscription for company financials and a patent database is used selectively to sanity check activity levels. The desk research sources listed are illustrative only, and we reviewed many other public references for data collection, validation, and clarification.
Primary Interviews and Surveys
To pressure-test the desk assumptions, we run expert interviews and structured surveys with installers, EPC participants, project developers, asset owners, and select component and service providers operating in Italy. The feedback is used to confirm how on-grid versus off-grid is being counted in practice, how utility scale pipelines convert into commissioned capacity, and what typical lead times and permitting constraints do to yearly timing. We keep coverage across the main demand pockets in northern, central, and southern Italy.
Distribution of primary research fieldwork respondents
| Company type | Respondent position |
|---|---|
| Top tier: 28% | CXOs: 20% |
| Mid tier: 50% | Functional/Unit leaders: 34% |
| Smaller Players: 22% | Managers: 46% |
Market-Sizing & Forecasting
Sizing is built using a top-down approach, where national capacity additions and grid-connection records are reconstructed into a yearly installed base, then carried forward using expected commissioning and retirement patterns. We corroborate totals with selective bottom-up approximations, such as sampled project pipelines, installer throughput checks, and indicative capacity-by-end-user splits based on observed system-size mixes.
A few inputs that matter most for Italy are annual PV and CSP additions, cumulative installed capacity, the share of utility-scale versus distributed systems, connection and permitting lead times, and the observed equipment and EPC cost direction that influences project viability. When a dataset is missing for a specific year or sub-scope, we fill gaps using bounded interpolation tied to nearby capacity additions and expert-confirmed timing shifts, then re-check that the implied year-over-year changes remain realistic.
For forecasting, scenario analysis is used because policy support, permitting speed, and grid readiness can shift the commissioning curve even when the project pipeline looks strong. The scenarios are anchored to expert consensus on build rates and cross-checked against official targets and recent addition momentum, so the final trajectory remains explainable and repeatable.
Data Validation & Update Cycle
Outputs are validated through step-by-step checks that compare modeled capacity levels against independent public signals, and then outliers are reviewed before sign-off. If a variance is flagged, we re-open assumptions behind timing, system type coverage, and grid connection classification, followed by targeted re-contact with interviewees to confirm what changed.
The work is reviewed across analysts so key inputs and calculations can be traced, and any large revisions are documented for consistency. Reports are refreshed annually, with interim updates when material events occur, such as major policy changes, sharp equipment price moves, or unexpected commissioning surges. Before delivery, a final analyst pass is completed so the market view reflects the latest available data.
Mordor Intelligence's Italy Solar Energy Market Size Compared Against Other Published Estimates
Published estimates for Italy's solar market often do not match, mainly because the unit of measurement is not consistent, and because some studies mix capacity and value in the same narrative. Differences also show up when authors include adjacent solar activities, like heating systems, or apply different timing for what counts as installed versus contracted.
Grid-connection and installed-base signals, along with official additions reported in national power statistics, are the checks that tie Mordor Intelligence's 2025 estimate to a capacity-defined market boundary (PV and CSP only, counted as installed GW).
Benchmark comparison
| Source | Market Size | Gaps in Research Methodology |
|---|---|---|
| Mordor Intelligence | USD 43.50 B (2025) | |
| Regional Consultancy A | USD 32.56 B (2024) | This figure is value-based and can bundle equipment, installation services, and pricing assumptions into one total. That makes it not directly comparable to an installed-capacity view, and it can be sensitive to module price cycles. |
| Industry Publisher B | USD 18.00 B (2024) | This estimate appears to lean on investment or spending cues. As a result, the number can widen or narrow depending on what is counted as solar-related spend, including storage add-ons or broader solar system categories beyond PV and CSP. |
Looking across the three numbers, the spread is explained more by definition choices than by actual on-the-ground solar activity. By keeping the boundary tied to installed capacity signals and validating timing through expert checks, the resulting market size stays easier to reconcile with public energy statistics and year-to-year build trends.
Key Questions Answered in the Report
What is the projected installed capacity for solar power in Italy by 2031?
The country is expected to reach 93.06 GW of cumulative solar capacity by 2031.
How fast is utility-scale solar growing compared with other segments in Italy?
Utility-scale projects are advancing at a 14.21% CAGR, outpacing residential and C&I installations.
Will the Superbonus still support rooftop solar after 2026?
Yes, but the reimbursement rate falls from 110% to 90% in 2025 and to 70% in 2026, so paybacks lengthen.
Why are corporate PPAs important for new Italian solar farms?
Industrial PPAs lock in long-term revenue, enabling projects to raise debt at attractive terms and avoid wholesale price risk.
How does agrivoltaics benefit Italian farmers?
Dual-use systems can triple per-hectare revenue by combining crop output with electricity sales while reducing water stress.