
Market Overview
| Study Period | 2021 - 2031 |
|---|---|
| Forecast Data Period | 2026 - 2031 |
| Historical Data Period | 2021 - 2024 |
| Market Volume (2026) | 155.68 gigawatt |
| Market Volume (2031) | 199.10 gigawatt |
| Growth Rate (2026 - 2031) | 5.04 % |
| Market Concentration | Medium |
Major Players *Disclaimer: Major Players sorted in no particular order Image © Mordor Intelligence. Reuse requires attribution under CC BY 4.0. | |
Italy Power Market Analysis by Mordor Intelligence
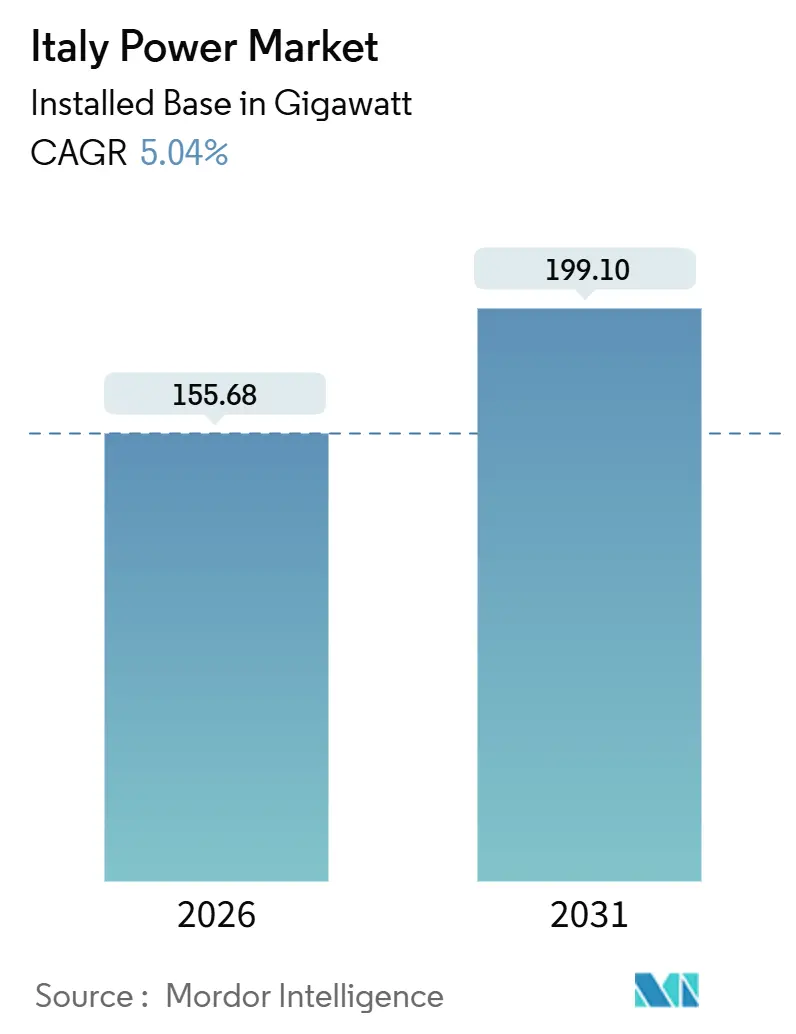
The Italy Power Market size in terms of installed base is expected to grow from 155.68 gigawatt in 2026 to 199.10 gigawatt by 2031, at a CAGR of 5.04% during the forecast period (2026-2031).
This outlook is anchored by accelerated renewable additions, the coal-fired phase-out, and a EUR 16.5 billion–23 billion transmission-upgrade plan that aims to double cross-border exchange capacity beyond 30 GW.[1]Terna S.p.A., “2024-2034 Development Plan,” terna.it Developers are racing to secure grid access in Apulia and Sicily, where streamlined permitting has shortened approval cycles to months, yet congestion risks remain high and have already triggered curtailment penalties above 8% of potential output in 2024.[2]Autorità di Regolazione per Energia Reti e Ambiente, “Annual Report 2025,” arera.it Natural gas continues to fuel roughly 50% of generation and, given 90% import exposure, creates a vulnerability to geopolitical price shocks despite new LNG terminals and pipeline diversification. Storage is scaling quickly: Terna’s inaugural MACSE auction in 2024 awarded 2.3 GW of grid-scale batteries, signaling a structural pivot from gas peakers toward lithium-ion and flow technologies that capture day-ahead spreads and supply ancillary services.
Key Report Takeaways
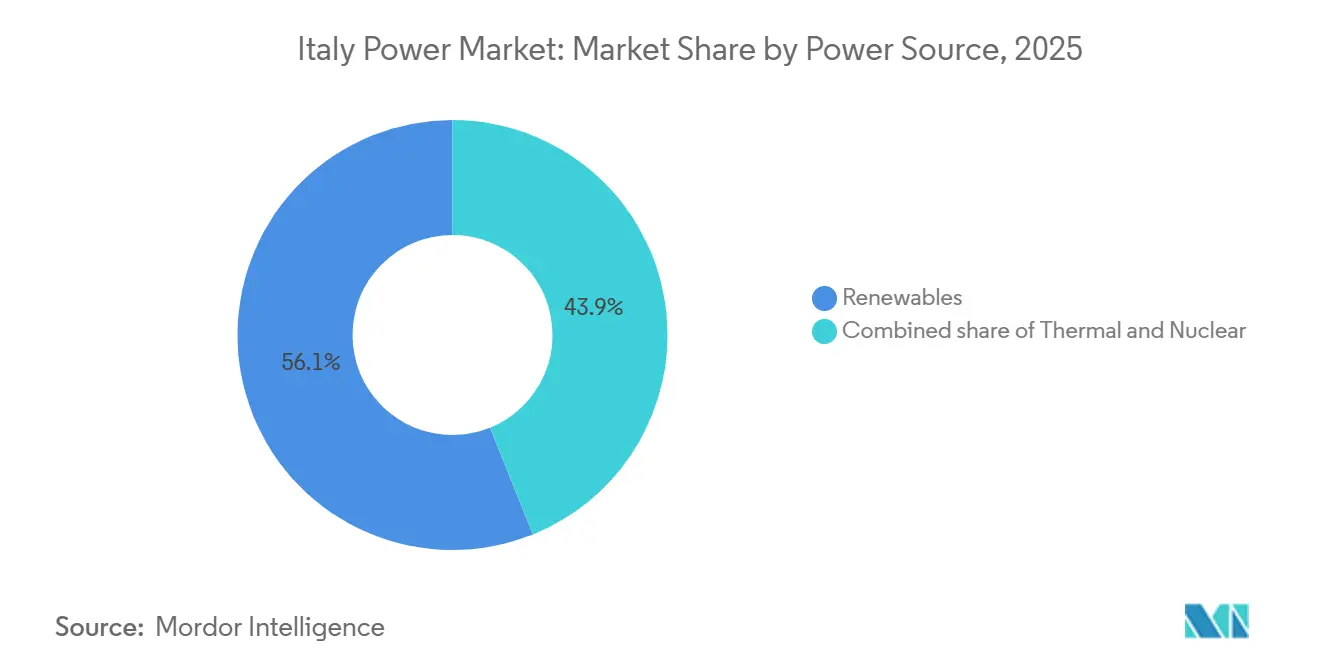
- By power source, renewables held 56.1% of Italy's power market share in 2025 and are advancing at an 8.9% CAGR through 2031.
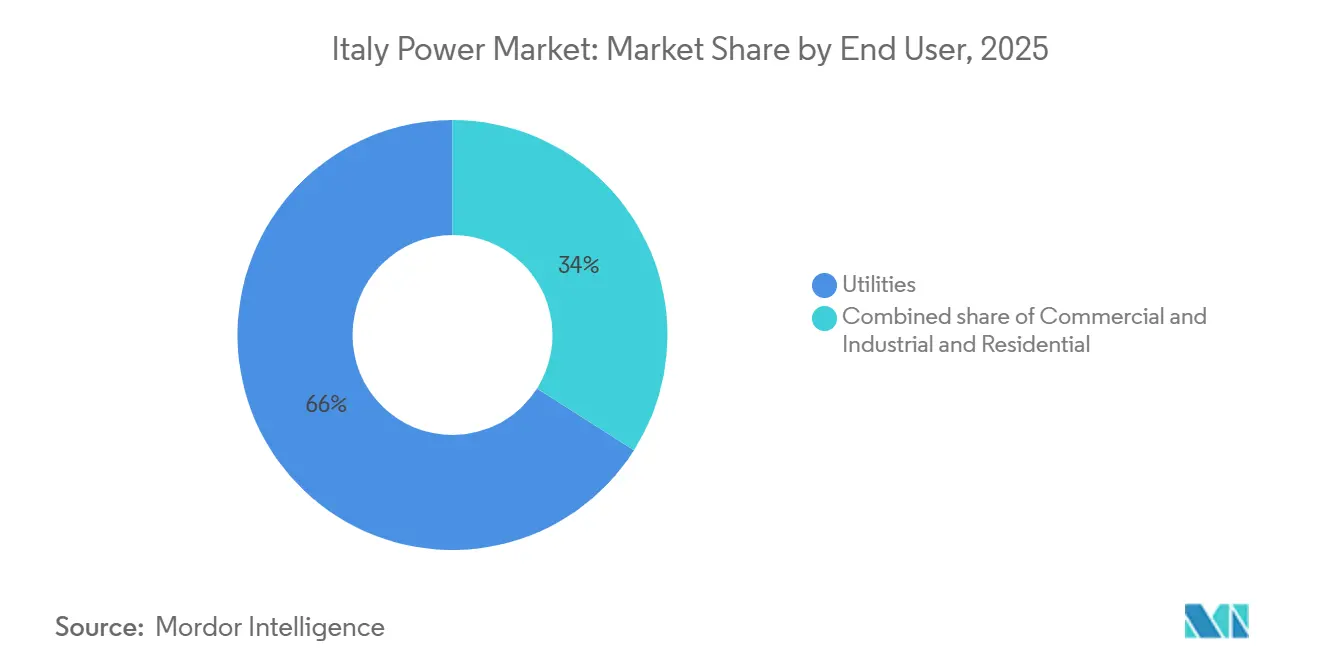
- By end user, the utility segment controlled 66% of Italy's power market share in 2025 and is expanding at a 6.7% CAGR to 2031.
Note: Market size and forecast figures in this report are generated using Mordor Intelligence’s proprietary estimation framework, updated with the latest available data and insights as of January 2026.
Italy Power Market Trends and Insights
Drivers Impact Analysis*
| Driver | (~) % Impact on CAGR Forecast | Geographic Relevance | Impact Timeline |
|---|---|---|---|
| Accelerated Permitting Reforms under Legislative Decree 199/2021 | +1.2% | National, with higher uptake in southern regions (Apulia, Sicily, Calabria) | Medium term (2-4 years) |
| Grid-scale Battery Capacity Market Auctions (Terna) | +0.8% | National, concentrated in high-congestion zones (Apulia, Sicily) | Short term (≤ 2 years) |
| Coal Phase-out by 2025 Creating Capacity Gap | +0.9% | National, acute in Sardinia and mainland coal-dependent zones | Short term (≤ 2 years) |
| REPowerEU-funded HVDC Projects (Tyrrhenian Link) | +0.6% | Sardinia-mainland corridor, spillover to Sicily-Tunisia link | Long term (≥ 4 years) |
| Corporate PPAs Surge among Luxury & FMCG Majors | +0.5% | National, concentrated in northern industrial regions (Lombardy, Veneto, Emilia-Romagna) | Medium term (2-4 years) |
| Superbonus 110% Stimulus for Rooftop PV | +0.4% | National, with highest adoption in northern homeownership zones | Short term (≤ 2 years) |
| Source: Mordor Intelligence | |||
Accelerated Permitting Reforms Under Legislative Decree 199/2021
Legislative Decree 199/2021 cut solar and onshore wind approval cycles from more than two years to roughly six months for projects under 10 MW, while Decree 190/2024 extended the fast track to repowering and hybrid storage configurations. Over 15 GW of applications were filed between 2024 and early 2025, concentrated in Apulia, Sicily, and Calabria, where resource quality is strongest. Municipal veto power on landscape grounds continues to slow projects in heritage zones, creating regional disparities even as Italy aligns with its EU-wide 131 GW renewable target. Successful execution now depends on synchronized transmission upgrades that absorb intermittent inflows without driving up curtailment. Market participants who navigate local planning risks first can secure scarce grid nodes and lock in early-mover returns.
Grid-scale Battery Capacity Market Auctions (MACSE)
Terna’s 2024 MACSE auction awarded 2.3 GW of 10-year availability contracts, creating the first dedicated revenue stack for storage in the Italy power market. Winning projects, mainly 50 MW lithium-ion systems co-located with solar farms in Apulia and Sicily, address midday oversupply and evening peaks where price spreads topped EUR 100/MWh in summer 2025. The model sidelined pumped-hydro proposals that require multi-year construction and instead favored modular batteries deployable within 18 months. Terna’s 2026 auction is expected to introduce a six-to-eight-hour category, opening opportunities for flow batteries and compressed-air storage. Early project sponsors gain dual upside from arbitrage and capacity payments while shielding solar assets from curtailment, strengthening project bankability in a tight financing environment.
Coal Phase-Out by 2025 Creating Capacity Gap
Mainland coal plants totaling 5.7 GW will retire by end-2025, with Sardinian units following by 2029 once the Tyrrhenian Link is energized. The exit accelerates decarbonization: renewable generation hit 49% in 2024, but it tightens reserve margins during low-renewable spells, pushing Terna to procure 11.5 GW of capacity from Enel and others in the 2025 auction. Gas units will cover the gap, yet LNG price volatility remains a threat, underscoring the need for storage and demand-response scaling. Investors who can monetize flexibility services stand to benefit from rising peak-spread volatility until large-scale batteries reach critical mass after 2027.
REPowerEU-funded HVDC Projects (Tyrrhenian Link)
The EUR 3.7 billion, 1,000 MW Tyrrhenian Link broke ground in January 2025 with EUR 500 million in EU co-funding and is scheduled for commissioning in 2027-2028. Prysmian is manufacturing 480 km of XLPE submarine cable and will maintain the asset for 25 years, capturing long-run aftermarket revenue.[3]Prysmian Group, “Tyrrhenian Link Cable Contract,” prysmiangroup.com Once online, the link lets Sardinia import surplus mainland renewables, enabling the island’s final coal units to close and reducing diesel peaker dispatch that peaked at 15% of summer demand in 2024. Long lead times illustrate why HVDC benefits materialize only beyond 2027, yet securing social acceptance early locks in strategic interconnection capacity critical for 2030 renewable targets.
Restraints Impact Analysis*
| Restraint | (~) % Impact on CAGR Forecast | Geographic Relevance | Impact Timeline |
|---|---|---|---|
| Grid Congestion in Apulia & Sicily (≥36-month Delays) | -0.7% | Southern Italy (Apulia, Sicily, Calabria) | Short term (≤ 2 years) |
| Gas-Import Exposure to Geopolitical Shocks (≈90%) | -0.5% | National, acute during winter heating season | Medium term (2-4 years) |
| Offshore Wind Tender Under-realisation (Adriatic) | -0.3% | Adriatic Sea coastal regions (Apulia, Abruzzo, Marche) | Medium term (2-4 years) |
| Landscape-related Permit Litigation for Wind Farms | -0.4% | Heritage-sensitive zones (Tuscany, Umbria, Sicily) | Medium term (2-4 years) |
| Source: Mordor Intelligence | |||
Grid Congestion in Apulia & Sicily (≥36-Month Delays)
Apulia and Sicily host more than 40% of the renewable pipeline, yet 150 kV corridors designed for north-to-south flows now experience reverse overloads that triggered 8% curtailment in 2024, costing producers over EUR 200 million in lost revenue. Connection requests lodged in 2023 face ≥36-month delays as substations queue for reinforcement, forcing developers to accept interruptible agreements that shift curtailment risk onto project economics. Terna’s EUR 11 billion Hypergrid plan will reconductor southern lines and deploy dynamic-rating sensors by 2034, yet interim bottlenecks threaten to slow the forecast 8.9% renewable CAGR unless temporary capacity payments or grid-forming inverters mitigate risk.
Gas-Import Exposure to Geopolitical Shocks
Despite adding Algerian and Azerbaijani pipelines and floating LNG units in Piombino and Ravenna, Italy still imports about 90% of its gas, leaving power prices linked to TTF hub volatility that topped EUR 50/MWh during winter 2024-2025. Coal retirements deepen reliance on combined-cycle units, so any supply shortfall forces expensive LNG cargos into the merit order. Tariffs for unhedged households rose 15-20% in early 2025, and prolonged price spikes could dampen the 5.04% CAGR of the Italy power market.
*Our forecasts treat driver/restraint impacts as directional, not additive. The impact forecasts reflect baseline growth, mix effects, and variable interactions.
Segment Analysis
By Power Source: Renewables Outpace Thermal Replacement
Renewables accounted for 56.1% of installed capacity in 2025, the largest slice of the Italy power market, and are projected to grow at an 8.9% CAGR through 2031. Solar capacity surged by 5.3 GW in 2023, pushing the Italy power market size for solar past 30 GW; utility-scale projects in Apulia and Sicily contributed more than 60% of that buildout. The coal retirement removes 5.7 GW by 2025, cementing solar and onshore wind as primary replacements, though grid bottlenecks could temper momentum. Offshore wind remains marginal until 2028, and hydro expansion is capped by the EU Water Framework Directives, limiting diversification options.
Hydro still contributes 19 GW of reservoir and run-of-river assets, geothermal adds about 800 MW in Tuscany, and biomass-plus-waste holds 4 GW, giving Italy one of Europe’s most diversified renewable stacks. Combined-cycle gas turbines, presently 50 GW, will increasingly swing-dispatch to cover renewable droughts. Open-cycle gas peakers are being phased into synchronous condensers, and no nuclear program is under discussion. Altogether, the renewable surge underpins long-run decarbonization but heightens the urgency of storage and HVDC delivery so that the Italy power market can accommodate variable inflows without systemic risk.


By End User: Utilities Consolidate but C&I PPAs Rise
Utilities held 66% of installed capacity and electricity off-take in 2025, the dominant share of the Italy power market. Their segment is expanding at a 6.7% CAGR as they procure grid-scale renewables and battery capacity-market contracts that stabilize cash flows. Utilities secured most of the 2.3 GW MACSE awards in 2024, pairing batteries with solar farms to mitigate the curtailment that undermines merchant revenues in southern Italy.
Commercial and industrial buyers are still a smaller slice of Italy's power market size but are growing rapidly through 10- to 50-MW corporate PPAs priced below EUR 60/MWh, outpacing retail tariffs during gas-price spikes. Luxury houses, FMCG companies, and data-center operators are anchoring multi-GW renewable pipelines and forcing utilities to evolve their retail business models. Residential demand, buoyed by the Superbonus solar-plus-storage boom, now contributes a distributed-generation layer that meets up to 70% of annual household consumption for participating homes, squeezing utility margins yet widening the pool of dispatchable virtual power plants as battery adoption spreads.
Geography Analysis
Southern regions, led by Apulia and Sicily, house more than 40% of renewable applications, reflecting superior solar irradiance and onshore-wind resource quality.[4]: Autorità di Regolazione per Energia Reti e Ambiente, “Regional Demand Statistics,” arera.it These regions also bear the brunt of curtailment, underscoring why Terna has earmarked EUR 11 billion for Hypergrid reconductoring that will raise south-to-north transfer capacity by 50% once completed after 2030. The Italy power market size attributable to southern Italy is poised to grow fastest through 2031, provided congestion relief stays on schedule.
Northern industrial hubs, Lombardy, Veneto, and Emilia-Romagna, consume over 45% of national electricity, making them fertile ground for corporate PPAs that hedge volatile tariffs. Because local solar and wind resources are weaker, corporates import green power from the south, accepting basis risk on grid fees until north-bound HVDC reinforcements emerge. Distributed rooftop-PV adoption is highest here thanks to the Superbonus, flattening midday demand, and altering load-curve dynamics that utilities must price into retail tariffs.
Islands present distinct dynamics. Sardinia’s coal exit hinges on the Tyrrhenian Link energizing by 2028; until then, derogations allow limited coal burn to maintain grid stability. Sicily, already an export-oriented renewables hub, will gain interconnection redundancy via the link, enabling higher renewable penetration and reducing curtailment risk. Together, the islands showcase how HVDC and storage are core to balancing an archipelagic portion of the Italy power market without compromising reliability.
Regulatory Landscape
Italy's power sector is shaped by national implementation of EU energy and climate policy. ARERA regulates network tariffs, retail market rules, and service-quality standards, while GME runs wholesale electricity markets under integrated market rules. In February 2026, Decree-Law No. 21/2026 (converted into Law No. 49/2026) introduced measures aimed at reducing energy bills, alongside provisions intended to address grid-connection and infrastructure saturation constraints that have become acute in high-renewables regions such as Apulia and Sicily.
Regulatory changes in 2026 also targeted market-process efficiency and renewable auction visibility. ARERA Resolution 58/2026/R/EEL reformed supplier switching to enable 24-hour switching from December 1, 2026, supporting faster customer mobility and competition in retail supply. On the supply side, MASE updated tender calendars under the FER2 Decree framework (DM 19 June 2024) during April 2026, providing clearer competitive-procedure timelines for eligible renewable technologies. Italy also submitted an updated PNIEC to the European Commission in July 2026, reaffirming national decarbonization planning and the enabling role of grid reinforcement and interconnections.
Competitive Landscape
Italy hosts a moderately consolidated generation stack: the top five producers, Enel, Edison, A2A, ERG, and Acea, control roughly 60% of capacity, while international entrants such as RWE, Iberdrola, and ENGIE are expanding utility-scale solar portfolios in the south. Enel’s vertical integration is distinctive; its 3Sun cell plant in Sicily will reach 3 GW of annual output by 2026, capturing manufacturing margins in addition to generation and retail. This positions Enel to capitalize on EU domestic-content preferences under the Net-Zero Industry Act and adds security-of-supply leverage against Asian panel imports.
Strategic positioning revolves around capacity-market bids, battery co-location, and long-term PPAs. Enel, A2A, and ERG won most MACSE contracts, locking a stable revenue stream and mitigating solar curtailment. Edison and RWE formed a joint venture for 500 MW of onshore wind in Basilicata and Calabria, signaling a pivot away from legacy gas assets toward fast-tracked renewables that qualify under Decree 190/2024. Smaller developers like Renantis and Sonnedix pursue agrivoltaic and hybrid models that bypass congested nodes by pairing batteries and solar behind a single point of interconnection.
Equipment suppliers compete on technology differentiation. Vestas is repowering early-2000s wind fleets with 4- to 5-MW turbines that raise site output by up to 50%, while Prysmian secures long-run cable orders tied to Terna’s HVDC budget, embedding annuity income through 25-year maintenance deals. As floating offshore wind matures, Siemens Gamesa and Hexicon are trialing platform designs suited to 50-meter depths off the Tyrrhenian coast, although capex intensity still limits near-term scale.
Italy Power Industry Leaders
Enel SpA
Edison SpA
A2A SpA
ERG SpA
Terna SpA
- *Disclaimer: Major Players sorted in no particular order


Market Opportunities and Future Outlook
Grid expansion and interconnection investments are creating near-term opportunities in flexibility, congestion management, and connection-ready project structuring, especially in southern nodes where curtailment and multi-year connection queues have already affected project economics. Terna's development plan (2025-2034) anchors more than EUR 23 billion of network investments, while major HVDC links are moving from planning to procurement: in June 2026, Terna and Tunisia's STEG awarded Hitachi Energy a EUR 770 million contract for converter stations for the 600 MW Elmed HVDC interconnection. This expands cross-border exchange capability and strengthens the business case for renewables in Sicily and southern Italy.
Utility-scale renewables continue to be pulled forward by state-backed mechanisms and corporate offtake, with large single-site plants showing execution at scale. In June 2026, Iberdrola inaugurated the 243 MW Fenix solar plant in Sicily, highlighting bankable pathways for large projects in high-resource areas when grid access and permitting align. On policy, the European Commission cleared an Italian state-aid package in June 2026 (EUR 23 billion) to support the deployment of 37.15 GW of new renewable capacity, reinforcing the investable pipeline linked to competitive procedures and two-way contract structures. Storage is also gaining traction as a parallel build theme because it directly targets congestion and peak-price volatility: MASE authorizations for battery projects in mid-2026 (300 MW in June 2026 and 720 MW in July 2026 across multiple regions) support opportunities for BESS developers, integrators, and hybrid solar-plus-storage configurations that improve dispatchability and reduce curtailment exposure.
Recent Industry Developments
- July 2026: Italy's MASE authorized 720 MW of battery energy storage projects across five regions. The step broadens the near-term pipeline for grid-scale storage and supports Terna's reliability needs as coal exits and variable renewables increase their share of capacity.
- June 2026: Terna and Tunisia's STEG awarded Hitachi Energy a EUR 770 million contract for converter stations for the 600 MW Elmed HVDC interconnection. Advancing a direct-current link between Italy and North Africa strengthens system flexibility and increases the value of dispatchable capacity and storage in southern Italy.
- April 2024: Terna held its inaugural MACSE capacity-market auction for grid-scale storage, awarding 2.3 GW of 10-year availability contracts. The auction established a clearer revenue floor for battery projects and accelerated the shift from gas peakers toward storage-backed flexibility in congested zones such as Apulia and Sicily.


Research Methodology Framework and Report Scope
Market Definition and Coverage
For this methodology, the Italy power market is defined as the net installed electricity generation capacity physically located in Italy, measured in gigawatts, across conventional and renewable generation assets that feed the grid or serve captive loads.
Scope exclusions: We exclude transmission and distribution infrastructure, electricity retailing and trading value, and imported electricity flows through interconnectors from the market total.
Segmentation Overview
- By Power Source
- Thermal (Coal, Natural Gas, Oil and Diesel)
- Nuclear
- Renewables (Solar, Wind, Hydro, Geothermal, Biomass & Waste, Tidal)
- By End User
- Utilities
- Commercial and Industrial
- Residential
- By T&D Voltage Level (Qualitative Analysis only)
- High-Voltage Transmission (Above 230 kV)
- Sub-Transmission (69 to 161 kV)
- Medium-Voltage Distribution (13.2 to 34.5 kV)
- Low-Voltage Distribution (Up to 1 kV)
Data Sources, Market Sizing, and Validation
Desk Research
Desk research was used to build the capacity model backbone, so that each installed-base number can be traced back to a public series. We relied on official sources, including Italy grid and system operator publications, national statistical releases, Eurostat energy balances, and energy regulator disclosures, to anchor historical capacity, generation, and demand signals.
To keep assumptions grounded in project reality, we also reviewed power plant permitting and auction notices, policy updates from relevant ministries, and peer-reviewed or technical publications on capacity factors and retirement timelines. Company annual reports and investor presentations were checked for major commissioning milestones, and a paid subscription for news and financials was used to avoid missing time-sensitive project changes. The sources listed here are illustrative and not exhaustive, and other public materials were also used for data collection, validation, and research clarification.
Primary Interviews and Surveys
Primary work focused on confirming which projects are grid-connected versus still announced, and on sanity-checking retirement schedules and commissioning delays. We spoke with a mix of utilities, developers, engineering-facing stakeholders, and industry experts across Italy to validate the desk findings, and then to stress-test the key modeling assumptions before the totals were finalized.
Distribution of primary research fieldwork respondents
| Company type | Respondent position |
|---|---|
| Top tier: 38% | CXOs: 15% |
| Mid tier: 42% | Functional/Unit leaders: 27% |
| Smaller Players: 20% | Managers: 58% |
Market-Sizing & Forecasting
The core sizing is built using a top-down capacity reconstruction, where the national installed-base series is rebuilt year by year from official capacity registers and grid-connection updates, and then mapped to the market definition in gigawatts. Once the master capacity line is stable, we corroborate it using selective bottom-up approximations, including a roll-up of major announced additions and retirements and sampled checks of capacity additions by technology.
Several practical inputs were used to keep the model grounded, including technology-wise commissioning pipelines, retirement and life-extension timelines, and utilization patterns that indicate whether capacity is likely to remain online. Policy markers such as auction awards and incentive windows were also incorporated. Grid-connection timing, curtailment discussions, and permitting lead times were used as reality checks, since these factors often explain why planned projects do not convert into installed capacity in the expected year.
For forecasting, scenario analysis was applied around the project pipeline and retirement pace, and the scenarios were calibrated based on what interviewees considered feasible under current permitting speed, financing conditions, and grid constraints. Where plant-level details were incomplete, gaps were handled through conservative timing assumptions and by aligning the residual capacity to the latest official totals, so the series stays consistent.
Data Validation & Update Cycle
Outputs are validated by comparing the installed-capacity trend with independent signals such as generation mix shifts, grid-connection announcements, and policy-linked capacity awards, and then checking whether the implied changes look plausible. If a large year-on-year jump appears, we recheck the drivers, then conduct targeted re-contacts to confirm whether the change is commissioning, reclassification, or a data revision.
Before sign-off, the model goes through multi-step analyst reviews, including variance checks against historical baselines and consistency checks across technologies. Reports refresh annually, with interim updates when material events occur, such as major auction outcomes, sudden policy changes, or large project delays. Right before delivery, we run a fresh scan so clients receive the latest updated view.
Mordor Intelligence's Italy Power Market Size Versus Other Published Estimates
Published market estimates for Italy power often do not match because they measure different things, and they also set assumptions based on different dates. Some sources describe installed capacity, while others move to revenue-style totals, which changes the meaning of the market size even when the title sounds similar.
Key gap drivers are refresh cadence and timing conventions, since late-year grid-connection revisions, reclassifications, and FX conversion dates can shift the final USD figure, and some publications also mix capacity with electricity retail value. The cross-check that keeps the series stable is a final pass against the latest capacity register and commissioning updates just before sign-off, and that refresh-led step is applied by Mordor Intelligence.
Benchmark comparison
| Source | Market Size | Gaps in Research Methodology |
|---|---|---|
| Mordor Intelligence | USD 155.68 B (2026) | |
| Global Consultancy A | USD 105.60 B (2024) | Uses a value-based definition anchored to a 2024 base year, and it can blend electricity sales value with power sector activity, which shifts the total away from a capacity-grounded series. |
| Industry Publisher B | USD 145.40 B (2025) | Reports the market in gigawatts for 2025, which is closer in unit choice, but the pipeline timing and treatment of reclassifications are not clearly linked to grid-connection updates, so commissioning slippage can land in different years. |
Across the three figures, the spread is mainly explained by unit choice (capacity versus value), base-year lock timing, and whether grid-connected assets are separated cleanly from broader electricity-market value. With inputs and checks tied to observable capacity additions and retirements, the resulting number stays easier to trace and repeat year to year.


Key Questions Answered in the Report
What is the current size of the Italy power market?
Installed capacity is 155.68 GW in 2026 and is set to reach 199.10 GW by 2031.
Which segment holds the largest Italy power market share?
Renewables led with 56.1% of capacity in 2025 and continue to expand fastest.
How fast will the utilities segment grow?
Utility off-take is forecast to expand at a 6.7% CAGR through 2031 as capacity-market and storage revenues rise.
What role do batteries play in Italy’s power mix?
Grid-scale batteries won 2.3 GW of ten-year MACSE contracts in 2024, providing flexibility to integrate intermittent renewables.
When will Sardinia fully exit coal generation?
Final coal units are scheduled to close by 2029 once the Tyrrhenian Link HVDC cable is operational.
Page last updated on:


 Your data is secure and never sold or shared.


