
Market Overview
| Study Period | 2020 - 2031 |
|---|---|
| Forecast Data Period | 2026 - 2031 |
| Base Year Market Size (2025) | USD 3.34 Billion |
| Market Size (2026) | USD 3.61 Billion |
| Market Size (2031) | USD 4.76 Billion |
| Growth Rate (2026 - 2031) | 5.69 % |
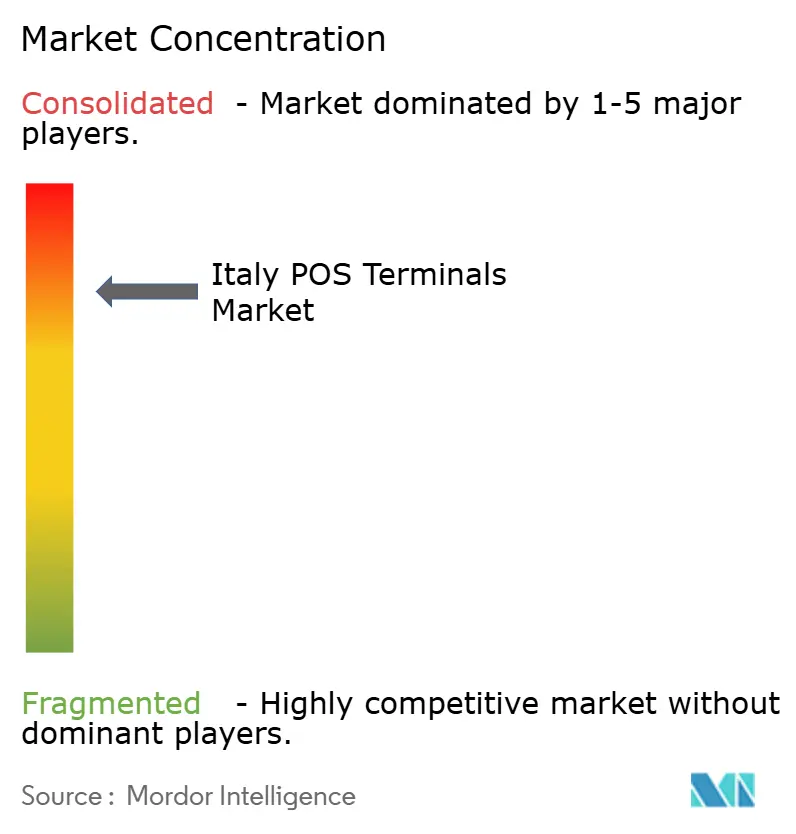
| Market Concentration | Medium |
Major Players *Disclaimer: Major Players sorted in no particular order Image © Mordor Intelligence. Reuse requires attribution under CC BY 4.0. | |
Italy POS Terminals Market Analysis by Mordor Intelligence
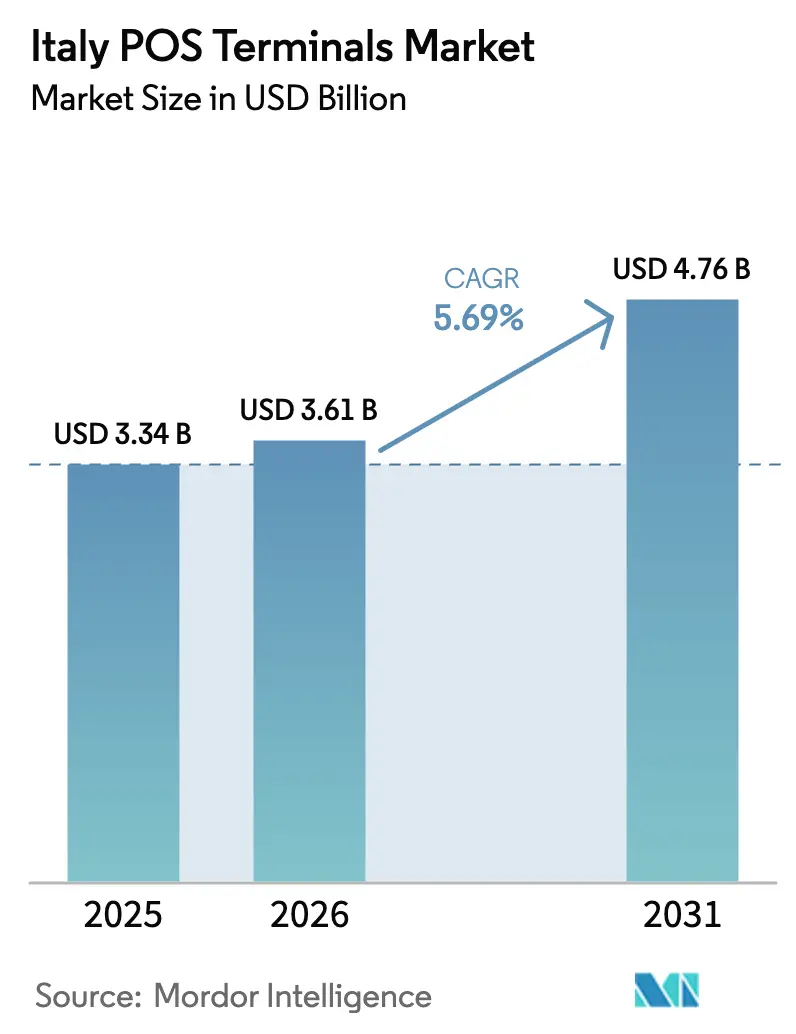
The Italy POS terminals market size is expected to increase from USD 3.34 billion in 2025 to USD 3.61 billion in 2026 and reach USD 4.76 billion by 2031, growing at a CAGR of 5.69% over 2026-2031. Structural incentives rather than consumer hesitation now define demand: Rome’s 2026 rule that connects every POS device to a telematic cash register recasts fiscal compliance as a hard requirement, while the 30% tax credit on card-processing fees for merchants below EUR 400,000 (USD 452,000) in annual turnover transforms digital acceptance into a subsidized revenue stream. An 80% contactless penetration rate achieved in 2024, well ahead of the euro-area average, signals a payment culture ready for tap-to-pay ubiquity, yet merchant infrastructure and acquirer mark-ups still temper roll-out speed. Consolidation among service providers, illustrated by the EUR 15 billion (USD 17 billion) Nexi-SIA merger, bundles hardware, loyalty software, and acquiring in one contract, increasing switching costs but streamlining on-boarding for small businesses. Simultaneously, semiconductor shortages and PCI-PTS v6 certification queues lengthen hardware delivery cycles, encouraging merchants to favor software-based upgrades when possible.
Key Report Takeaways
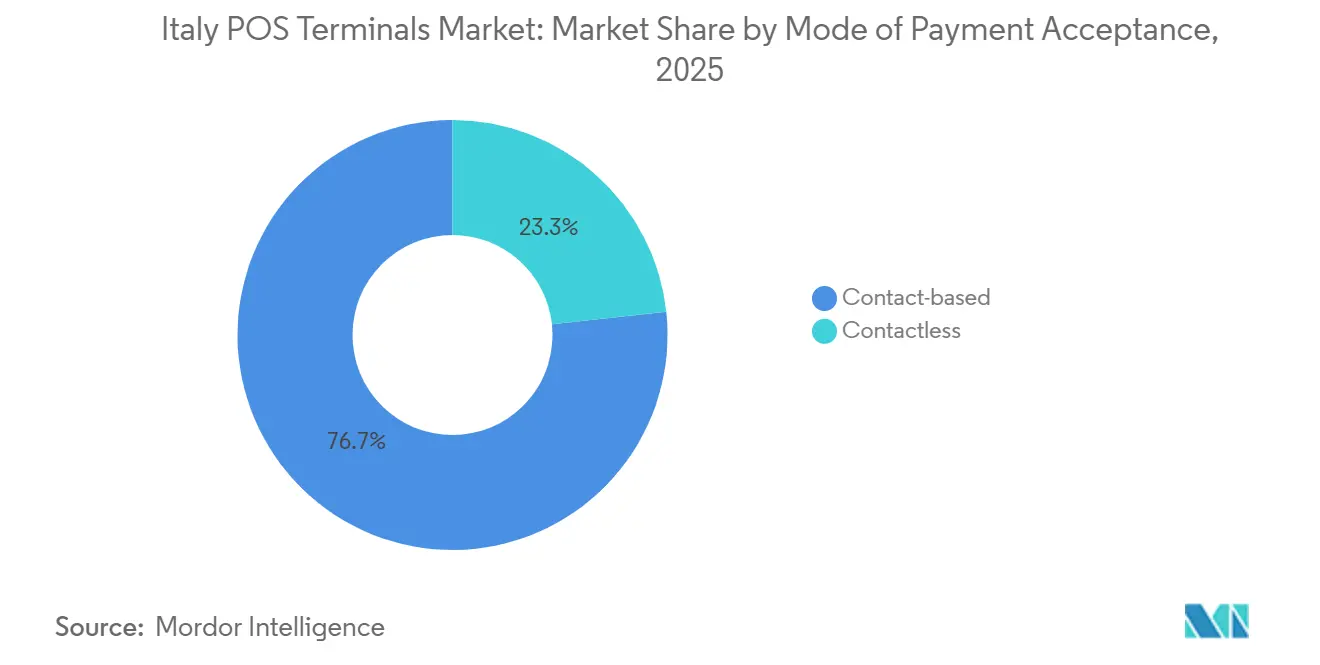
- By mode of payment acceptance, contactless transactions held 76.72% revenue share in 2025, while the same segment is projected to expand at a 5.81% CAGR through 2031.
- By POS type, fixed countertop systems accounted for 71.68% of the Italy POS terminals market size in 2025, whereas portable devices are forecast to grow at a 6.54% CAGR between 2026-2031.
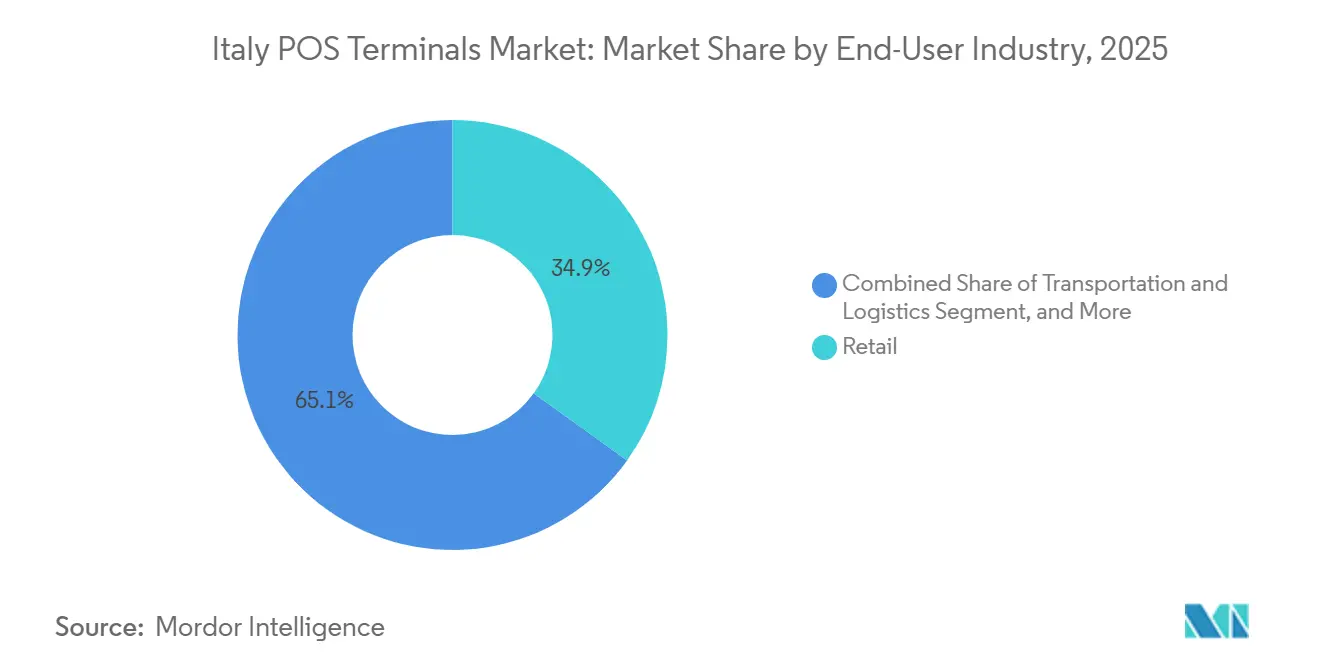
- By end-user industry, retail led with 34.92% of the Italy POS terminals market share in 2025, while healthcare is advancing at a 7.27% CAGR to 2031.
Note: Market size and forecast figures in this report are generated using Mordor Intelligence’s proprietary estimation framework, updated with the latest available data and insights as of January 2026.
Italy POS Terminals Market Trends and Insights
Drivers Impact Analysis*
| Driver | (~) % Impact on CAGR Forecast | Geographic Relevance | Impact Timeline |
|---|---|---|---|
| mPOS Adoption Accelerated by Italy's Small-Merchant Tax Incentives | +1.2% | National, southern micro-merchant clusters | Medium term (2-4 years) |
| Mandatory Electronic Invoice and Fiscal Receipt Laws | +1.0% | National, retail and hospitality | Short term (≤ 2 years) |
| Contactless and NFC Penetration Outpacing Cardholder Base | +0.9% | Urban centers, nationwide | Medium term (2-4 years) |
| Migration to Cloud POS for Omnichannel Retail | +0.7% | Fashion, electronics, specialty retail | Long term (≥ 4 years) |
| Banking Consolidation Fueling Integrated Payments (Nexi-SIA Merger) | +0.6% | Northern commercial hubs | Long term (≥ 4 years) |
| Tourism Rebound Driving Hospitality POS Upgrades | +0.5% | Venice, Florence, Rome, coastal resorts | Short term (≤ 2 years) |
| Source: Mordor Intelligence | |||
mPOS Adoption Accelerated by Italy's Small-Merchant Tax Incentives
Italy’s 30% tax credit on acquiring fees lowers out-of-pocket costs for the nation’s 1.5 million sole proprietors, compressing the pay-back period for mobile card readers from 18 months to less than a year. Device vendors such as SumUp and myPOS harness the incentive by bundling flat-rate pricing with same-day settlement, an approach that sidesteps the tiered MDR grids prevalent among incumbent acquirers. Southern regions, Campania, Calabria, and Sicily, shifted from more than 75% cash usage in 2022 to near-parity with the north by 2025, narrowing the regional digital-payments gap by 8 percentage points.[1] The subsidy’s sunset clause in 2026, however, threatens to stall deployment among the most price-sensitive micro-merchants, making renewal a key policy variable. Hardware makers respond by pushing lower-cost, Android-based terminals that double as inventory scanners, ensuring price elasticity does not reverse adoption gains.
Mandatory Electronic Invoice and Fiscal Receipt Laws
The 2026 requirement to route every sales receipt through the Sistema di Interscambio (SDI) compels businesses to upgrade or retrofit 3.27 million terminals, many of which lack APIs for real-time data exchange.[2] Vendors now pre-install SDI modules and cloud connectors, converting the POS device into a compliance gateway that automatically archives VAT data and invoice images. Retail and hospitality chains began early roll-outs in 2024 to avoid fines, prompting secondary demand for automated patch-management services that push firmware updates across multiple stores. Integration challenges persist because fiscal printers from Epson, Custom, and Olivetti use proprietary protocols, adding EUR 100-200 (USD 119-237) per lane to bridge software. Nevertheless, linkage between payment capture and tax reporting improves cash-flow transparency, a benefit that resonates with lenders and insurance providers underwriting small businesses.
Contactless and NFC Penetration Outpacing Cardholder Base
Italy reached 80% contactless share of card transactions in 2024, outstripping the euro-area mean of 62%. Yet the cards-per-capita ratio remains below 2.0, indicating deep rather than broad usage. This saturation ceiling forces terminal vendors to pivot toward NFC-enabled mobile wallets and wearables, which bypass the need for plastic issuance. Public-transport deployments act as social proof: Rome’s ATAC augmented validators to accept JCB and UnionPay in 2024, driving a spike in tourist ticket sales.[3] Milan’s ATM registered a 35% year-on-year jump in digital tickets after fitting 1,500 on-board readers in 2023. As consumers normalize tap-to-pay for micro-fares, merchants in adjacent sectors treat NFC acceptance as table stakes, reinforcing the migration away from mag-stripe and signature workflows.
Migration to Cloud POS for Omnichannel Retail
E-commerce penetration rose from 13% of Italian retail sales in 2022 to 18% in 2025, spurring chains to unify web and in-store checkouts. Cloud POS platforms, epitomized by the December 2025 Nexi-Zucchetti tie-up, offer real-time inventory sync, loyalty accrual, and analytics via a browser dashboard, removing the silos that hamper legacy tills.[4] Retailers that shifted to cloud architecture trim PCI-DSS audit scope because cardholder data is tokenized off-site, cutting compliance consulting fees by up to 30%. The model’s revenue-share pricing, usually 2-3% of gross sales, suits higher-margin apparel and electronics but strains grocery and discount stores where net margins rest below 1%. Still, statutory demands for software-managed fiscal receipts drive even thin-margin merchants to consider cloud migration as an unavoidable compliance cost rather than a discretionary upgrade.
Restraints Impact Analysis*
| Restraint | (~) % Impact on CAGR Forecast | Geographic Relevance | Impact Timeline |
|---|---|---|---|
| High Interchange and MDR Fees on Low-Value Transactions | -0.8% | Nation-wide, groceries, fuel, tobacco | Medium term (2-4 years) |
| Fragmented Legacy Fiscal Printer Infrastructure | -0.5% | Retail and hospitality segments | Short term (≤ 2 years) |
| Cybersecurity Breach Concerns Among SMEs | -0.4% | All regions, limited IT resources | Medium term (2-4 years) |
| Supply-Chain Lead-times for PCI-PTS v6 Hardware | -0.3% | Global parts, local deployment | Short term (≤ 2 years) |
| Source: Mordor Intelligence | |||
High Interchange and MDR Fees on Low-Value Transactions
EU Regulation 2015/751 caps interchange at 0.2% for debit and 0.3% for credit, but Italian merchants still shoulder all-in processing costs of 1.5-2.5% once acquirer mark-ups and terminal rentals are factored in. For cafés selling EUR 2.00 (USD 2.37) espressos, fixed per-transaction fees as high as EUR 0.10 (USD 0.12) can erase margin entirely, prompting minimum-purchase rules that nudge consumers back to cash. The government’s EUR 30 (USD 35.6) fine plus 4% of invoice value for refusing cards has improved visibility rather than economics, creating resentment among low-ticket operators. Acquirers struggle to cut rates further because network assessments from Visa and Mastercard are non-negotiable, shifting pressure toward hardware subsidies that vertically-integrated players like Nexi can absorb. Without a cost-down mechanism, fee sensitivity may slow mPOS adoption once tax credits disappear.
Fragmented Legacy Fiscal Printer Infrastructure
Roughly 2 million fiscal printers, many more than a decade old, must pair with upgraded POS terminals to satisfy the 2026 SDI real-time reporting rule. Each brand speaks a proprietary command set, so middleware or retro-fit kits add EUR 100-200 (USD 119-237) and slow each transaction by up to half a second, a latency consumers notice in peak retail periods. Smaller acquirers lack the engineering capacity to maintain twenty-plus driver packages, ceding ground to integrated bundles that combine printer, POS, and service contract in one lease. Merchants confronting end-of-life devices must decide between patching aging hardware or investing EUR 500-1,500 (USD 593.6-1,781) in an entirely new fiscal stack, a capital hit that many independent retailers defer until inspectors visit. This fragmentation undermines vendor competition because once a merchant locks into a specific printer-POS ecosystem, switching carries both financial and training costs.
*Our forecasts treat driver/restraint impacts as directional, not additive. The impact forecasts reflect baseline growth, mix effects, and variable interactions.
Segment Analysis
By Mode of Payment Acceptance: Contactless Dominance Reshapes Merchant Expectations
Contactless transactions captured 76.72% of overall acceptance volume in 2025, mirroring consumer appetite for frictionless, card-on-file experiences. That share is forecast to climb steadily at a 5.81% CAGR through 2031, propelled by wallet-based credentials and wearables that extend NFC beyond plastic cards. Italy POS terminals market size expansion in this segment dovetails with Rome’s public-transport upgrades, where contactless validators eliminated the need for paper tickets and set behavioral norms commuters carry into retail. Mobile-first tourists arriving in post-pandemic record numbers reinforce demand peaks in heritage cities, while the European Central Bank’s EUR 50 (USD 59.4) contactless limit renders PIN-less payments viable for most daily spend. Legacy contact-based workflows persist only where value exceeds the tap ceiling or where age-based verification is compulsory, such as jewelry and regulated goods. As saturation nears, acquirers shift focus from volume to value-added data services that monetize contactless behavioral insights, a strategy visible in Nexi’s spend-analytics dashboards bundled into 2025 contracts. For merchants, the incentive pivots from hygiene to queue-time reduction, measured in purchases per labor hour, which aligns directly with profitability.
The residual contact-based segment now functions as a compliance back-stop rather than a growth engine. AML and KYC checks linked to chip-and-PIN flows remain essential for high-ticket or cross-border refunds, but device makers embed dual-interface chips so that no countertop terminal ships without NFC. Consumer education campaigns led by banks in 2024 and 2025 further erode reluctance among seniors, while social-transfer programs disburse welfare benefits via prepaid contactless cards, lifting rural usage. Consequently, the Italy POS terminals market embeds contactless capability as a default specification, making older swipe-only hardware obsolete well ahead of physical end-of-life expectations.
By POS Type: Portable Systems Gain Ground in Service-Intensive Verticals
Fixed countertop stations dominated deployment with a 71.68% share in 2025, sustained by supermarket, department-store, and QSR environments where peripheral density outweighs mobility needs. Their robust casings, thermal printers, and multiple I/O ports keep integration costs predictable, which is crucial for chains running thousands of lanes nationwide. Still, portable terminals are projected to post the segment’s fastest 6.54% CAGR, carving share where bedside or tableside service shortens wait-times and raises average tickets. This growth illustrates a shift in the Italy POS terminals market size allocation from single-purpose hardware toward multipurpose smart devices. Android-based handhelds double as barcode scanners or loyalty sign-up kiosks, reducing device sprawl on the merchant countertop.
Healthcare illustrates the portable thesis vividly. Pilot programs in 2024 allowed outpatient clinics to collect co-payments at bedside, reducing registration bottlenecks and lifting cash-flow predictability. Hospitality follows closely: hotels lining the Amalfi Coast swap paper folios for tablet checkouts that email invoices in SDI format, aligning with 2026 compliance without burdening front-desk staff. Fixed systems, however, remain mandated where telematic cash registers draw substantial power or where connectivity relies on Ethernet rather than cellular back-haul. Hybrid roll-outs, tablets paired with fixed printers, allow mid-sized retailers to add seasonal capacity without breaching existing lease covenants, demonstrating that flexibility, not outright hardware displacement, defines the competitive narrative.
By End-User Industry: Healthcare Emerges as Growth Catalyst
Retail commanded 34.92% of deployments in 2025, naturally reflecting its sheer store-count dominance across grocery, fashion, and home-improvement formats. Yet the Italy POS terminals market share profile is tilting toward healthcare, where a 7.27% forecast CAGR captures tele-consultation fees, at-home nursing visits, and private clinic modernizations previously outside the card ecosystem. Cloud-linked portable units now interface directly with electronic health-record systems, allowing practitioners to charge, code, and reconcile in one workflow, a capability prized by insurers auditing claim accuracy. The retail sector is hardly static: omnichannel loyalty programs push chains to embed QR issuance and scan-to-pay inside the same device, marginally raising the average selling price per unit.
Tourism-rich hospitality layers on incremental demand. Hotel and restaurant operators exploited the 2024 visitor rebound by upgrading to multi-currency enabled terminals that settle in real time, avoiding FX margin leakage. Transportation contributes an emerging but meaningful tailwind; investment of EUR 3.0 million (USD 3.4 million) by Bologna’s TPER into EMV validators in 2023 proves mobile devices can handle five-million-plus annual ticket scans without failure. Government kiosks, education canteens, and live-event venues round out long-tail verticals, each scaling gradually yet cumulatively adding volume that densifies acquirer networks and lowers per-transaction telecom costs.

Geography Analysis
Northern Italy anchors 55-60% of installed POS devices, a function of higher per-capita GDP and dense retail corridors radiating from Milan. Lombardy’s regional tax agency rigorously enforces SDI compliance, nudging merchants to modernize ahead of the 2026 deadline, while urban commuters acclimate to contactless fares on Milan’s 1,500 bus validators. Central provinces centered on Rome and Florence lean on tourism to justify upgrades; ATAC’s expansion to JCB and UnionPay acceptance in 2024 encouraged hoteliers and restaurants to follow suit, locking international cardholders into frictionless spend loops. The Italy POS terminals market thus mirrors regional GDP dispersion, yet fiscal incentives have started to compress disparities.
Southern regions exhibit the steepest growth curves. A 30% tax credit for card fees collapsed the cost barrier for micro-enterprises and lifted acceptance density in Campania and Sicily, shrinking the north-south digital divide by eight percentage points between 2023 and 2025. Enforcement remains lighter, so some single-location retailers postpone upgrades until inspectors arrive, elongating the sales cycle for acquirers. Seasonal surges along the Amalfi Coast and Sardinia compel merchants to favor portable terminals rented for summer months, a model that eases cap-ex but presses acquirers to develop usage-based pricing. Island geographies suffer from higher telecom back-haul costs, inflating total cost of ownership by 15-20% and advantaging national players able to negotiate wholesale data bundles.
White-space persists across regional rail, municipal parking, and open-air markets where POS penetration stays under 50%. Vendors courting these sectors stress ruggedized casings and offline-first operation that synchronizes once the signal returns, features essential for hillside towns where fiber coverage lags. The Italy POS terminals market therefore advances unevenly but irrevocably, with policy levers, tourism flows, and telecom infrastructure jointly dictating the adoption slope.
Regulatory Landscape
Italy's POS terminal ecosystem is shaped by EU payments rules and Italian fiscal and public-payment mandates. Payment services operate under the PSD framework as implemented in Italy (Legislative Decree 11/2010). The Bank of Italy oversees retail payment services and systems and sets security and operational expectations for supervised entities. On the demand side, the report's 2026 fiscal-compliance shift that links POS workflows with electronic invoicing and fiscal receipts raises the bar for secure device software, auditability, and end-to-end transaction traceability across acquirers and merchants.
Public-sector payment digitization also affects terminal requirements. Under the Digital Administration Code (CAD), notably Article 5, public administrations must accept payments through ICT channels via pagoPA, with AgID issuing technical guidelines that standardize identifiers and communication flows between payment service providers (PSPs) and creditor entities. These rules support POS-based collection of public-service payments when the acquirer and software stacks align with pagoPA technical specifications and interoperability standards, including ISO 20022 messaging referenced in the pagoPA documentation.
Value Chain Analysis
The Italy POS terminals value chain runs from device OEMs and component suppliers through certification and security ecosystems, software developers, acquirers/PSPs, and merchant integrators that deploy and support terminals across retail, hospitality, healthcare, and transport. At the transaction layer, PSPs connect merchants to international card and wallet authorization circuits, including Visa, Mastercard, American Express, and PayPal, while domestic acquiring leaders bundle gateway, fraud tools, analytics, and hardware to reduce onboarding friction for SMEs.
A distinct Italian layer sits around public-payments and compliance interfaces. pagoPA serves as the interoperability node linking creditor entities (public administrations) and enabled PSPs, with technology intermediaries handling technical integration and message processing for either side. In parallel, the 2026 SDI-linked fiscal receipt and invoicing workflow adds further middleware demand (POS-to-SDI modules, connectors to telematic cash registers and fiscal printers, and remote device management). That reinforcement tends to elevate local integrators and software partners, including ERP and retail-suite providers, that package a compliant end-to-end offer rather than selling standalone hardware.
Competitive Landscape
Nexi commands roughly 35-40% of merchant acquiring and terminal deployment, leveraging its 2021 absorption of SIA to bundle gateway, fraud tools, and hardware under a single contract, locking in small businesses that prize one-stop service. Worldline’s Ingenico line, Verifone’s V-series, and PAX Technology fight for share through faster PCI-PTS v6 certification and modular add-ons, yet their go-to-market depends heavily on Italian integrators such as Zucchetti. SumUp and myPOS angle for the 1.5 million freelancers outside traditional banking by pairing flat-rate fees with no-strings hardware, trading feature depth for transparency. This fragmentation means competition is asymmetric: acquirers cross-subsidize hardware, while stand-alone manufacturers must rely on differentiation in form factor or vertical specificity.
Regulation shapes rivalry. The 2026 SDI mandate acts as a moat because vendors with Italian engineering teams can ship compliant firmware months ahead of global peers. Nexi’s December 2025 pact with Zucchetti embeds payments inside ERP modules, proving that software compatibility, not raw terminal specs, increasingly seals the deal. Transportation validators form a niche battlefront: Axerve and PAX chase contracts from intercity bus operators still mired in paper ticketing. Cybersecurity posture is rising in procurement checklists after a rash of SME malware breaches in 2024, driving interest in devices supporting remote-key injection and multi-factor admin log-ins. As vertical SaaS providers from booking to invoicing embed payments directly, the Italy POS terminals market witnesses convergence between banking and software, pressuring incumbents to defend share with loyalty, lending, and analytics add-ons.
Strategic moves underline the contest. Nexi’s November 2025 launch of a working-capital advance tied to terminal throughput illustrates data-driven monetization absent in hardware-alone models. Verifone’s June 2024 V400c rollout, pre-certified for SDI, shows time-to-compliance as a sales lever. Olivetti’s alliances bundle fiscal printers and terminals, capturing retrofit spend that smaller acquirers cannot finance. Fintech entrants like Adyen seek to bypass domestic processors altogether by offering a unified European gateway, but local compliance quirks make partnerships unavoidable, preserving a measure of insulation for incumbents.
Italy POS Terminals Industry Leaders
-
NCR Corporation
-
Panasonic Corporation
-
NEC Corporation
-
Casio Computer Co. Ltd
-
Ingenico ( Worldline SA )
- *Disclaimer: Major Players sorted in no particular order
Market Opportunities and Future Outlook
Compliance-driven refresh cycles and the public-payments ecosystem create whitespace beyond classic retail checkout. The report's 2026 SDI-linked mandate turns fiscal reporting into a required POS capability, which raises demand for pre-integrated software stacks, including SDI modules, device-fleet patching, and connectors that bridge proprietary fiscal-printer protocols. This supports vendors and integrators that reduce per-lane integration effort and can support multi-brand legacy estates, especially among smaller acquirers and independent merchants that lack engineering resources to maintain numerous driver packages.
A second opportunity is the combination of POS deployments with public-service collections. CAD Article 5 and the pagoPA technical guidelines, governed under AgID with pagoPA S.p.A. operating the platform, standardize how PSPs and creditor entities interconnect. pagoPA documentation also outlines integration pathways for payments at physical points of sale. Worldline's June 2026 launch of PagoQUI, enabling PagoPA bill payments at merchant locations through Android POS integration without added hardware, provides evidence that public-service payments are being productized for proximity commerce. It broadens use cases for Android-based terminals in pharmacies, neighborhood retailers, and service counters where collecting government-related payments can add incremental traffic and fee income alongside everyday card acceptance.
Recent Industry Developments
- June 2026: Worldline launched PagoQUI in Italy, an Android POS-integrated service enabling PagoPA public-service bill payments at merchant locations without extra hardware. The launch extends integration of payments with public services, accelerates Android-based SoftPOS adoption, and gives merchants a one-stop solution.
- March 2026: Worldline expanded acquiring network in Italy to 74 partner banks serving over 200,000 merchants with nearly €40 billion annual volume. The expansion deepens domestic merchant reach and reduces onboarding friction; reinforces dominant market position via integrated services.
- February 2026: NEC Corporation developed NEC Dokodemo POS (NEC Anywhere POS), enabling smartphones to function as POS terminals for item registration and payment. The development reflects a shift toward software-based, smartphone-delivered POS and may affect hardware demand and fragmentation in Italy via portable softPOS concepts.
Research Methodology Framework and Report Scope
Market Definition and Coverage
This market covers the spending tied to POS terminals used by Italian merchants to accept in person payments, including fixed and mobile or portable devices that support card present checkout and related acceptance.
Scope exclusions: This sizing excludes pure e-commerce checkout tools and unrelated back office systems that do not act as payment acceptance terminals.
Segmentation Overview
- By Mode of Payment
- Contact-based
- Contactless
- By POS Type
- Fixed Point-of-Sale Systems
- Mobile and Portable Point-of-Sale Systems
- By End-User Industry
- Retail
- Hospitality
- Healthcare
- Transportation and Logistics
- Other End-User Industries
Data Sources, Market Sizing, and Validation
Desk Research
Desk research helped us build the base demand picture and run rule checks before speaking with market participants. We used public payment system statistics and adoption signals from sources such as the Bank of Italy payment system publications and European Central Bank datasets on POS terminals.
To connect terminal demand with usage on the ground, we also reviewed government and regulator materials related to digital payments, plus trade and economics releases such as ISTAT indicators that track retail and services activity. Import and export patterns for relevant electronics categories were checked using customs-style datasets where available, and patent databases were reviewed to understand how fast contactless and mobile acceptance features are evolving. We also reviewed public company filings, investor presentations, and reputable business press to confirm product launches, distribution changes, and pricing direction. These desk sources are illustrative only, and many other documents were also used for collection, validation, and clarification.
Primary Interviews and Surveys
Primary work was used to pressure test the desk findings and close gaps around pricing, replacement cycles, and channel mix. We spoke with a mix of device suppliers, payment service participants, distributors, and merchant side users across Italy, and then ran follow ups where numbers did not reconcile cleanly across sources.
Distribution of primary research fieldwork respondents
| Company type | Respondent position |
|---|---|
| Top tier: 38% | CXOs: 21% |
| Mid tier: 41% | Functional/Unit leaders: 28% |
| Smaller Players: 21% | Managers: 51% |
Market-Sizing & Forecasting
Sizing starts from a top-down build that reconstructs Italy demand using active POS terminal counts, merchant acceptance growth, and card present payment adoption signals, which are then translated into annual device and service value pools. To keep it grounded, we corroborate totals with selective bottom-up approximations such as sampled average selling price by device type, channel checks on shipments to merchants, and roll ups from a limited set of supplier disclosures where they are available.
A few inputs that materially shape the model include the growth in active POS terminals (used at least once a year), contactless penetration at checkout, the shift toward portable devices for small merchants, replacement cycles driven by security and certification updates, and the typical mix between outright device sale and rental style pricing structures. Where direct unit information is missing for a slice of the market, we use conservative proxy logic based on merchant counts and acceptance intensity, and then adjust after interview feedback.
For forecasting, scenario analysis is used with a base case built from consensus ranges gathered in interviews, especially on small merchant onboarding and device refresh timing. Short term volatility is handled through simple smoothing of ASP movement and shipment timing so one off promotions or delayed rollouts do not distort the trend line.
Data Validation & Update Cycle
Outputs are checked through multiple passes before sign-off, where totals are compared against independent signals such as terminal density trends, payment volume direction, and import and shipment indications. If a variance looks too large for any sub block, the assumptions are reopened and the related interview notes are reviewed, followed by a re-contact when needed.
Each report is refreshed annually, and interim updates are made when a material event changes pricing, regulations, or merchant adoption. Right before delivery, we run a final update pass so the latest public statistics and recent market developments are reflected in the numbers clients receive.
Mordor Intelligence's Italy Pos Terminals Market Estimate Compared With Other Published Estimates
Published values for Italy POS terminals can look far apart because the scope is not always described the same way, and because pricing and replacement assumptions vary by source. Differences usually show up around whether services are counted with devices, how refurbished units are treated, and which year is used as the base for currency and inflation.
POS software subscriptions and payment processing revenues sit outside Mordor Intelligence's scope here, which makes the estimate less sensitive to bundling practices that can inflate a broader payments technology figure. The spread also comes from ASP setting, where some publications keep a flat price curve, while others model a step up as portable contactless units become more common in small merchants, followed by different refresh cadences when new mandates and certification changes are expected.
Benchmark comparison
| Source | Market Size | Gaps in Research Methodology |
|---|---|---|
| Mordor Intelligence | USD 3.34 B (2025) | |
| Industry Analyst Brief A | USD 0.74 B (2023) | Appears closer to a hardware-only shipment value view, which can undercount rental style pricing and services tied directly to terminal deployment, and it can also treat replacement cycles as slower. |
| Industry Analyst Brief B | USD 0.82 B (2025) | Likely reflects a narrower POS terminal spend definition with flatter pricing assumptions, and it may not fully capture the higher mix of portable devices and compliance driven refresh activity. |
Overall, the main takeaway is that narrower hardware shipment scopes tend to land well below broader terminal spend pools, and different price and refresh assumptions push the totals up or down quickly. By keeping the inputs tied to observable terminal activity and cross-checking them through interviews, the resulting figure stays traceable to clear variables and repeatable steps.
Key Questions Answered in the Report
How large will Italy's POS terminal opportunity become by 2031?
The market is projected to reach USD 4.76 billion by 2031, reflecting a 5.69% CAGR from 2026.
Which acceptance mode drives most device demand today?
Contactless transactions already account for 76.72% of volume in 2025 and keep expanding due to NFC wallets and tourist usage.
Why are portable terminals growing faster than fixed units?
Healthcare, hospitality, and field-service operators favor mobile form factors that enable bedside or tableside billing, pushing a 6.54% CAGR in portable devices through 2031.
What makes healthcare a standout vertical?
Telemedicine, outpatient co-payment digitization, and private-clinic upgrades translate into a 7.27% forecast CAGR, the fastest among end-users.
How does the 2026 fiscal-receipt mandate influence buying cycles?
It forces 3.27 million existing terminals to integrate with SDI, accelerating replacement and giving SDI-ready models a regulatory edge.
Which player holds the strongest competitive position?
Nexi combines a 35-40% acquiring share with bundled hardware and data services, reinforced by the 2021 SIA merger and 2025 Zucchetti integration.